
ABSTRACT
Tailpipe PM (particulate matter) emissions have been reduced due to decades of tightening regulations, however non-tailpipe PM emissions are not regulated and are expected to become a significant source of traffic-related PM emissions. Previous studies have focused on emission measurement from laboratory and track tests. Their findings suggest brake wear PM emission rates are dependent on brake activity. Therefore, it is important to characterize brake emissions by first understanding the real-world brake activity from many different vehicle vocations and driving conditions. The goal of the current study is to establish a test method and analysis for brake activity measurements of heavy-duty vehicles. In this study, brake fluid pressure and brake pad temperature were measured for a heavy-duty vehicle during chassis and on-road driving tests. The chassis tests consisted of the Central Business District (CBD) cycle representative of a repetitive stop-and-go driving pattern of a bus, and the Urban Dynamometer Driving Schedule (UDDS) cycle representative of urban driving conditions of heavy-duty vehicles. The on-road tests consisted of a local Riverside City route focused on urban roads at low vehicle speeds with frequent braking, while the second route from Riverside City to Victorville focused on highway driving and downhill braking. The brake pad temperature of the triplicate CBD cycle gradually increased linearly with a slope of 2.3°C/min and the temperature per kinetic energy lost during braking increased by 2.3 × 10⁻⁵°C/J for the CBD cycle. The UDDS cycles had the largest kinetic energy loss between 3.2 × 10³ to 3.0 × 10⁵ J in the histogram. The local Riverside city route brake temperature increased by 2.0°C/min. The kinetic energy loss for the on-road tests were one order of magnitude larger than that of the dynamometer tests due to brake events occurring under higher speeds.
Implications: The non-tailpipe source contributions to traffic related particulate matter (PM) emissions have surpassed that of tailpipe emissions. The results of this work provide a measurement method to obtain brake activity information for a heavy-duty vehicle, which is critical estimating emission inventory accurately.
Introduction
Particulate matter (PM) from vehicle emissions is of great importance as ambient PM2.5 is known to cause severe health effects (Cohen et al. Citation2017; Tong et al. Citation2020). The consequence of long-term exposure can lead to higher mortality rates due to pulmonary and cardiovascular diseases (Cohen et al. Citation2017). Over the years tailpipe PM emissions from internal combustion engines have reduced due to stringent regulations, however non-tailpipe PM emissions are not regulated and are expected to become the significant source of overall traffic related PM (Shirmohammadi et al. Citation2016; Wahid Citation2018). Non-tailpipe, also referred to as non-exhaust, emissions come from sources, such as brake and tire wear, and from deposited material on the road which can become re-suspended due to vehicle induced turbulence (Grigoratos and Martini Citation2015).
Brake wear particles are produced as a result of the abrasion between the brake pad surface lining and the rotor or drum, which are dominant in the coarse to fine particle size ranges (Bukowiecki et al. Citation2009; Chan and Stachowiak Citation2004; Garg et al. Citation2000; Grigoratos and Martini Citation2015; Sanders et al. Citation2003; Thorpe and Harrison Citation2008). Modern brake pads vary in composition of fibers, matrix binders, friction modifiers, abrasives and fillers (Chan and Stachowiak Citation2004; Grigoratos and Martini Citation2015). This leads to a variability of elemental concentrations composed of iron (Fe), potassium (K), copper (Cu), manganese (Mn), antimony (Sb), aluminum (Al), barium (Ba) and zinc (Zn) that are amongst some of the most common elements reported to be present in brake wear PM2.5 and PM10 (Gietl et al. Citation2010; Grigoratos and Martini Citation2015; Iijima et al. Citation2007; Thorpe and Harrison Citation2008; Wahid Citation2018; Wahlström, Olander, and Olofsson Citation2010).
Previous studies have used laboratory and track tests to simulate real-world driving conditions and have suggested that brake wear PM emission rates are dependent on brake pad lining materials, braking conditions such as deceleration rates and pattern, brake pad temperature, and vehicle size or weight (Agudelo et al. Citation2020; Hagino, Oyama, and Sasaki Citation2016; Iijima et al. Citation2007; Sanders et al. Citation2003; Wahlström, Olander, and Olofsson Citation2010). California’s Air Resource Board (CARB) funded several studies in efforts to understand and quantify brake wear PM emissions for both the laboratory (Agudelo et al. Citation2020) and real world near road environments (CARB project 18RD017). Koupal et al., (Citation2021) used track test brake temperature measurements on a range of heavy-duty vehicles to simulate real-world thermal regimes for dynamometer emissions testing. The track tests followed trends where brake temperatures are seen to be a function of braking power, braking density, and loading. Although their study focused on developing EMFAC rates using a heavy-duty test matrix, their real-time data during event-based braking indicates that particle number and mass are influenced by braking energy, braking vehicle speed, and brake temperature. Additionally, temperature trends during their track testing showed the class 8 vehicle had median brake temperatures of about 65°C and maximum temperature above 121°C when fully loaded compared to median temperature of around 52°C and maximum temperature about 71°C in unloaded condition. Previous studies suggest that brake PM emissions is dependent on brake pad temperature, vehicle speed, and braking patterns (Agudelo et al. Citation2020; Garg et al. Citation2000; Grigoratos and Martini Citation2015). However, the frequency and extent of braking activity varies dynamically in the real world suggesting it is necessary to investigate brake activity for diverse vehicle classes and sizes under in-use conditions. The same vehicle can have different braking activity based on its vocation (such as goods movement, refuse, people transit, and other) as well as route differences.
The goal of the current study is to establish a test method and analysis of brake activity measurement for heavy-duty vehicles. A market representative class 8 truck was tested in the laboratory on chassis dynamometer as well as on the road under real-world conditions. The heavy- duty truck was evaluated during in-use chassis dynamometer and on-road testing. Brake activity was quantified with an instrumented brake pad system that measures brake temperature, brake fluid pressure, vehicle speed, vehicle position, elevation, and ambient conditions. The results from this study will be of value to calculate accurate emission inventory for brake wear PM as emission inventory is obtained as the sum of the product between activity and emission factor.
Methods
Chassis dynamometer tests
Two chassis dynamometer cycles were selected for testing different braking activity patterns represented by heavy-duty transportation buses and urban delivery trucks. These chassis cycles were selected as they provide a basis for understanding commonly used emissions testing cycles and their representativeness for brake pressure, temperature, braking activity, frequency, and intensity compared to the real-world conditions. The first cycle selected was the Central Business District (CBD) and the second cycle is the Urban Dynamometer Driving Schedule (UDDS). The CBD and UDDS cycles were selected to represent real in-use driving activity. The CBD was selected since this represents typical operation of heavy-duty busses on-road and is commonly used for emissions testing. The UDDS was selected because it is representative of typical operation of an HD delivery trucks and is the representative cycle used for certification-like emissions testing on chassis dynamometers.
The CBD cycle follows a sawtooth driving pattern with 14 repetitions of idle, acceleration, cruise, and deceleration modes with a time duration of approximately 560 seconds. Speeds range from 0 to 20 miles per hour with cyclic acceleration and deceleration. The CBD cycle was performed first with a single cycle to warm-up the truck and brakes followed by three consecutive CBD cycles used for testing. This approach is similar to how emissions testing is performed by other research (Miller et al. Citation2013). A single UDDS cycle is approximately 1060 seconds where the vehicle speed can range from 0 to 60 miles per hour with varying acceleration, deceleration, and idle modes. Three consecutive UDDS cycles were performed without warm-up as it was performed within 15 minutes of the triplicate CBD cycles. The chassis was configured for a total test weight of 65,000 lb (= 29484 kg) which represents the tractor plus trailer weight. This weight is representative of typical goods movement operation in the South Coast Air Basin (Miller et al. Citation2013) and also matches the on-road weight of the tractor trailer combination.
On-road tests
On-road tests were performed to compare real-world operation with the laboratory chassis testing. The same chassis test vehicle was driven along two different California routes where the HDV was configured with a total weight of 65,000 lb ( = 29484 kg) to maintain consistency between on-road and laboratory testing. One route was designed to be representative of the CBD and UDDS type of stop and go activity and is denoted as the Local route. The local route is represented by local Riverside city streets, which primarily follows straight paths with frequent stops due to stop signs and traffic lights, average elevations near ~263 m, and average slope of ±1.6% (Figure S1). The pavement was asphalt. The second route was designed to represent higher speed cruise conditions where higher braking energy is expected. This route is denoted as the Cruise route. The Cruise route, is representative of long-distance driving on the I-215 freeway connecting City of Riverside and Victorville, CA. The route elevation ranges from ~288 m in Riverside City which gradually increases over a ~60 km distance to a maximum of 1,280 m, then decreases to 896 m at the City of Victorville (Figure S2). This Cruise route was selected to investigate braking activity during higher vehicle speeds and varying acceleration and deceleration conditions. In addition, the Cruise route also was selected to investigate brake activity during downhill heating and uphill cooling conditions. The route contains a 14 km uphill section of the Cajon Pass with an average slope of 3.5% that becomes a downhill section in the return trip. The pavement was made of concrete.
Test vehicle and brake system
A Freightliner Cascadia model year 2015 tandem axle day cab equipped with a 12.8 L Detroit Diesel DD13 engine and drum brakes was selected for this study. The Cascadia model truck represents a market share of 37.7% as of 2021 (National Automobile Dealers Association Citation2022), and is, thus, representative of a commonly utilized test vehicle for this study. This class of vehicles are commonly used as goods movement trucks, transit buses, and refuse haulers (Hill Citation2021). The curbside vehicle weight was reported as 15,892 lb ( = 7,208 kg) and was tested at a total vehicle weight of 65,000 lb ( = 29484 kg). The test vehicle uses an air brake drum system as opposed to the less common disk brake type of system for the heavy-duty vehicles. Each of the vehicle’s left and right rear drum brake was equipped with a pair of Meritor Genuine Q Plus brake shoes (Model KSMA20014711QP). A new pair of brake replacement components weighs about 20 kg with a brake diameter of 42 cm and shoe width of 22 cm. Although the brake lining material is not detailed by the manufacturer, it is classified as MA2001.
Data collection
Brake pressure, brake temperature, vehicle speed and GPS were measured in real-time, and meteorological data was obtained from nearby weather stations. The test vehicle brake pressure from the fluid line of the right rear canister was measured using an Omega P×319-200G5V pressure transducer. This method allowed for the closest measurement of the braking pressure at the drum assembly. The installation was completed by a third-party certified heavy-duty truck brake and repair facility. Given that the test vehicle brake system pressure was set at 135 psi, the pressure transducer selected had a maximum range of 150 psi. The left rear brake pressure was not measured, but estimated to be equivalent to the measured right rear brake.
Brake pad (or liner) temperature was measured with a custom-made type K thermocouple with a 1/8 inch ( = 3 mm) diameter cap encasing. Figure S3 shows a schematic of the brake drum assembly showing the leading edge of the brake lining and thermocouple installation location relative to the entire brake shoe. The cap material is a copper tube with approximately one inch ( = 2.5 cm) length and was inserted through the backing plate into the brake pad material. The backing plate was drilled providing a 1/8 inch (=3 mm) hole through the friction material and milled the last 10 mm to provide a flat square surface at the bottom of the hole. The thermocouple was installed by coating the cap with a layer of conductive paste. The thermocouple was installed 2 mm below the pad surface to reduce the risk of brake damage, as well as considering brake pad wear during testing. This approach was recommended by other brake measurement studies (Agudelo et al. Citation2019, Citation2020). Both the left and right wheel-brake assemblies contained this thermocouple to provide a back-up sensor in case one was damaged or failed to record during testing.
Both the thermocouple and pressure sensor had lead wires secured outside the wheel-brake assembly to allow for connection to a custom-made data logger. The datalogger contained inputs for the K-type thermocouple and pressure sensor, power supply, and a start & stop button. Data was recorded onto a micro-USB chip inside the data logger with a time resolution of 1 Hz. The logger recorded ambient temperature (°C), brake pad temperature (°C), and brake pressure (psi). The data logger was used during both chassis and on-road testing. It was powered using a Honda 220-watt generator and secured in the space between the truck and the cargo during the on-road testing. Prior to all testing, the logger underwent a set of three one-minute-long warm up tests to record an averaged offset start time between the equipment and NIST official U.S. time. In addition, an OBD2 HEM logger was used in conjunction with the brake logger to obtain data from the test vehicle ECM (Engine Control Module). Vehicle GPS (Global Positioning System) data including latitude, longitude, vehicle speed, and altitude were recorded. The HEM logger was used for both chassis and on-road testing. Ambient data was obtained using three local weather stations managed by the California Irrigation Management Information System (CIMIS). The CIMIS data is audited and well managed and is considered of high quality. To match the locations of the chassis and on-road testing sites, station 44 in Riverside, Station 251 in Highland, and station 117 in Victorville were used. Station 44 was used as an ambient temperature and relative humidity reference for both chassis tests as well as the Local Riverside city route. Stations 251 and 117 were used as a reference for the Cruise route as Highland is located near the I-215 freeway and is part of the route, while Victorville is the turnaround point of the route.
Results and discussion
Chassis and on-road tests
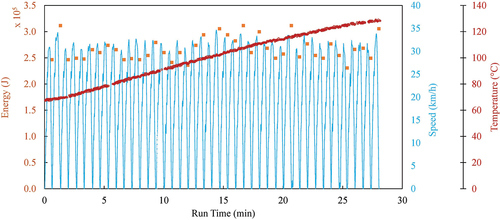
shows the braking energy, vehicle speed, and brake temperature during the triplicate CBD test cycle. The drive pattern was maintained between speeds from 0 to 32 km/h. The temperature profile of the right rear brake showed an initial brake pad temperature of about 65°C. This starting temperature was due to a single CBD warm up cycle performed prior to the triplicate test. Due to the constant short periods of friction between the brake pad and drum during braking events, the temperature gradually increased linearly with a slope of 2.32°C/min and reached a final temperature of 130°C at the end of the test. The recorded brake fluid pressure signals, as shown in Figure S4, were observed to increased and decreased in a cyclic pattern which coincided with the decreases and increases in speed. Therefore, pressure was used as a good indicator of braking events. When the brakes were not engaged, the brake pressures were less than 5.5 kPa and at the start of a braking the pressure exceeded values above 5.5 kPa where pressure peaks occurred between 150 and 200 kPa with a maximum reaching 250 kPa. To observe deceleration trends, the 1 Hz acceleration data were averaged over a three second period (Figure S5). The acceleration and deceleration trends for the first CBD contained magnitudes that ranged from −0.79 m/s2 to −0.57 m/s2 and were highest in frequency within the range of −.70 m/s2 to −0.66 m/s2 as shown in the histogram in Figure S6. For this study, the kinetic energy lost was also computed using the vehicle weight, change in speed during each braking event, and multiplied by a unit of −1 to observe results to compare with speed profiles in . Absolute values of kinetic energy lost showed a bimodal trend within a range of 2.3 × 10⁵ J to 3.1 × 10⁵ J with a larger frequency in the 2.4 × 10⁵ J to 2.5 × 10⁵ J range in Figure S7. To determine the relationship between braking temperature and energy lost, the rate of temperature increase was divided by the sum of kinetic energy lost within each individual CBD cycle. Assuming braking load is equally distributed among all wheels, the ratio was divided by the number of drum brake assemblies. Therefore, the brake pad temperature increased by 2.4 × 10⁻⁵ °C/J for the first CBD cycle, followed by 2.3 × 10⁻⁵ °C/J for the second and third cycles.
Figure 1. Magnitude of kinetic energy lost in Joules of braking events superimposed on the vehicle speed profile in km/h and brake temperature in °C during three consecutive CBD cycles.
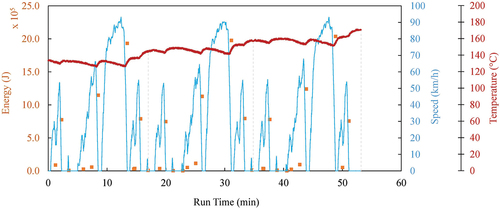
The braking energy, vehicle speed, and brake temperature for the triplicate UDDS test cycle are shown in . The temperature uses data from the sensor installed on the rear left drum of the vehicle. However, the pressure remained on the right rear drum. A 20-minute rest period occurred between the triplicate CBD test and the triplicate UDDS test, therefore an initial temperature of 135°C was recorded. This indicates that the brakes may not cool down quickly between tests. The brake temperature profile cycled between short increases of about 2–3°C followed by longer intervals of temperature cool downs of about 5°C. This behavior results from the design of the UDDS test cycle where varying braking intensities occurs after reaching vehicle speeds of about 30 km/h, 65 km/h, and 95 km/h. During braking events, the pressure increased up to 250 kPa with a single max around 300 kPa (Figure S8). The frequency distribution of the three second averaged deceleration during braking shows two main frequency modes in the −0.76 to −0.69 m/s2 range and a second one in the −0.48 to −0.35 m/s2 range (Figure S9). Two smaller distinct peaks occurred within the −0.55 to 0.48 m/s2 range and −0.35 to −0.28 m/s2 range. This occurrence is expected because of the varying speed profiles in an UDDS cycle. As a result, kinetic energy lost ranged from 3.2 × 10³ J to 2.0 × 10⁶ J in comparison to the speed profile. The energy range with the largest frequency occurred between 3.2 × 10³ to 3.0 × 10⁵ J (Figure S10).
Figure 2. Magnitude of kinetic energy lost in Joules of braking events superimposed on the vehicle speed profile in km/h during three consecutive UDDS cycles.
ERG and Link engineering conducted a CARB and Caltran co-funded brake dynamometer study (Koupal et al. Citation2021) to measure brake wear particle emissions in the lab for heavy-duty vehicle brake systems. They reported brake wear emissions in terms of PM2.5 mass/stop for the UDDS. Their data ranges from 10 kJ to 1MJ kinetic energy loss. The brake PM2.5 emissions are ~200 µg/stop at 100 kJ and ~1000 µg/stop at 1MJ kinetic energy loss. They used QCM-MOUDI for the real-time measurement. The behavior of QCM-MOUDI during emissions testing was not well-known and therefore the values reported by them need to be used with caution.
Temperatures recorded and deceleration rates for both chassis tests are similar to those reported by Chasapidis et al. (Citation2018). Their study also used chassis dynamometer tests on a light duty truck under urban driving conditions with initial speeds of 50 km/hr and 30 km/hr while varying deceleration rates at 0.5 and 2.5 m/s2. The brake pad temperatures were measured using a thermocouple installed within the brake pad material at the center of all axis, and the temperature was seen to reach maximum values of 195°C to 220°C for the 50 km/hr tests and 140°C to 180°C for the 30 km/hr tests. Their findings show that high brake pad temperatures above 140°C led to bimodal brake wear particle distributions with one peak in the ultrafine size range, while temperatures below 100°C show mean aerodynamic diameter of 1.5 µm. This relationship indicates the importance of developing a test method to quantifying real-world braking temperatures.
During the local on-road test route, vehicle speed for the GPS and backup ECU wheel-based speed were measured. The GPS data showed connection issues resulting in data loss during the majority of the test (Figure S11). Although the wheel-based vehicle speed measurements showed similar drop outs, it was used to provide speed profiles in areas where GPS was missing. There were no warmup tests performed prior to the Riverside City test, and the temperature measured on the left rear brake showed an initial temperature of 10°C, which matched ambient conditions for that day. The temperature profile in begins with a stable temperature at 10°C for a period of 15 minutes during vehicle idle condition followed by a gradual increase to 75°C at 45 minutes. Similar to the triplicate CBD test, the temperature rise increased by 2.03°C/min. The Riverside route focused on low-speed urban driving with frequent braking due to stops at traffic signals. The temperature reached up to 70°C at the end of the 45 minute local route test. shows no spikes in brake fluid pressure during the idle period of the test, followed by braking fluid pressures ranging from 75 to 150 kPa with maximums reaching 220 kPa. Pressure magnitude coincided with both chassis test results. The frequency of deceleration ranged from −8.60 × 10⁻¹ to 8.09 × 10⁻¹ m/s2, with a higher frequency between the −4.43 × 10⁻¹ to −2.56 × 10⁻² m/s2 range (Figure S12). Kinetic energy lost during braking events, shown in , was obtained following the same procedure used for the chassis tests using the wheel-based vehicle speed in conjunction with the GPS speed. The braking energy lost suggests a higher frequency in the −7.33 × 10⁻⁵ to 1.43 × 10⁶ Joule bin compared to the chassis testing (Figure S13). Although kinetic energy calculations used a multiplying factor of −1, the Local route showed one frequency of energy loss in the negative range at −2.89 × 10⁶ Joules as a result of downhill road conditions with low braking intensities between 55 kPa 60 kPa brake fluid pressure.
Figure 3. Magnitude of kinetic energy lost in Joules of braking events superimposed on the vehicle speed recorded by the GPS and wheel-based vehicle speed recorded by the ECU during the local Riverside city on-road test.
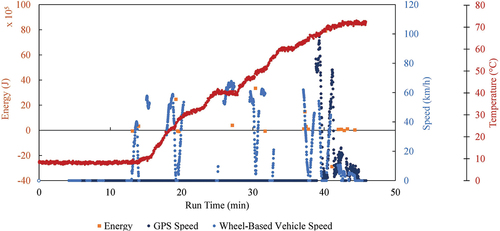
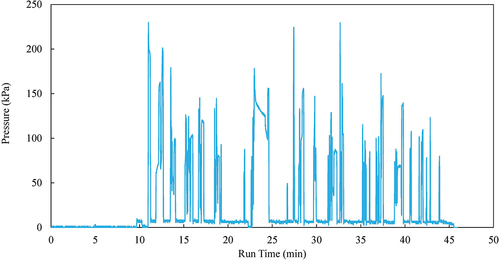
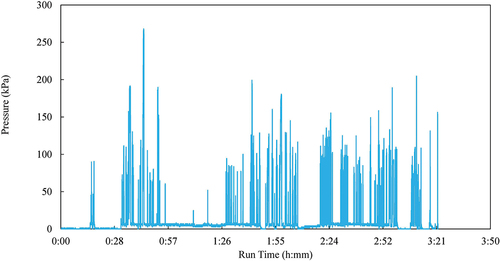
Figure 4. Braking pressure in kPa recorded from the pressure transducer installed on the left rear brake canister during the local Riverside city on-road test.
shows the braking energy, wheel-based vehicle speed, GPS vehicle speed and brake temperature measured during the long-distance Cruise route. Both vehicle speed and altitude were recorded during a run time of 2 hours and 20 minutes with missing data during the remainder of the test. The altitude was recorded to show the difference in elevation between Riverside city and Victorville (Figure S14). The brake temperature showed an increasing trend with a few periods of brake cooling. Maximum brake temperature occurred at 165°C similar to the UDDS test. The brake fluid pressure was the highest during the long-distance Cruise route testing and was typically around 100–150 kPa with several spikes near 200 kPa. A maximum pressure occurred at 255 kPa as shown in . The brake pressure averaged 135 kPa during the downhill grade in the middle of the route suggesting downhill brake fluid pressure is similar to other stop and go brake pressures for a truck loaded at 65,000 total lb.
Figure 5. Magnitude of kinetic energy lost in Joules of braking events superimposed on the vehicle speed recorded by the during the long-distance Cruise route.
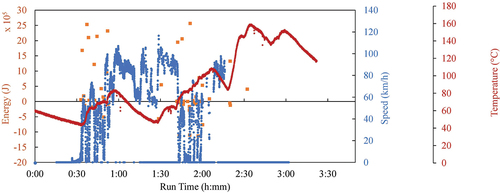
Figure 6. Braking pressure in kPa recorded from the pressure transducer installed on the left rear brake canister during the long-distance Cruise route.
The braking activity acceleration profile consisted of a large frequency in the −9.1 × 10⁻¹ to 1.5 m/s2 range (Figure S15). For the energy lost during braking, the positive values correspond to braking events with initial speed larger than the final speed. The negative values are likely due to changes in road elevation where brakes are applied but the vehicle increases speed while traveling downhill. The histogram of kinetic energy ranged from −2.4 × 10⁷ J to 6.64 × 10⁶ J (Figure S16). The most frequent values of kinetic energy lost are in the −1.92 × 10⁶ to 2.36 × 10⁶ J. The kinetic energy loss for the on-road tests are an order of magnitude larger than that of the dynamometer tests where on-road decelerations are two to three times larger than chassis decelerations which lead to large kinetic energy difference. Both on-road tests used an attached hauling load to simulate a vehicle weight of 29,484 kgs. Koupal et al. (Citation2021) showed brake temperatures can reach 160°C when fully loaded for a class 8 vehicle at a weight of~36,287.4 kg compared to the unloaded scenario of~17,009.7 kg at 71°C. This agrees with the maximum temperature observed during the long-distance Cruise route, but not the local city route. Discrepancies of the temperature results are discussed in the next section.
ERG and Link engineering conducted a CARB and Caltran co-funded brake dynamometer study to measure brake wear particle emissions in the lab for heavy-duty vehicle brake systems. They reported brake wear emissions in terms of PM2.5 mass/stop for the UDDS. Their data ranges from 10 kJ to 1MJ kinetic energy loss. Kinetic energy loss data has a weak correlation (R2 = 0.35) against brake PM mass data per stop. The brake PM2.5 emissions can be estimated to be about 10 µg/stop at 100 kJ and 400 µg/stop at 1MJ kinetic energy loss. They used QCM-MOUDI for the real-time measurement. The behavior of QCM-MOUDI during emissions testing was not well-known and therefore the values reported by them need to be used with caution.
Bench top testing
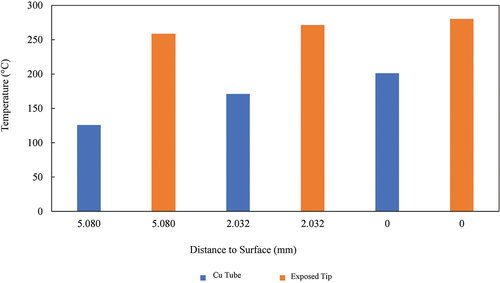
A laboratory bench top experiment was setup for the brakes to evaluate temperature measurements recorded during the chassis and on-road tests. The temperature sensor was left intact from the testing conditions and was compared with an exposed tip thermocouple. A heat source utilizing a 3 inch ( = 7.6 cm) diameter premixed flame from a camping stove was placed one inch away from the surface of the brake pad. Temperature was recorded at two depths, one being approximately 2 mm from the brake pad surface, while the second was approximately 5.2 mm away from the pad surface (Figure S17). This allowed an evaluation of the sensor at two depths and to calculate the temperature at the surface of the pads using 1 dimensional Fourier’s law. shows lab results for the two different probes and three different depths of 5, 2, and 0 mm from the surface. The exposed tip thermocouple showed a much higher temperature by almost 100°C compared to the copper capped thermocouple used in the dynamometer and on-road testing. We attribute this to the long copper cap exchanging heat along the linearly decreasing temperature away from the heated surface. The copper capped thermocouple measured a somewhat averaged temperature along the brake pad depth. At the lab test condition where heat flux was relatively constant, the difference between the exposed tip and copper probe was about 100°C to 150°C. Also, the loss in temperature for the exposed tip thermocouple did not vary as much between 5 and 2 mm which suggests the probe type is more important than probe depth, however, both should be properly controlled.
Figure 7. Maximum temperature of the copper and exposed probe after 2 minutes of heating exposure.
Conclusion
Brake activity was measured for two laboratory cycles (CBD and UDDS) and two on-road routes utilizing a heavy-duty vehicle while measuring brake fluid pressure and brake pad temperature. The brake kinetic energy was much higher for the on-road tests compared to the laboratory tests where the on-road activity resulted in ten times higher kinetic energy losses compared to the chassis testing. As such, brake activity from the same heavy-duty vehicle can be more than double due to the route where higher brake temperature is expected with higher hauling weights. Overall brake pressures remained relatively consistent and varied from 135 to 206 kPa during braking events for laboratory and on-road testing. The brake temperatures ranged from 60°C to 160°C but it is possible that the true maximum temperatures could be over 260°C if an exposed tip thermocouple probe were utilized. It is recommended to utilize an exposed tip thermocouple to measure brake pad temperature at the targeted depth of two mm. This method can help establish a continuous real-world measurement of brake temperature on other vehicles with different class sizes, vocation, and hauling load. For future work, simultaneous measure of the brake particle emission along with the brake activity can be used to find a relationship between real world braking activity and brake particle emissions.
Author contribution
Jung and Johnson designed the test. Lopez conducted test and all authors contributed to the manuscript. We are grateful to John Koupal sharing data from the final report of their brake emission testing project.
Brakes_SupplementalFigures v4.docx
Download MS Word (2.1 MB)Disclosure statement
No potential conflict of interest was reported by the authors.
Data availability statement
The data used in this study is available and can be downloaded at the following repository: https://doi.org/10.6086/D14H5C
Supplementary material
Supplemental data for this paper can be accessed online at https://doi.org/10.1080/10962247.2023.2205367
Additional information
Funding
Notes on contributors
Brenda Lopez
Brenda Lopez is a graduate at the University of California Riverside.
Kent Johnson
Kent Johnson is a research faculty at the University of California Riverside.
Heejung Jung
Heejung Jung is a professor at the University of California Riverside.
References
- Agudelo, C., R.T. Vedula, J. Capecelatro, and Q. Wang. September 2019. Design of experiments for effects and interactions during brake emissions testing using high-fidelity computational fluid dynamics. SAE Technical Paper 2019-01–2139, Warrendale, PA: SAE International. doi:10.4271/2019-01-2139.
- Agudelo, C., R.T. Vedula, S. Collier, and A. Stanard. October 2020. Brake particulate matter emissions measurements for six light-duty vehicles using inertia dynamometer testing. SAE Int. J. Adv. Curr. Pract. Mobil 3 (2), Art. no. 2020-01–1637. doi:10.4271/2020-01-1637.
- Bukowiecki, N., P. Lienemann, M. Hill, R. Figi, A. Richard, M. Furger, K. Rickers, G. Falkenberg, Y. Zhao, S. S. Cliff, et al. November 2009. Real-world emission factors for antimony and other brake wear related trace elements: Size-segregated values for light and heavy duty vehicles. Environ. Sci. Technol. 43 (21):8072–78. doi:10.1021/es9006096.
- Chan, D., and G.W. Stachowiak. September 2004. Review of automotive brake friction materials. Proc. Inst. Mech. Eng. Part J. Automob. Eng. 218 (9):953–66. doi:10.1243/0954407041856773.
- Chasapidis, L., T. Grigoratos, A. Zygogianni, A. Tsakis, and A.G. Konstandopoulos. December 2018. Study of brake wear particle emissions of a minivan on a chassis dynamometer. Emiss. Control Sci. Technol. 4 (4):271–78. doi:10.1007/s40825-018-0105-7.
- Cohen, A.J., M. Brauer, R. Burnett, H.R. Anderson, J. Frostad, K. Estep, K. Balakrishnan, B. Brunekreef, L. Dandona, R. Dandona, et al. May 2017. Estimates and 25-year trends of the global burden of disease attributable to ambient air pollution: An analysis of data from the Global Burden of Diseases Study 2015. Lancet 389 (10082):1907–18. doi:10.1016/S0140-6736(17)30505-6.
- Garg, B.D., S.H. Cadle, P.A. Mulawa, P.J. Groblicki, C. Laroo, and G. A. Parr. November 2000. Brake wear particulate matter emissions. Environ. Sci. Technol. 34 (21):4463–69. doi:10.1021/es001108h.
- Gietl, J.K., R. Lawrence, A.J. Thorpe, and R.M. Harrison. January 2010. Identification of brake wear particles and derivation of a quantitative tracer for brake dust at a major road. Atmos. Environ. 44 (2):141–46. doi:10.1016/j.atmosenv.2009.10.016.
- Grigoratos, T., and G. Martini. February 2015. Brake wear particle emissions: A review. Environ. Sci. Pollut. Res. 22 (4):2491–504. doi:10.1007/s11356-014-3696-8.
- Hagino, H., M. Oyama, and S. Sasaki. April 2016. Laboratory testing of airborne brake wear particle emissions using a dynamometer system under urban city driving cycles. Atmos. Environ. 131:269–78. doi:10.1016/j.atmosenv.2016.02.014.
- Hill, S. 2021. Medium- & heavy-duty vehicles: Market structure, environmental impact, and EV readiness. M.J. Bradley & Associates. July 28. Accessed February 3, 2022. https://www.mjbradley.com/reports/medium-heavy-duty-vehicles-market-structure-environmental-impact-and-ev-readiness.
- Iijima, A., K. Sato, K. Yano, H. Tago, M. Kato, H. Kimura, and N. Furuta. July 2007. Particle size and composition distribution analysis of automotive brake abrasion dusts for the evaluation of antimony sources of airborne particulate matter. Atmos. Environ. 41 (23):4908–19. doi: 10.1016/j.atmosenv.2007.02.005.
- Koupal, J., A. DenBleyker, S. Kishan, R. Vedula, and C. Agudelo. May 2021. Brake wear particulate matter emissions modeling. Final Report CA21-3232, Eastern Research Group, LINK Engineering.
- Miller, W., K.C. Johnson, T. Durbin, and P. Dixit. 2013. In-use emissions testing and demonstration of retrofit technology for control of on-road heavy-duty engines. Final Rep. South Coast Air Qual. Manag. Dist. Contract (11612).
- National Automobile Dealers Association. 2022. Class 8 truck manufacturers’ market share in the U.S. as of December 2021 [graph]. Statista. January. Accessed January 30, 2022. https://www.statista.com/statistics/274937/market-share-of-truck-manufacturers-in-the-united-states/.
- Sanders, P.G., N. Xu, T.M. Dalka, and M.M. Maricq. September 2003. Airborne brake wear debris: Size distributions, composition, and a comparison of dynamometer and vehicletests. Environ. Sci. Technol. 37 (18):4060–69. doi:10.1021/es034145s.
- Shirmohammadi, F., S. Hasheminassab, D. Wang, J.J. Schauer, M.M. Shafer, R.J. Delfino, and C. Sioutas. July 2016. The relative importance of tailpipe and non-tailpipe emissions on the oxidative potential of ambient particles in Los Angeles, CA. Faraday Discuss. 189:361–80. doi:10.1039/C5FD00166H.
- Thorpe, A., and R.M. Harrison. August 2008. Sources and properties of non-exhaust particulate matter from road traffic: A review. Sci. Total Environ. 400 (1):270–82. doi:10.1016/j.scitotenv.2008.06.007.
- Tong, R., J. Liu, W. Wang, and Y. Fang. February 2020. Health effects of PM2.5 emissions from on-road vehicles during weekdays and weekends in Beijing, China. Atmos. Environ. 223:117258. doi:10.1016/j.atmosenv.2019.117258.
- Wahid, S.M.S. January 2018. Automotive brake wear: A review. Environ. Sci. Pollut. Res. 25 (1):174–80. doi:10.1007/s11356-017-0463-7.
- Wahlström, J., L. Olander, and U. Olofsson. April 2010. Size, shape, and elemental composition of airborne wear particles from disc brake materials. Tribol. Lett. 38 (1):15–24. doi:10.1007/s11249-009-9564-x.