
ABSTRACT
Radon is a prevalent carcinogenic gas and the leading cause of lung cancer in the United States besides smoking. As the residential environment is the primary source of radon exposure, accessible and accurate measurements of radon in this environment are essential. However, no radon monitors have been evaluated that are inexpensive enough for regular household use. In this study, we examine two household-grade, continuous monitoring devices, the Ecosense RadonEye and EcoQube. We compare them to two research-grade instruments, the Durridge Company Rad7 and the Rad Elec Inc. E-PERM. In our study, the Ecosense household radon monitors performed accurately and can be used by homeowners and researchers alike as an affordable and reliable radon sensor.
Implications: The ability of homeowners and renters to regularly monitor the radon levels inside their home is an important preventative health measure. However, low-cost instrumentation is needed that can provide accurate radon measurements. In this study, we show that the affordable Ecosense continuous monitors produce results that are in line with expensive research-grade instruments in a residential environment, over a range of concentrations. The Ecosense monitors may be suitable for home use, and they may provide a solution that can be used by policymakers and home-dwellers alike to improve regular radon monitoring in residences.
Introduction
Exposure to radon – including 222Rn, 220Rn, and their progeny – is the leading cause of lung cancer besides smoking (Copes and Scott Citation2007; US Environmental Protection Agency Citation2009) and the largest cause of radiation exposure in the U.S. outside of medical procedures (National Council on Radiation Protection and Measurements Citation1987). 222Rn is a colorless and odorless radioactive gas that decays (half-life 3.8 days) into radiation-emitting products (Porstendorfer and Reineking Citation1999; Porstendörfer Citation1994). 220Rn is even shorter lived (half-life 55 seconds) (Kanse et al. Citation2013). Radon enters homes by emission from soil and materials into the air through cracks and joints in the building, and it can accumulate to high concentrations in areas with reduced ventilation, particularly basements (Kearfott Citation1989; Li et al. Citation2022; Nazaroff Citation1992; White et al. Citation1992).
Radon has numerous cancer and non-cancer health effects. Inhalation of radon decay products causes irradiation of respiratory tract cells (National Council on Radiation Protection and Measurements NCRP Citation1999). Other studies found an association between residential radon exposure and cardiovascular disease (Nyhan et al. Citation2018, Citation2019), childhood leukemia (Lubin et al. Citation1998; Raaschou-Nielsen et al. Citation2008), breast cancer (VoPham et al. Citation2017), and hypertensive disorders of pregnancy (Papatheodorou et al. Citation2021). Mechanistically, radiation exposure from the decay of radon progeny can lead to oxidative stress and systemic inflammation after deposition in the lungs and migration throughout the body (Blomberg et al. Citation2020; Nel Citation2005; Taylor and Gercel-Taylor Citation2013; Thomashow et al. Citation2013).
As the home environment is the primary exposure source of radon, measuring and evaluating residential exposures to radon is essential for predicting the health effects of household exposure (United States Environmental Protection Agency Citation2003). Methods for radon monitoring include both passive and active devices (Carmona and Kearfott Citation2019; Keith et al. Citation2012). The period over which these devices measure can be long- or short-term. Radon levels in homes vary widely throughout the day, between days, and between seasons, so longer term measurements are important for accurately estimating average annual exposures under normal building conditions (Li et al. Citation2022; Steck et al. Citation2004). Among the devices capable of longer-term measurement, integrated devices provide an average measurement over an extended period, while continuous measurement devices provide frequent, often hourly, measurements. While longer-term measurements are important for quantifying exposure and estimating health effects, understanding the short-term variability is critical for identifying the cause of high radon levels in homes and the maximum radon exposure at given times of day. Hourly measurements allow for higher resolution monitoring, the ability to calculate the mean and standard deviation over short time periods, and analysis of peak values, which are all important metrics for looking at health endpoints. Hourly measurements also provide better precision for indoor air chemistry analyses.
Radon monitoring devices vary significantly in price, availability, sensitivity, accuracy, and response to environmental conditions, particularly humidity. Comparing across these different devices is valuable as it could save researchers and homeowners money and time if cheaper, easier-to-use instruments are available. For exposure studies, a sensor that is inexpensive is advantageous because it allows measurements to be made in multiple locations at the same time for a period of days or weeks.
Previous studies have compared the effectiveness of radon monitors (Burghele and Cosma Citation2013; Cardellini et al. Citation2016; Chung, Piersma, and Kearfott Citation2021; Gunning et al. Citation2016; Janik et al. Citation2010; Papp, Cosma, and Cucos Citation2016). However, many of these studies are limited by the fact that they do not utilize environmentally-relevant radon concentrations; they are conducted under laboratory conditions rather than in the field (or in subterranean chambers, with high levels of radon that are less relevant to residential environments); they do not intercompare integrated and continuous devices; and/or they compare over short time periods (24 hr).
In this study, we compare four different instruments collocated in a home basement in Framingham, Massachusetts: two low-cost, commercially available household sensors (RadonEye and EcoQube, Ecosense, Haebong-ro, Danwon-Gu, Ansan-city, Gyeonggido, South Korea). These are compared to one research-grade electrostatic precipitation instrument (Rad7, Durridge Company Inc., 524 Boston Road, Billerica, MA 01821) and a pair of electret passive environmental radon monitors (E-PERM, Rad Elec Inc., Frederick, MD, USA).
Methods
In accordance with the U.S. Environmental Protection Agency radon sampling protocol, all samplers and devices were placed at least 2 feet above the floor, at least 3 feet from any doors or windows, and at least 4 inches away from any indoor surface. Samplers or devices were located a minimum of 4 to a maximum of 20 inches apart. Samplers and devices and their performance characteristics are summarized in .
Table 1. Radon devices compared in this study.
The RadonEye and EcoQube are radon measurement devices using pulsed ionization chamber technology that provides continuous, hourly (60-minute moving average) measurements. Integrated radon measurements were made using the E-PERM, which is a passive electret-based method. The E-PERM consists of an electret (a dielectric material carrying an electrical charge) mounted on an ion chamber with a filtered diffusion barrier. The initially charged electret in the E-PERM is neutralized by ions generated from radon decay in the ion chamber, causing the electret voltage to drop. This voltage drop is proportional to the time-integrated progeny concentration (Copes and Scott Citation2007). After sample collection, the electret voltage drop was measured with a voltage reader, which was calibrated using references provided by the manufacturer. Other reference methods using charcoal canisters or charcoal liquid scintillation vials were not suitable because they are not reliable under conditions of elevated relative humidity expected in the test homes. The RAD7 is an active electronic radon detector that measures alpha particles by spectrometry using a passivated implanted planar silicon detector to measure the energy of each alpha particle.
For comparison of the integrated device (E-PERM) with EcoQube and Radon Eye, the dates of sampling ranged from 3/6/2021 to 7/21/2022, spanning 502 days. The average duration for the E-PERM measurement was 4.5 days, with a range of 2.9 to 9.1 days. Two E-PERM instruments were used in each location, and the average of the 2 measurements were reported. The hourly values for the continuous instruments were averaged for comparison to the integrated instrument. The EcoQube #3 (EQ#3) vs. Radon Eye 1868 (RD1868) comparison used data from 9/9/21 to 7/26/2022, spanning 320 days. The comparison of the RD 1868 and EQ #3 to the RAD7 used measurements from 9/21/2021 to 7/4/2022, spanning 286 days. Instrumentation was added at different points depending on availability.
We took the 12-hour average for each device to compare among the continuous monitors. This helps control for noise and the fact that each device was not started precisely at the same time. The range of time spread between collocated device measurements was 0 to 14 minutes apart.
Comparison across devices was performed using linear regression (Python v. 3.9.7 using NumPy2) and characterized by the slope, intercept and R2 of the regression.
Results and discussion
The RadonEye and EcoQube sensors both use pulsed ion chambers. These sensors have several similarities but also differences that make them suitable for use in different situations once their performance has been validated. The display on the RadonEye shows the numerical concentration for the previous 10-minute interval as well as the hourly and daily levels, whereas the EcoQube display consists of an LED light where the color indicates the concentration range (green for <100 Bq/m3, yellow for 100-148 Bq/m3 and red for >148 Bq/m3, the EPA action level for recommending radon remediation in homes). The EcoQube requires a Wi-Fi connection to transmit concentrations, while the RadonEye does not. We have studied the field performance of both devices in a residential environment where the radon levels have a wide range of concentrations.
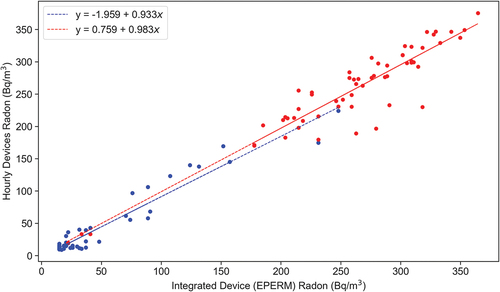
Comparison of the continuous monitoring instruments (EcoQube, EQ #1 and Radon Eye, RD 1868) with the integrated device (EPERM) is shown in . The regression lines relating EQ#1 and RD 1868 to EPERM had slopes of 0.933 and 0.983, respectively. The coefficients of determination were 0.93 and 0.88 for EQ #1 yellow for 100 and RD 1868, respectively. Some variability in slope, intercept and correlation is due to the fact that the measurements took place in different locations for much of the testing span, and only collocated for a few of the measurements. As such, a different range and distribution of concentrations resulted.
Figure 1. Continuous (hourly) versus integrated EPERM radon device measurements (Bq/m3 (National Council on Radiation Protection and Measurements Citation1987). The hourly devices are Ecosense EcoQube (EQ #1) (blue) and Ecosense Radon Eye (RD 1868) (red). Coefficient of determination (R2) values are 0.93 and 0.88 for EQ #1 and RD 1868, respectively. The sample size for EQ#1 is n = 47 and for the RD 1868 is n = 59.
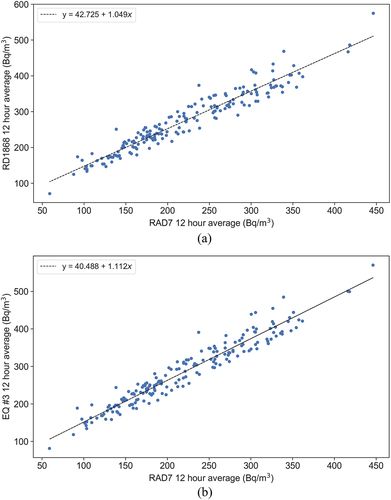
The continuous instruments comparison against the research-grade continuous monitor, RAD7, is shown in . Both instruments compared well to the RAD7, with slopes of the linear regressions for RD 1868 and EcoQube #3 (EQ#3) against the RAD7 of 1.049 and 1.112, respectively. The coefficients of determination were 0.92 and 0.93 for the RD and EQ#3, respectively.
Figure 2. Comparison of (a) Radon Eye (RD 1868) against RAD 7 (R2 = 0.92) (n = 186) and (b) EcoQube (EQ #3) against RAD7 (R2 = 0.93) (n = 186), 12-hour average (Bq/m3) (National Council on Radiation Protection and Measurements Citation1987).
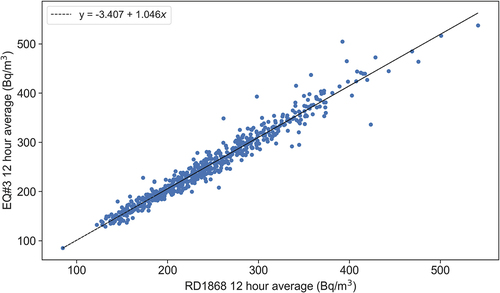
The collocated Ecosense instruments, Radon Eye and EcoQube, show very good agreement (). Consistent results are expected from two instruments measuring at the same time in the same environment (basement). The slope of the regression line fit to the plot of EQ#3 vs. RD 1868 was 1.046. The coefficient of determination was 0.95.
Figure 3. Radon Eye 1868 (RD 1868) versus EcoQube #3 (EQ#3) (R2 = 0.95) (n = 590), 12-hour collocated measurements in the basement (Bq/m3) (National Council on Radiation Protection and Measurements Citation1987).
The Ecosense continuous monitors are in good agreement with both the more expensive research grade instruments and with the integrated monitor in a residential environment, over a range of concentrations. These low-cost sensors performed well, even under basement conditions where the relative humidity was elevated, and because they are relatively inexpensive it is practical to deploy them in field studies where sensors are deployed in multiple locations at the same time, for periods of days or weeks. These qualities also make the Ecosense monitors suitable for home use.
Author contributions
P.K. and J.L. conceived of the project. J.L. collected the samples. R.A.S. and P.K. performed calculations and analysis. All authors were involved in writing the manuscript. All authors read and approved the final version of the manuscript.
Data access
R.A.S. and P.K. had full access to all the data in the study and take responsibility for the integrity of the data and the accuracy of the data analysis.
Disclosure statement
No potential conflict of interest was reported by the author(s).
Data availability statement
The data that support the findings of this study are openly available in Figshare at http://doi.org/10.6084/m9.figshare.21365307.
Additional information
Funding
Notes on contributors
Rebecca A. Stern
Rebecca A. Stern is a postdoctoral researcher in the Department of Environmental Health at the Harvard T.H. Chan School of Public Health in Boston, MA.
Joy Lawrence
Joy Lawrence is a research associate in the Department of Environmental Health at the Harvard T.H. Chan School of Public Health in Boston, MA.
Jack M. Wolfson
Jack M. Wolfson is a research associate in the Department of Environmental Health at the Harvard T.H. Chan School of Public Health in Boston, MA.
Longxiang Li
Longxiang Li is a postdoctoral researcher in the Department of Environmental Health at the Harvard T.H. Chan School of Public Health in Boston, MA.
Petros Koutrakis
Petros Koutrakis is a professor in the Department of Environmental Health at the Harvard T.H. Chan School of Public Health in Boston, MA.
References
- Blomberg, A.J., M.M. Nyhan, M.A. Bind, P. Vokonas, B.A. Coull, J. Schwartz, and P. Koutrakis. 2020. The role of ambient particle radioactivity in inflammation and endothelial function in an elderly cohort. Epidemiology 31:499. doi:10.1097/EDE.0000000000001197.
- Burghele, B., and C. Cosma. 2013. Intercomparison between radon passive and active measurements and 3 problems related to thoron measurements. Rom. J. Phys. 58:S56–S61.
- Cardellini, F., E. Chiaberto, L. Garlati, D. Giuffrida, F. Leonardi, M. Magnoni, G. Minchillo, A. Prandstatter, E. Serena, R. Trevisi, et al. 2016. Main results of the international intercomparison of passive radon detectors under field conditions in Marie Curie’s tunnel in Lurisia (Italy). Nukleonika 61 (3):251–56. doi:10.1515/nuka-2016-0042.
- Carmona, M.A., and K.J. Kearfott. 2019. Intercomparison of commercially available active radon measurement devices in a discovered radon chamber. Health Phys. 116 (6):852–61. doi:10.1097/HP.0000000000001047.
- Chung, L.K., N.P. Piersma, and K.J. Kearfott. 2021. Radon kinetics in a basement space measured with different devices. Health Phys. 120 (5):582–88. doi:10.1097/HP.0000000000001402.
- Copes, R.S., and J. Scott. 2007. Radon exposure: Can we make a difference? Can Med Assoc J 177 (10):1229–31. doi:10.1503/cmaj.070559.
- Gunning, G.A., M. Murray, S.C. Long, M.J. Foley, and E.C. Finch. 2016. Inter-comparison of radon detectors for one to four week measurement periods. J. Radiol. Prot. 36 (1):104–16. doi:10.1088/0952-4746/36/1/104.
- Janik, M., S. Tokonami, T. Kovács, N. Kávási, C. Kranrod, A. Sorimachi, H. Takahashi, N. Miyahara, and T. Ishikawa. 2010. International intercomparisons of integrating radon/thoron detectors with the NIRS radon/thoron chambers. Radiat Prot Dosim. 141:436–39. doi:10.1093/rpd/ncq230.
- Kanse, S.D., B.K. Sahoo, B.K. Sapra, J.J. Gaware, and Y.S. Mayya. 2013. Powder sandwich technique: A novel method for determining the thoron emanation potential of powders bearing high 224Ra content. Radiat Meas 48:82–87. doi:10.1016/j.radmeas.2012.10.014.
- Kearfott, K.J. 1989. Preliminary experiences with 222Rn Gas in Arizona Homes. Health Phys. 56 (2):169–79. doi:10.1097/00004032-198902000-00004.
- Keith, S., J.R. Doyle, C. Harper, M. Mumtaz, O. Tarrago, D.W. Wohlers, G.L. Diamond, M. Citra, and L.E. Barber. 2012. Analytical methods. In Toxicological profile for radon, 147–58. Atlanta, GA: Agency for Toxic Substances & Disease Registry.
- Li, L., R.A. Stern, A.J. Blomberg, C.-M. Kang, Y. Wei, M. Liu, A.A. Peralta, J. Lawrence, C.L.Z. Vieira, P. Koutrakis, et al. 2022. Ratios between radon concentrations in upstairs and basements: A study in the Northeastern and Midwestern United States. Environmental Science & Technology. 9 (2):191–97. doi:10.1021/acs.estlett.1c00989.
- Lubin, J.H., M.S. Linet, J.D. Boice, E.E. Hatch, R.A. Kleinerman, R.E. Tarone, S. Wacholder, J. Buckley, S.M. Conrath, L.L. Robison, et al. 1998. Case-control study of childhood acute lymphoblastic leukemia and residential radon exposure. JNCI 90 (4):294–300. doi:10.1093/jnci/90.4.294.
- National Council on Radiation Protection and Measurements. 1987. Ionizing radiation exposure of the population of the United States. Washington, D.C.: National Academies Press.
- National Council on Radiation Protection and Measurements (NCRP). Health Effects of Exposure to Radon: BEIR VI. Preprint at (1999).
- Nazaroff, W.W. 1992. Radon transport from soil to air. Rev. Geophys. 30:137–60. doi:10.1029/92RG00055.
- Nel, A. 2005. Air pollution-related illness: Effects of particles. Sci. (1979) 308 (5723):804–06. doi:10.1126/science.1108752.
- Nyhan, M.M., M. Rice, A. Blomberg, B.A. Coull, E. Garshick, P. Vokonas, J. Schwartz, D.R. Gold, and P. Koutrakis. 2019. Associations between ambient particle radioactivity and lung function. Environ. Int. 130:104795. doi:10.1016/j.envint.2019.04.066.
- Nyhan, M.M., B.A. Coull, A.J. Blomberg, C.L.Z. Vieira, E. Garshick, A. Aba, P. Vokonas, D.R. Gold, J. Schwartz, P. Koutrakis, et al. 2018. Associations between ambient particle radioactivity and blood pressure: The NAS (Normative Aging Study). J. Am. Heart. Assoc. 7 (6):e008245. doi:10.1161/JAHA.117.008245.
- Papatheodorou, S., W. Yao, C.L. Vieira, L. Li, B.J. Wylie, J. Schwartz, and P. Koutrakis. 2021. Residential radon exposure and hypertensive disorders of pregnancy in Massachusetts, USA: A cohort study. Environ Int. 146:106285. doi:10.1016/j.envint.2020.106285.
- Papp, B., C. Cosma, and A. Cucos. 2016. International intercomparison exercise of active radon devices and passive detectors at the First East European Radon Symposium (FERAS 2012). Rom. Rep. Phys. 68:1–10.
- Porstendörfer, J. 1994. Properties and behaviour of radon and thoron and their decay products in the air. J. Aerosol. Sci. 25 (2):219–63. doi:10.1016/0021-8502(94)90077-9.
- Porstendorfer, J., and A. Reineking. 1999. Radon: Characteristics in air and dose conversion factors. Health Phys. 76 (3):300–05. doi:10.1097/00004032-199903000-00011.
- Raaschou-Nielsen, O., C.E. Andersen, H.P. Andersen, P. Gravesen, M. Lind, J. Schüz, and K. Ulbak. 2008. Domestic radon and childhood cancer in Denmark. Epidemiol. 19:536–43. Preprint at doi:10.1097/EDE.0b013e318176bfcd.
- Steck, D.J., J.A. Capistrant, J.P. Dumm, and E.S. Patton. 2004. Indoor radon exposure uncertainties caused by temporal variation. IRPA11.
- Taylor, D.D., and C. Gercel-Taylor. 2013. The origin, function, and diagnostic potential of RNA within extracellular vesicles present in human biological fluids. Front Genet 4:142. doi:10.3389/fgene.2013.00142.
- Thomashow, M.A., D. Shimbo, M.A. Parikh, E.A. Hoffman, J. Vogel-Claussen, K. Hueper, J. Fu, C.Y. Liu, D.A. Bluemke, C.E. Ventetuolo, and M.F. Doyle. 2013. Endothelial microparticles in mild chronic obstructive pulmonary disease and emphysema: The multi-ethnic study of atherosclerosis chronic obstructive pulmonary disease study. Am. J. Respir. Crit. Care Med. 188:60–68. doi:10.1164/rccm.201209-1697OC.
- U.S. Environmental Protection Agency. EPA assessment of risks from radon in homes. EPA 402-R-03-003 Preprint at (2003).
- U.S. Environmental Protection Agency. EPA Joins Global Call-to-Action on Radon Cancer Dangers 09/21/2009. Preprint at (2009).
- VoPham, T., N. DuPré, R.M. Tamimi, P. James, K.A. Bertrand, V. Vieira, F. Laden, and J.E. Hart. 2017. Environmental radon exposure and breast cancer risk in the Nurses’ health study II. Environ. Health 16:97. doi:10.1186/s12940-017-0305-6.
- White, S.B., J. Bergsten, B. Alexander, N. Rodman, and J. Phillips. 1992. Indoor 222Rn concentrations in a probability sample of 43,000 houses across 30 states. Health Phys. 62 (1):41–50. doi:10.1097/00004032-199201000-00005.