
 ?Mathematical formulae have been encoded as MathML and are displayed in this HTML version using MathJax in order to improve their display. Uncheck the box to turn MathJax off. This feature requires Javascript. Click on a formula to zoom.
ABSTRACT
Fugitive dust emissions play an important role in urban air quality. Much research on fugitive dust’s effects has focused on human health and societal impacts, with limited work investigating effects on other species. The endangered Apodemia mormo langei butterfly is endemic to the Antioch Dunes, a small area on the south bank of the San Joaquin River in northern California, largely protected as a National Wildlife Refuge. Between the two protected portions of the dunes is a gypsum processing facility. Deposition of gypsum dust may adversely affect endangered insects, especially in their vulnerable larval life stage. Persistent westerly winds blow from the western section of the refuge, across the industrial facility, to the eastern protected dune area. Ambient particulate matter (PM) was collected at 30 sites in both sections of the refuge using passive samplers deployed at times matching the butterfly life cycle. The prevailing wind maintained upwind-downwind sampling orientation throughout the study. PM samples were analyzed for total mass, and elemental composition via X-ray fluorescence. Downwind concentrations of gypsum-related elements were between 4 (strontium) and 12 (sulfur) times higher than upwind loadings, suggesting deposition of PM from the gypsum facility. The effect of fugitive emissions was strongest at the industrial facility’s fenceline, closest to a conveyor belt that loads gypsum. Combined with documented reductions in insect larval longevity when exposed to gypsum dust, the results suggest that gypsum deposition may be affecting the ecosystem and endangered species in the downwind unit of the Antioch Dunes National Wildlife Refuge.
Implications: Fugitive dust has impacts not only on humans, but on other organisms. The Antioch Dunes National Wildlife Refuge (ADNWR) in California, set aside to protect the endangered Apodemia mormo langei butterfly, consists of two land units separated by a gypsum processing facility in between them. In this study, we demonstrate fugitive gypsum dust deposition on the downwind unit of the ADNWR, which may impact the endangered butterfly and its ecosystem.
Introduction
Background
Fugitive dust (FD) is geological material that has been introduced into the atmosphere either by wind action or human activities (Liu and Liptak Citation2019); thus, has long been considered a driving force of decreased air quality, including considerations of its harmful impact on human health (Smith and Lee Citation2003). Urban and industrial areas are of interest when documenting FD’s effects, as anthropogenic activities including vehicular traffic, commercial processes, land disturbance, and industrial emissions contribute to FD levels (Gill Citation1996; Janhäll Citation2015; Stefanov et al. Citation2003). The spatial dispersion and deposition of FD is affected by many factors including source types, wind vectors, particle size, and topography. Removal of airborne particulate matter (PM) via impaction or adsorption on surfaces is correlated with available surface areas, e.g., vegetation and high surface area/volume structures provide sinks for PM (Bondietti, Hoffman, and Larsen Citation1984; Di Nicola, Brattich, and Di Sabatino Citation2022; Landis, Renshaw, and Kaste Citation2014).
Mitigation measures may incorporate process modification, preventative measures, and/or capture and removal equipment (Liu and Liptak Citation2019). Vegetation, particularly urban forests, can be an effective way to filter out FD and PM from the atmosphere (Mori et al. Citation2015; Terzaghi et al. Citation2013; Tiwari and Kumar Citation2022). This feature is often leveraged to incorporate various plant species in urban planning designs in attempts to mitigate and control air pollution, particularly from FD (Chaudhary and Rathore Citation2019; Patel, Chaurasia, and Rao Citation2023). As a result, myriad studies have demonstrated the variable effectiveness of different vegetation types in filtering out PM pollution from the ambient air, with a focus on the beneficial decrease in human health hazards (e.g., He et al. Citation2022; Tallis et al. Citation2011; Terzaghi et al. Citation2013; Tiwari and Kumar Citation2022; Weber, Kowarik, and Säumel Citation2014).
Beyond the widely studied effects FD has on human health (e.g., Smith and Lee Citation2003), the deposition on soil and vegetation can significantly impact vulnerable plant and animal species (Farmer Citation1993; Lukowski et al. Citation2018; McNally Citation2014). Mid- to high-Z elements and other airborne PM species are both absorbed and adsorbed by plants through foliar uptake and subsequently transported to other parts of the plant through their vascular systems (Shahid et al. Citation2017). The presence of specific metals (e.g., Ni, Cu, Zn, As, Cd, Sb, Pb) in plants and their roots has been linked to soil contamination and severe toxicity for living organisms (Shahid et al. Citation2017). Plants in FD receptor areas can also be negatively affected by enhanced nutrient levels in the soil resulting from dust deposition (McTainsh and Strong Citation2007). Despite the typical benefits of these nutrients, soil enrichment of nutrient-poor environments facilitates a newly nutrient-rich environment in which invasive plants can flourish and outcompete native species (McNally Citation2014).
Apart from the direct impact on vegetation, significantly fewer studies attempt to address the consequential effects of dust deposition on the species that feed on these plants. Dust deposition has been shown to have an adverse effect on leaf-browsing animals, from mammals (Belmaker Citation2018; Ungar et al. Citation1995) and amphibians (Zocche et al. Citation2014) to insects (Vanderstock et al. Citation2019). Of the research that has been conducted on the effect of dust on insects, the findings indicate a strong negative influence of FD and PM on local insects’ ability to survive and/or thrive (Lukowski et al. Citation2018; Osborne and Longcore Citation2021; Vanderstock et al. Citation2019). These effects become of particular concern when looking at vulnerable species at high risk for extinction, such as the Apodemia mormo langei (Lange’s Metalmark) butterfly in the Antioch Dunes National Wildlife Refuge (ADNWR), California, USA.
Geographical setting
The Antioch Dunes are an ~80 ha coastal and riverine perched, fine-sand dune system in northern California, USA, on the south bank of the San Joaquin River, at the downstream end of the Sacramento-San Joaquin River Delta near where it enters Suisun Bay (). It is the remnant of an isolated ~2700 ha eolian sand dune field thought to have formed in the Late Pleistocene under more favorable dune-forming conditions than presently occur (Arnold, Atwater, and Powell Citation1983). During the most recent glacial period when sea level was much lower, persistent and directionally-consistent onshore (west to southwest) winds, which continue today, likely mobilized nearshore sediment from a then-dry coastal plain (now generally the greater San Francisco Bay system) and carried it onshore to build the Antioch dune field and a surrounding sand sheet (Atwater Citation1982; Cooper Citation1967). The predominant wind pattern of coastal northern California blows from the San Francisco Bay system and enters the California Central Valley through gaps in the Coast Ranges, especially the Sacramento-San Joaquin River Delta (Zaremba and Carroll Citation1999). In historic times, the preexisting dune system has been greatly modified by anthropogenic activities including sand mining, vegetation removal, and industrial development.
Figure 1. Antioch Dunes National Wildlife refuge (green) and a gypsum processing facility (orange) along the San Joaquin River near the Sacramento-San Joaquin River Delta, California.
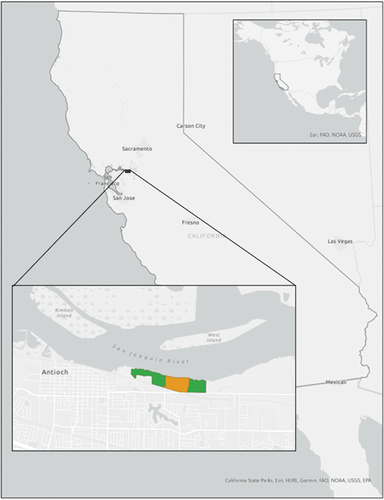
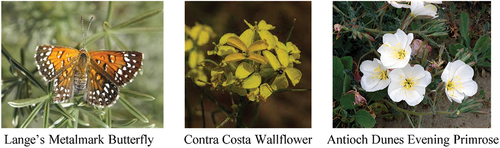
The ADNWR was established in 1980 for the protection of the federally endangered Lange’s Metalmark (Apodemia mormo langei) butterfly and the federally listed Contra Costa Wallflower (Erysimum capitatum ssp. angustatum) and Antioch Dunes Evening Primrose (Oenothera deltoides ssp. howellii) (USFWS, Citation2002) (). The refuge is divided into two separate units – the 16.6 hectare Stamm unit to the west and the 5.7 hectare Sardis unit to the east, both of which are surrounded by a mix of commercial, residential, and heavy industrial land uses. Located between the two units is an industrial gypsum processing facility (gypsum plant). In 2002, the U.S. Fish and Wildlife Service identified gypsum being released from this facility as a potential threat to the ecosystem health of the ADNWR due to gypsum’s ability to act as a fertilizer and soil amendment, consequentially causing nutrient enrichment effects. This leads to invasive species outcompeting the native Antioch Dunes Buckwheat (Eriogonum nudum var. psychicola), the primary source of food for Apodemia mormo langei. Fugitive gypsum dust may also pose a direct risk to the endangered butterfly through direct abrasion and consumption by larvae (Osborne and Longcore Citation2021; Richmond, Kelly, and Longcore Citation2015).
Figure 2. Endangered species protected at the Antioch Dunes National Wildlife refuge. Images publicly available from the U.S. Fish and Wildlife Service (https://www.fws.gov/species/).
Motivation
By quantifying deposition of gypsum dust and relating that data to other external factors, such as wind, precipitation, and other nearby anthropogenic air pollution sources, we can better understand the influence and impact of the gypsum plant on the environmental and biological health of the ADNWR and the endangered species that live within it.
Air monitoring at the ADNWR, reported here, was performed in conjunction with a biological investigation of gypsum toxicity to Apodemia mormo langei (Osborne and Longcore Citation2021). The overarching goal of the air monitoring portion of the study was to quantify potential fugitive gypsum dust emissions onto the ADNWR. The study design leveraged the unique configuration of the wildlife refuge consisting of separate east and west units on either side of the gypsum plant, as well as the predominant westerly wind regime, establishing an upwind/downwind experiment.
The specific project aims were to: 1) investigate whether a passive FD sampling and elemental analysis method, with its ability to provide spatial coverage for multiple elements, can quantify elements of interest in a mixed urban/industrial/natural area, 2) attempt an upwind/downwind experiment at the two ADNWR units on either side of an established gypsum plant, and 3) quantify excess gypsum deposition at the downwind ADNWR unit with respect to the upwind unit and differentiate its signature from background levels using an X-ray spectrometric elemental analysis technique.
Methods
Sample collection
The air monitoring campaign employed a combination of conventional and non-conventional methods to meet the unique scenario of this study. To fulfill the primary aim, priority was placed on sampling at multiple locations in each unit for extended periods of time keyed to the Apodemia mormo langei life cycle. Due to the sensitive nature of the wildlife refuge and lack of electrical power to operate active samplers, a low-impact, passive sampling approach was selected. The importance of geospatial context in this study encouraged triplicate sampling at each location so that 1) collocated precision could be estimated, 2) outlier sample results could be detected, and 3) backup samples would be available in the event of sample loss or contamination.
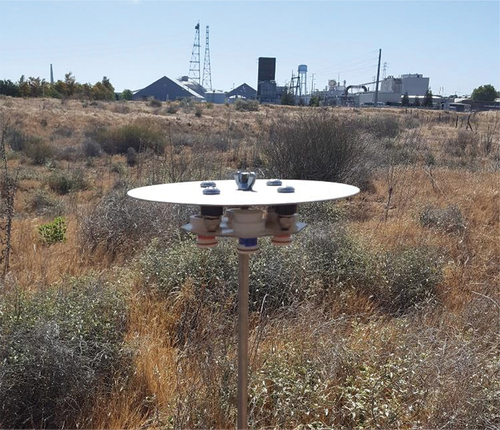
PM was collected using passive samplers modeled after the device described by Wagner and Leith (Citation2001a, Citation2001b) (). Specifically, IMPROVE (Interagency Monitoring for PROtected Visual Environments) sampler cartridges with fixed screens were modified to enable free airflow over three of the four filter positions (Solomon et al. Citation2014). These act as settling plates with no active flow control. The fourth position was unmodified to contain a field blank filter. The polytetrafluoroethylene (PTFE) filter samples (Pall, Inc., Teflo 3 µm pore size, 47 mm diameter, USA) are shielded from rain and falling debris by an aluminum plate, 200 mm diameter x 1.3 mm thick. Samplers were placed on top of stainless steel poles approximately 1.5 m above ground level. Sampler heights were recorded for each site. For each deployment, samples were kept in clean polyethylene bags before and after exposure to prevent contamination.
Figure 3. The passive sampler deployed on the Sardis unit with the gypsum facility in the background. The image is facing west-southwest. The gypsum plant is approximately 400 m from this sampler.
Sample collection was performed from March 26th through September 27th, 2021 in three deployments of two months each designed around the life cycle periods of Apodemia mormo langei; specifically, the larval feeding stage (March-May), larval feeding and the pupa transition stage (May-July), and the pupation and the reproductive/flight stage (July-September) (). During each deployment, the time/date was recorded and photographs were taken at each location.
Table 1. Summary of sample collection deployments.
Sampling locations
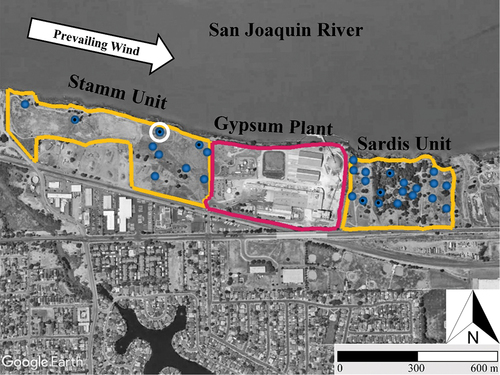
Thirty locations were systematically distributed across both ADNWR parcels to provide coverage at distance intervals extending between 9 to 725 meters upwind from and 12 to 375 meters downwind from property boundaries with the gypsum plant. Eleven locations were selected across the Stamm Unit while the other nineteen were selected across the Sardis Unit. More locations were selected for the Sardis Unit because its terrain, elevation gradients and land cover are more diverse than the Stamm Unit, which is largely dominated by dunes, smaller shrubs and grasses, and few trees. The Sardis Unit contains two north-south trending dune ridges on the eastern and western edges, with a depressed, thickly vegetated (live oak trees: Quercus agrifolia, with an understory consisting of native species like the Antioch Dunes buckwheat, Eriogonum nudum var. psychicola; coyote bush, Baccharis pilularis; and invasive grasses like brome, Bromus sp.) area in between. Six locations were selected on the western ridge and five on the eastern ridge. When possible, locations were selected near or within clusters of Eriogonum nudum var. psychicola, the primary food source of Apodemia mormo langei, while covering the sampling area. Sites were preferentially placed in open areas, and air path obstructions were avoided as much as possible, following U.S. Environmental Protection Agency (EPA) guidelines of a thirty-degree clearance angle. The locations of the sampling sites are shown in and given in Table S1 in the supplemental information (SI).
Figure 4. Sampling sites and locations of interest in the Antioch Dunes area. The predominant wind direction is shown along the waterway. The two wildlife refuge parcels are outlined in yellow. The gypsum plant between the two parcels is outlined in red. Site locations are indicated by blue circles. Stolen samplers have a black dot. The site location indicated with a white circle on the Stamm unit is two nearby sampler locations at different elevations.
Laboratory analytical methods
Laboratory analyses were performed at the UC Davis Air Quality Research Center (AQRC) network operations laboratory, employing IMPROVE and Chemical Speciation Network (CSN) methods. The applicable details of the methods utilized are described below. Further information can be found in the Standard Operating Procedures (EPA, Citation2017).
Upon receipt by laboratory personnel, samples were inspected for damage and/or contamination. Samples were removed from the sampling cartridges and placed in clean, labeled, Petri slides (MilliporeSigma PetriSlide, USA). Samples were then transferred to an environmentally-controlled (21.5 ± 1°C temperature, 39 ± 2% relative humidity) automated weighing chamber. After sample conditioning (>4 hours) and gravimetric analysis, samples were elementally speciated via energy-dispersive X-ray fluorescence (XRF) spectrometry.
Gravimetric mass measurements
Gravimetric mass is measured on PTFE filters both before and after sample collection using an environmentally-controlled automated weighing chamber (MTL, AH500E, USA weighing chamber with a Mettler Toledo, XPR6UD5, 0.5 g sensitive, USA microbalance). The difference between the pre- and post-sampling mass measurements (“preweight” and “postweight,” respectively) estimates the total mass of the sample collected on the filter, in micrograms (
g). Mathematically,
The uncertainty is estimated as one standard deviation of the triplicate samples collected at each sampling site for each sampling period. The method detection limits use the analytical detection limits of the AQRC laboratory, determined from the analysis of approximately 50 to 100 laboratory blanks on each analyzer and calculated as the 95th percentile mass loading minus the median mass loading.
Energy-dispersive X-Ray fluorescence analyses
Elemental concentrations from PTFE filters were quantified using X-ray fluorescence spectrometry (XRF) systems (Epsilon 5, PANalytical B.V., Almelo, The Netherlands) operating under vacuum. As XRF is a nondestructive technique, a subset of samples was reanalyzed to determine replicate precision. However, exposure to the vacuum may result in the loss of volatile elements, specifically chlorine and bromine.
Following the CSN method for urban PM samples, seven different analytical conditions were used during each analysis to balance sensitivity and exposure time for 33 target elements. Each analytical condition is designed to optimize detection for a subset of the 33 elements and uses a different secondary target, X-ray tube voltage and current, energy detection range and resolution setting, and exposure time (see Table S2 in the SI).
The AQRC XRF laboratory employs a series of checks to ensure data quality. These can be found on the AQRC website, https://airquality.ucdavis.edu/improve-documentation. Consistent with the mass parameter, uncertainty was estimated as one standard deviation of the triplicate samples at each sampling site for each sampling period. The method detection limits use the analytical detection limits of the AQRC laboratory, determined from the analysis of approximately 50 to 100 lab blanks on each analyzer and calculated as the 95th percentile elemental loading minus the median elemental loading.
Meteorological data
Local measurements of wind speed and direction were acquired from the North American Land Data Assimilation System (NLDAS-2, https://disc.gsfc.nasa.gov/datasets/NLDAS_FORA0125_H_002/summary). These hourly data are in 1/8th degree spacing and range from January 1979 to the present (Xia et al. Citation2012). This data was compared with the nearest National Oceanic and Atmospheric Administration (NOAA) monitor (Pittsburg/Suisun Bay, 8 km WNW). The wind speeds and direction were generally within 10% between the two data sources, providing further confidence in the study design. These values are included in Table S3 of the SI for reference.
Maps were generated using the ggmap package (Kahle and Wickham Citation2013) in R (R Core Team Citation2022) to visualize the geospatial relationships of measurement results for each measured parameter.
Results and discussion
The six-month sampling and analysis campaign resulted in 219 sample filters successfully collected. Eight samplers out of the original thirty were stolen over the course of the campaign (denoted with a black dot on ). Four of the stolen samplers were in the upwind Stamm parcel along the river and four were in the downwind Sardis parcel, located near the middle distance from the gypsum plant boundary and not at either fence line boundary. While unfortunate, the stolen samplers did not reduce the integrity of the spatial transect. All samples were inspected for contamination or damage. Small amounts of tearing and/or insect contamination were found on some sample filters. All damaged or contaminated samples were invalidated and removed from further analysis. The remaining retrieved samples were characterized for mass and elemental loading according to the network protocols as described in Methods.
Meteorological conditions
The unique configuration of the ADNWR was well suited for an upwind/downwind experiment. The prevailing local wind regime (a sea breeze flowing generally from the Golden Gate to the Central Valley) follows the course of the river from west to east (Zaremba and Carroll Citation1999). The orientation of the ADNWR parcels and gypsum plant is approximately 280 degrees from eastern edge to western edge. The median wind direction was 260 33 degrees throughout the monitoring campaign (; ) and wind speed was typically 5 m/s ().
Figure 5. Wind roses for each sampling period. The direction of the paddles is the direction of wind origin. The distance of the paddle from the plot center for each plot represents the frequency of observations at that direction, in percent. The fill colors show the observed wind speed for each fraction of each paddle. The sum of all paddles in each plot equals 100%.
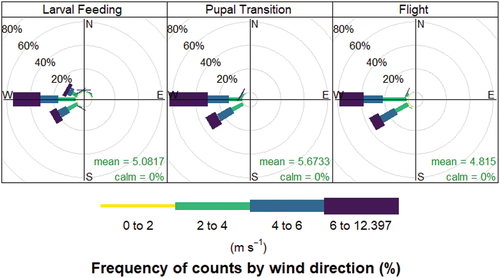
Table 2. Summary of wind speed and direction during each sampling period.
The consistency of relatively steady westerly winds provides confidence in assigning the western Stamm parcel as “upwind” and the eastern Sardis parcel as “downwind” of the gypsum plant. This nomenclature is used for the remainder of the discussion.
Measured elemental concentrations
Analytical precision for XRF was estimated by replicate analysis of ten samples. The scaled relative difference was calculated for each pair of measurements; mathematically,
where represents the measured parameter. The
term is derived from the propagated uncertainty of the difference from two measurements. For each parameter, the estimated analytical precision is the average of these differences,
().
Figure 6. Replicate precision results from reanalysis of ten collected samples. The horizontal dashed line shows the 20% limit used in laboratory QC screening protocols.
Network operations quality control requires replicate precision to be within 20% for samples with original areal densities greater than four times the uncertainty level. Employing this metric, 22 elements were considered detectable: Na, Mg, Al, Si, P, S, Cl, K, Ca, Ti, Cr, Mn, Fe, Ni, Cu, Zn, Sr, Sn, Sb, Cs, Ba, Pb. Elements that did not meet the 20% precision requirement (V, Co, As, Se, Br, Rb, Zr, Ag, Cd, In, and Ce) were not included in the data analysis. The detection rates, average mass loadings (micrograms), and average abundance levels (parts per million, PPM) observed for each of the selected parameters are summarized in below.
Table 3. Summary of measured parameters and detection levels. The Sardis and Stamm columns indicate the mean and one standard deviation of the abundance (ppm) for each parcel.
Most elements were detected in > 70% of the samples. P, Sn, and Sb were detected ~ 50–70% of the time while Cs was only detected in 23% of the samples. All detections are considered valid; however, this analysis was primarily concerned with consistent observations. Therefore, data interpretation was confined to elements detected in > 70% of the samples.
Another metric of interest was the collocated precision of measurements at each site. Each sampler was deployed with three sample filters. The orientation of the three filters was not controlled with respect to the predominant wind direction. Therefore, one filter may have received significantly more FD loading than the other two collocated filters. presents the ratio of measured loadings divided by the lowest loading for each sampling site and sampling period. The abscissa (x-axis) indicates the three different cartridge sample positions ordered from the lowest measured loading (position 1) to the highest measured loading (position 3). All ratios at the first position are unity while the ratios observed at positions 2 and 3 are right skewed distributions. This indicates that the ratios are typically low with outliers presenting a large difference between collocated filter positions.
Figure 7. The variability of collocated sample sets is shown using violin distributions. The ordinal plane represents the measured values divided by the lowest value observed for each parameter and sample set. The violin shape is the vertically oriented frequency distribution observed for each of these ratios. The ordering of the abscissa is from the lowest to highest measured loading for each sample set; hence, the first position consists entirely of measured/Minimum=1. The horizontal dotted line indicates a ratio of 1, indicating no measurable difference, while the horizontal dashes line indicates a ratio of 2, for reference.
Most observations were within a factor of 2; however, isolated sets extended to a factor above 15. This indicates a directionality component to the sample collection methodology and may be related to localized wind speeds (and deposition velocities) experienced by the individual samplers. The sampling locations with the greatest intra-site differences appear to be those most exposed to free wind paths as opposed to sampling sites with nearby trees or topographical obstructions.
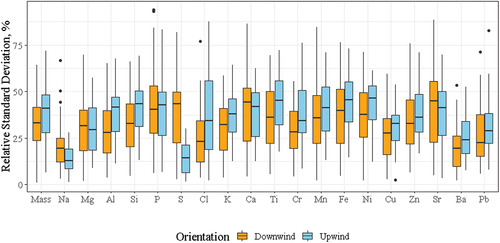
An alternative view of this information is shown using boxplots of the relative standard deviations (RSD) for each parameter. In , RSDs for each set of three sample filters per site are shown distributed by the ADNWR parcel orientation, i.e., upwind or downwind of the gypsum plant. Most parameters display similar boxplot profiles centered around the average RSD of 33.4% except for sulfur. Sulfur presents two different levels of variability that are spatially dependent. The lower RSD of sulfur on the upwind parcel is similar to those of sodium and chlorine indicating a non-directional source, i.e., a well-mixed source such as marine and/or sulfate aerosol. The higher RSD of sulfur on the downwind parcel, however, indicates a local, directional source. Maps of RSDs for all parameters are provided in the SI.
Figure 8. The variability of collocated sample sets by parameter using boxplots. Most parameters lie within the 20–50% range except for Na, Cl, Cu, and Ba. Sulfur shows a different profile between the upwind and downwind monitoring locations while other elements are much more similar.
The intra-site precision showed a measurable level of variability between collocated samples, indicating a directionality component. Geospatial analysis of the sites with the greatest variability supported this hypothesis. In Wagner and Leith (Citation2001b)’s wind tunnel evaluation of their passive samplers, traverse plane variability was investigated between sampler units; however, the placement of the support pegs and how that may affect sample deposition within the sampler itself was not directly addressed. Deposition on these support posts have been observed on both the Wagner and Leith (Citation2001a, Citation2001b) samplers as well as the passive samplers used in this study. To understand the impact that this directionality may have had on the results, the upwind/downwind comparisons were conducted using all measurement values, the maximum site values, and the average site values. The findings were essentially identical; therefore, the following discussion will be restricted to measurement averages for each site and sampling period for brevity.
Maps visualize the variation in concentration of elements across the project site (). Two elements associated with natural background aerosols (sodium and potassium) are contrasted with the two primary constituents of gypsum [], i.e., calcium and sulfur. Sodium, potassium and chlorine are always elevated in coastal airsheds including ADNWR due to sea salt aerosols; however, there are additional sources of chlorine in urban/industrial areas such as cleaning products and raw materials in manufacturing. Potassium is also present in the mineral fraction of soil predominantly as certain feldspars and micas, occurring at higher abundance when the soil has been amended for agriculture. Potassium is also used as a tracer for biomass burning and fireworks.
Figure 9. Spatial distribution of median loadings from four selected elements. The median values were taken from the entire study period. The top two maps, sodium and potassium, were selected to represent natural background elements in aerosols. Sodium is predominantly related to sea salt while potassium comes primarily from minerals and wood smoke. The bottom two maps, calcium and sulfur, show a pronounced difference between upwind and downwind locations. These elements are related to gypsum.
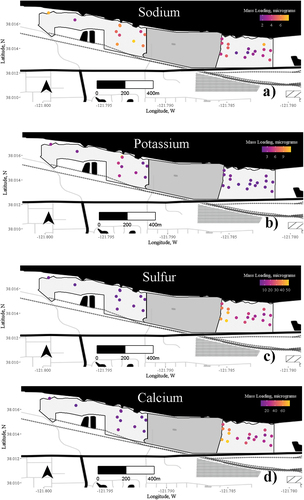
The sodium map shows consistent loadings at most locations on the Stamm (western) unit and the open ridge locations of the Sardis (eastern) unit. The central portion of the Sardis unit has extensive vegetative cover and is depressed with respect to the land surrounding it. This depression is due to excavation activities at the location before its designation as a wildlife refuge. This geospatial profile can be interpreted as showing the sea salt aerosols that are transported across the area along the path of the San Joaquin River and then settle on all free path sampler locations. The lower loadings on the central Sardis unit suggest a dilution effect from dry deposition of sea salt aerosols on the (higher) vegetative canopy as well as on the passive samplers.
The potassium map shows more consistency within each ADNWR unit and higher loadings observed at the Stamm unit than the Sardis unit. This profile was also observed for Mg, Al, Si, Ti, Cr, Fe, Ni, and Ba. This chemical profile is interpreted as mainly soil dust from wind erosion of the more exposed sediments at the Stamm unit with some elements (e.g., Mg) also augmented by sea salt. The highest loadings were observed at sampling sites 19 and 21, observable by the orange/red dots near the middle of the Stamm unit. The consistently higher dust loading on these samples may be due to specific exposure profiles of these samplers with respect to dune topography, micro-meteorology, and sites of active wind entrainment.
Both the calcium and sulfur maps show a clear distinction between upwind locations and downwind locations, especially the sampling sites located on the fenceline area between the gypsum plant and the downwind unit. This profile was also observed for strontium (a trace constituent of calcium minerals including gypsum) but not in any of the other elements detected in this study. This clearly indicates fugitive gypsum dust was transported to the downwind unit of ADNWR from the gypsum plant.
Speciation comparisons
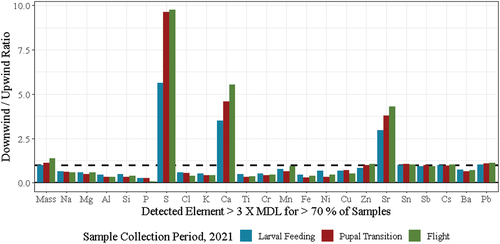
A simple ratio of downwind to upwind mass for the selected elements shows variation between the units in the composition of dust (). A horizontal line locates a ratio of unity, which would indicate the same loadings observed on both ADNWR units. Mass, zinc, lead, and the June-July Mn results are closest to a ratio of 1. Most other elements present ratios around 0.3–0.4, indicating the upwind unit has 2 to 3 times as much loading as the downwind unit for these elements. Since the upwind unit consists of exposed dunes while the downwind unit is heavily vegetated, we can associate these elements to local eolian dust. The distinction between gypsum elements, i.e., S, Ca, and Sr, and the rest of the measured elements is very clearly shown by the downwind/upwind ratios >> 1. These elevated ratios are consistently higher across sampling periods, and highest during June-July. The ratios for mass, Mn, and Zn (both trace components of calcium minerals) are also highest during June-July (the butterfly’s pupal transition stage), the months with the highest average wind speed and thus likely more FD entrained and deposited downwind.
Figure 10. Ratios of downwind/upwind loadings by parameter shown with columns for each sampling period. The dashed line indicates a ratio of 1, indicating no difference. The downwind/upwind ratio is generally conserved across sampling periods. The three gypsum elements, S, Ca, and Sr are clearly distinct.
Individually, S, Ca, and Sr in aerosols each have multiple sources and may be attributed to both natural and anthropogenic origins. Particulate sulfur is most commonly associated with anthropogenic sulfur dioxide emissions, which are converted to ammonium sulfates through atmospheric processing (Seinfeld and Pandis Citation1998), as well as marine and volcanic aerosols. Calcium is most often apportioned to soil dust, primarily in the form of carbonate and silicate minerals (Eberl and Smith Citation2009). Strontium is a ubiquitous trace component of calcium minerals, as it substitutes for calcium in the crystal lattice. Strontium also occurs as celestite () (Playà and Rosell Citation2005; West Citation1973), which is often present in trace amounts in gypsum deposits (Playà and Rosell Citation2005). Another significant source of strontium is sea salt, of which it can be used as an elemental tracer (White Citation2008).
In the context of an upwind/downwind experiment on either side of an industrial source, all within a distance <2 km, little room exists for alternative interpretations of the data. The elevated concentrations of highly correlated () gypsum-related elements at the downwind ADNWR unit compared with the upwind unit are a result of emissions from the gypsum plant between the two locations.
To further quantify these observations, enrichment factors (EFs) were calculated. An EF is a double ratio of elements and chemical profiles that quantifies how enriched is to
, where
is a reference or background signature. In this analysis,
refers to upwind observations while
refers to downwind. For the elemental tracers, aluminum, silicon, and titanium were chosen to represent soil signatures. Using three elements instead of one for the reference elements can detect unexpected relationships and avoid biases. The EFs are calculated as:
where is the element of interest,
is the soil element (e.g., aluminum, silicon, or titanium),
is the mass loading of the element of interest, and
is the mass loading of the soil element. The numerator is the ratio of downwind elements while the denominator is the upwind elemental ratio. The average is taken for all three soil elements after the results have been reviewed for consistency ().
Figure 11. Enrichment of downwind elemental loadings with respect to upwind. The solid gray line indicates no enrichment. The dotted line is the lower limit of enrichment while the dashed line indicates significant enrichment. Aluminum, silicon, and titanium were selected as representative of soil elements. Enrichment factors are double ratios comparing both element to element and receptor to reference values. In this instance, observed elements are compared to soil elements, the receptor location is the downwind unit (Sardis), and the reference values are the average of the upwind unit (Stamm).
The EFs calculated for silicon and titanium were nearly identical while aluminum was approximately 10% higher, indicating that aluminum was more enriched at the downwind ADNWR unit than either silicon or titanium. This may be due to the use of an additional source of aluminum at or upwind of the Sardis site, such as at the gypsum plant. Again, sulfur, calcium, and strontium are significantly enriched at the downwind Sardis unit with regard to the upwind Stamm unit. The mean calculated enrichment factors with one standard deviation were 20.3 6.3, 12.1
3.6, and 9.5
2.7 for sulfur, calcium, and strontium, respectively. In plain language, gypsum is on average 14 times higher in the air downwind of the gypsum plant than upwind.
Conclusion and future research needs
The Antioch Dunes National Wildlife Refuge in California preserves much of a small relict dune field on the south bank of the San Joaquin River, protecting the endemic, endangered Apodemia mormo langei butterfly and several endangered, endemic plant species. The two separate portions of the refuge (Stamm on the west, Sardis to the east) are oriented parallel to the persistent, prevailing sea breeze which brings the marine air layer inland, and separated by a gypsum plant, consistently placing the Stamm unit upwind and Sardis unit downwind of the industrial facility. To assess the potential impacts of fugitive dust from the gypsum plant on the wildlife refuge, this study used passive aerosol sampling for six months keyed to the butterfly life cycle along an upwind-downwind transect on the ADNWR. Samples were analyzed by X-ray fluorescence to assess potential deposition of fugitive emissions on the dunes and butterfly habitat.
Downwind concentrations of gypsum-related elements (but not other elements) were between 4 (strontium) and 12 (sulfur) times higher than upwind loadings, geospatial analysis of the results showed a strong correlations between gypsum-related elements on the downwind Sardis parcel (sulfur to calcium r2 = 1.00 downwind vs. 0.54 upwind; sulfur to strontium r2 = 0.97 downwind vs. 0.23 upwind), and enrichment factor data suggested that ~ 14× more gypsum was detected downwind of the industrial plant. The effect of fugitive emissions was strongest at the industrial facility’s fenceline, closest a conveyor belt where gypsum is loaded. These data all suggest enhanced deposition of particulate matter from the gypsum facility to the downwind portion of the wildlife refuge. These emissions may potentially affect the dune ecosystem and the life cycle of Apodemia mormo langei. The results of this preliminary study, including the biological portion (Osborne and Longcore Citation2021), will help fill the gap in understanding the effects of FD on dune systems and non-human species outside of agricultural pest management.
To better understand the impact of emissions from the gypsum plant on the ADNWR environment, additional analyses on collected aerosols and soils would be beneficial. Performing X-ray diffraction and/or ion chromatography would establish the chemical forms of major elements and deposition of secondary minerals downwind (Hassanizade and Jafari Citation2021), and mass spectrometric isotope analyses might be able to distinguish relative contributions from gypsum and other natural and anthropogenic sources of sulfur/sulfate (Mandeville Citation2010). Leaching experiments on dune sands and/or dune cores could quantify transport of water-soluble fractions and depth of penetration of gypsiferous components into the shallow subaerial critical zone (Rea et al. Citation2020).
From the biological perspective, analysis of leaves, roots, and other tissues of plants within the ADNWR could be conducted to quantify species-specific variations in deposition, uptake, and physiological effects of dust, gypsum, and their components (Khalilimoghadam et al. Citation2021; Patel, Chaurasia, and Rao Citation2023; Rahul Citation2022). Similarly, documenting upwind-downwind variations in soil microbiota and soil invertebrates would provide valuable data on the effects of gypsum dust on soil ecology, as has been done for cement plant dust (da Costa Silva et al. Citation2022). Given the adverse effects of industrial PM deposition on invertebrates (Al-Alam et al. Citation2023) and vertebrates (Owonikoko, Emikpe, and Olaleye Citation2021), other animal species, such as pollinators and other Lepidoptera (and the vertebrate species that feed on them) in the Sardis unit could be investigated for potential physiological and toxicological effects of fugitive dust uptake. Such additional research would more comprehensively reveal impacts of FD deposition from the gypsum plant on the Antioch Dunes ecosystem and its protected species.
Disclaimer
The opinions, findings, conclusions, and recommendation are those of the authors and do not necessarily represent the views of the Federal Government, U.S. Fish and Wildlife Service, UWG, or the authors’ institutions.
Supplemental Information.docx
Download MS Word (5.4 MB)Disclosure statement
Sampling activities at the refuge were conducted under the special use permit #AD-FY2021-01.
Data availability statement
The data that support the findings of this study are available from the first author upon reasonable request.
Supplementary material
Supplemental data for this paper can be accessed online at https://doi.org/10.1080/10962247.2023.2254267
Additional information
Funding
Notes on contributors
Nicholas J. Spada
Nicholas J. Spada is a scientist in the Air Quality Research Center at the University of California at Davis. Dr. Spada conducts research on elemental profilings in mixed urban/industrial and remote environments. He also provides support on air monitoring strategies and technology to citizen scientists. He is a co-director of the Citizen Air Monitoring Network, based in the Bay Area of California.
Alison M. McNally
Alison M. McNally is an Associate Professor of Geography & Environmental Resources at California State University Stanislaus, Turlock, California. Her current research interests include impacts of land use on surface water quality and developing an interactive community equity index map for the northern San Joaquin Valley. Dr. McNally is a co-founder and co-director of the Center for Applied Spatial Analysis at CSU Stanislaus.
Thomas E. Gill
Thomas E. Gill is a Professor of Earth, Environmental and Resource Sciences and Environmental Science & Engineering at the University of Texas at El Paso. He conducts research on the sources, transport, composition, and human and environmental health effects of atmospheric dust and is co-founder of the Dust Alliance for North America (dustalliance.org).
Hanna Q. Best is an undergraduate student researcher in the Air Quality Research Center at the University of California at Davis. She performs field work, sample analysis, and data processing for the special projects team.
Hanna Q. Best
Hanna Q. Best is an undergraduate student researcher in the Air Quality Research Center at the University of California at Davis. She performs field work, sample analysis, and data processing for the special projects team.
Alexa M. Wells
Alexa M. Wells is an undergraduate student researcher in the Air Quality Research Center at the University of California at Davis. She performs field work, sample analysis, and data processing for the special projects team.
Travis Longcore
Travis Longcore is an Adjunct Professor in the Institute of the Environment and Sustainability and Co-Chair of the Environmental Science and Engineering (D.Env.) Program at the University of California, Los Angeles. He also serves as the Science Director of The Urban Wildlands Group.
References
- Al-Alam, J., M. Millet, M. Harb, E. Ajoury, S. Tokajuan, and M. Wazne. 2023. Field evaluation of metal bioaccumulation in the gastropod Helix aspersa at agricultural and industrial sites in lebanon. Environ. Monit. Assess. 195 (1):197. doi:10.1007/s10661-022-10791-5.
- Arnold, R., B.F. Atwater, and J. Powell. 1983. The Antioch Dunes. Washington, DC: Report to the U.S. Fish and Wildlife Service.
- Atwater, B.F. 1982. Geologic factors in the prehistoric establishment of organisms endemic to eolian dunes near Antioch, California. Memo To The U.S. Fish And Wildlife Service From The U.S. Geological Survey. Menlo Park, California. Accessed February 26, 2023. https://ecos.fws.gov/ServCat/DownloadFile/49368?Reference=48954.
- Belmaker, M. 2018. Dental microwear of small mammals as a high resolution paleohabitat proxy: Opportunities and challenges. J. Archaeo. Sci. Rep. 18:824–38. doi:10.1016/j.jasrep.2018.02.034.
- Bondietti, E.A., F.O. Hoffman, and I.L. Larsen. 1984. Air -to-vegetation transfer rates of natural submicron aerosols. J. Environ. Radioact. 1 (1):5–27. doi:10.1016/0265-931X(84)90009-2.
- Chaudhary, I.J., and D. Rathore. 2019. Dust pollution: Its removal and effect on foliage physiology of urban trees. Sustain. Cities Soc. 51:101696. doi:10.1016/j.scs.2019.101696.
- Cooper, W.S. 1967. Coastal dunes of California. Geol. Soc. Am. Mem. 104. doi:10.1130/MEM104.
- da Costa Silva, T.A., M.M. de Paula, W.S. Silva, and G.A. Lacorte. 2022. Can moderate heavy metal soil contaminations due to cement production influence the surrounding soil bacterial communities? Ecotoxicology 31 (1):134–48. doi:10.1007/s10646-021-02494-3.
- Di Nicola, F., E. Brattich, and S. Di Sabatino. 2022. A new approach for roughness representation within urban dispersion models. Atmos. Environ. 283:119181. doi:10.1016/j.atmosenv.2022.119181.
- Eberl, D.D., and D.B. Smith. 2009. Mineralogy of soils from two continental-scale transects across the U.S. and Canada and its relation to soil geochemistry and climate. Appl. Geochem. 24 (8):1394–404. doi:10.1016/j.apgeochem.2009.04.010.
- EPA (U.S. Environmental Protection Agency). 2017. Ambient Monitoring Technology Information Center (AMTIC). https://www.epa.gov/amtic.
- Farmer, A.M. 1993. The effects of dust on vegetation—a review. Environ. Pollut. 79 (1):63–75. doi:10.1016/0269-7491(93)90179-R.
- Gill, T.E. 1996. Eolian sediments generated by anthropogenic disturbance of playas: Human impacts on the geomorphic system and geomorphic impacts on the human system. Geomorphology 17 (1):207–28. doi:10.1016/0169-555X(95)00104-D.
- Hassanizade, S., and S. Jafari. 2021. Changes in physicochemical properties of old stabilized sand dunes due to atmospheric sediments and diversity of clay minerals in a dry area. Aeolian Res. 50:100674. doi:10.1016/j.aeolia.2021.100674.
- He, C., S. Li, Y. Zhang, and M. Wu. 2022. Role of roadside vegetation as a passive method for the reduction of urban water-insoluble fine particle and impacts brought by different planting patterns. Air Qual. Atmos. Health 15 (11):1923–40. doi:10.1007/s11869-022-01226-8.
- Janhäll, S. 2015. Review on urban vegetation and particle air pollution – deposition and dispersion. Atmos. Environ. 105:130–37. doi:10.1016/j.atmosenv.2015.01.052.
- Kahle, D., and H. Wickham. 2013. Ggmap: Spatial visualization with ggplot2. R J. 5 (1):144–61. http://journal.r-project.org/archive/2013-1/kahle-wickham.pdf.
- Khalilimoghadam, B., S.A. Siadat, A. Yusefi, and K. Negaresh. 2021. Atmospheric particle adsorption rates of plants in an industrial city of southwest Iran. Aeolian Res. 53:100752. doi:10.1016/j.aeolia.2021.100752.
- Landis, J.D., C.E. Renshaw, and J.M. Kaste. 2014. Quantitative retention of atmospherically deposited elements by native vegetation is traced by the fallout radionuclides 7Be and 210Pb. Environ. Sci. Technol. 48 (20):12022–30. doi:10.1021/es503351u.
- Liu, D.H.F., and B.G. Liptak. 2019. Air pollution. Boca Raton: CRC Press. doi:10.1201/9781315137056.
- Lukowski, A., R. Popek, R. Jagiello, E. Maderek, P. Karolewski, A. Lukowski, R. Jagiello, and E. Maderek. 2018. Particulate matter on two Prunus spp. decreases survival and performance of the folivorous beetle Gonioctena quinquepunctata. Environ. Sci. Pollut. R. 25 (17):16629–39. doi:10.1007/s11356-018-1842-4.
- Mandeville, C.W. 2010. Sulfur: A ubiquitous and useful tracer in Earth and planetary sciences. Elements 6 (2):75–80. doi:10.2113/gselements.6.2.75.
- McNally, A.M. (2014). Historical Geography of the Antioch Dunes, Antioch, California, with a Focus on Current Impacts to the Habitat and Population of the Federally Endangered Lange’s Metalmark Butterfly (Apodemia Mormo Langei). Ph.D. diss., Davis, California, USA: University of California, Davis.
- McTainsh, G., and C. Strong. 2007. The role of aeolian dust in ecosystems. Geomorphology 89 (1–2):39–54. doi:10.1016/j.geomorph.2006.07.028.
- Mori, J., H.M. Hanslin, G. Burchi, and A. Sæbø. 2015. Particulate matter and element accumulation on coniferous trees at different distances from a highway. Urban For. Urban Gree. 14 (1):170–77. doi:10.1016/j.ufug.2014.09.005.
- Osborne, K.H., and T. Longcore. 2021. Effect of gypsum dust on lepidopterous larvae. Ecotox. Environ. Safe. 228:113027. doi:10.1016/j.ecoenv.2021.113027.
- Owonikoko, M.W., B.O. Emikpe, and S.B. Olaleye. 2021. Standardized experimental model for cement dust exposure; tissue heavy metal bioaccumulation and pulmonary pathological changes in rats. Toxicol. Rep. 8:1169–78. doi:10.1016/j.toxrep.2021.06.001.
- Patel, K., M. Chaurasia, and K.S. Rao. 2023. Urban dust pollution tolerance indices of selected plant species for development of urban greenery in Delhi. Environ. Monit. Assess. 195 (1):16. doi:10.1007/s10661-022-10608-5.
- Playà, E., and L. Rosell. 2005. The celestite problem in gypsum Sr geochemistry: An evaluation of purifying methods of gypsiferous samples. Chem. Geol. 221 (1):102–16. doi:10.1016/j.chemgeo.2005.04.006.
- R Core Team. 2022. R: A language and environment for statistical computing. Vienna, Austria: R Foundation for Statistical Computing.
- Rahul, J. 2022. Stone crusher dust and its impact: Accumulation efficiency of some woody tree species around the stone crusher plant (SCP). In Sustainable energy-water-environment nexus in deserts, ed. E. Heggy, V. Bermudez, and M. Vermeersch, 621–27. Cham: Advances in Science, Technology & Innovation. Springer. doi:10.1007/978-3-030-76081-6_78.
- Rea, P., L. Ma, T.E. Gill, J. Gardea-Torresdey, C. Tamez, and L. Jin. 2020. Tracing gypsiferous white sands aerosols in the shallow critical zone in the northern Sacramento mountains, new mexico using Sr/Ca and 87Sr/86Sr ratios. Geoderma 372:114387. doi:10.1016/j.geoderma.2020.114387.
- Richmond, O.M.W., D. Kelly, and T. Longcore. 2015. Lange’s Metalmark butterfly threat assessment and ranking of potential management alternatives. Final Report. Sacramento, CA, USA: U.S. Fish and Wildlife Service, Pacific Southwest Region, National Wildlife Refuge System Inventory and Monitoring Initiative.
- Seinfeld, J.H., and S. Pandis. 1998. Atmospheric chemistry and physics. New York: John Wiley & Sons.
- Shahid, M., C. Dumat, S. Khalid, E. Schreck, T. Xiong, and N.K. Niazi. 2017. Foliar heavy metal uptake, toxicity and detoxification in plants: A comparison of foliar and root metal uptake. J. Hazard. Mater. 325:36–58. doi:10.1016/j.jhazmat.2016.11.063.
- Smith, J., and K. Lee. 2003. Soil as a source of dust and implications for human health. Adv. Agron. 80:1–32.
- Solomon, P.A., D. Crumpler, J.B. Flanagan, R.K.M. Jayanty, E.E. Rickman, and C.E. McDade. 2014. US National PM2.5 chemical Speciation monitoring networks-CSN and IMPROVE: description of networks. J. Air Waste Manag. Assoc. 64:1410–38. doi:10.1080/10962247.2014.956904.
- Stefanov, W., M. Ramsey, P. Christensen, and W.L. Sttefanov. 2003. Identification of fugitive dust generation, transport, and deposition areas using remote sensing. Envi. Eng. Geosci. 9 (2):151–65. doi:10.2113/9.2.151.
- Tallis, M., G. Taylor, D. Sinnett, and P. Freer-Smith. 2011. Estimating the removal of atmospheric particulate pollution by the urban tree canopy of London, under current and future environments. Landsc. Urban Plan. 103 (2):129–38. doi:10.1016/j.landurbplan.2011.07.003.
- Terzaghi, E., E. Wild, G. Zacchello, B.E.L. Cerabolini, K.C. Jones, and A. Di Guardo. 2013. Forest filter effect: Role of leaves in capturing/releasing air particulate matter and its associated PAHs. Atmos. Environ. 74:378–84. doi:10.1016/j.atmosenv.2013.04.013.
- Tiwari, A., and P. Kumar. 2022. Quantification of green infrastructure effects on airborne nanoparticles dispersion at an urban scale. Sci. Total Environ. 838:155778. doi:10.1016/j.scitotenv.2022.155778.
- Ungar, P.S., M.F. Teaford, K.E. Glander, and R.F. Pastor. 1995. Dust accumulation in the canopy: A potential cause of dental microwear in primates. Am. J. Phys. Anthropol. 97 (2):93–99. doi:10.1002/ajpa.1330970202.
- USFWS (U.S. Fish and Wildlife Service). 2002. Antioch Dunes National Wildlife refuge comprehensive conservation plan. Washington, DC: U.S. Fish & Wildlife Service.
- Vanderstock, A.M., T. Latty, R.J. Leonard, and D.F. Hochuli. 2019. Mines over matter: Effects of foliar particulate matter on the herbivorous insect, helicoverpa armigera. J. Appl. Entomol. 143 (1–2):77–87. doi:10.1111/jen.12560.
- Wagner, J., and D. Leith. 2001a. Passive aerosol sampler. Part I: Principle of operation. Aerosol Sci. Technol. 34 (2):186–92. doi:10.1080/027868201300034808.
- Wagner, J., and D. Leith. 2001b. Passive aerosol sampler. Part II: Wind tunnel experiments. Aerosol Sci. Technol. 34 (2):193–201. doi:10.1080/027868201300034826.
- Weber, F., I. Kowarik, and I. Säumel. 2014. Herbaceous plants as filters: Immobilization of particulates along urban street corridors. Environ. Pollut. 186:234–40. doi:10.1016/j.envpol.2013.12.011.
- West, I. 1973. Vanished evaporites; significance of strontium minerals. J. Sediment. Res. 43 (1):278–79. doi:10.1306/74D72748-2B21-11D7-8648000102C1865D.
- White, W.H. 2008. Chemical markers for sea salt in IMPROVE aerosol data. Atmos. Environ. 42 (2):261–74. doi:10.1016/j.atmosenv.2007.09.040.
- Xia, Y., K. Mitchell, M. Ek, J. Sheffield, B. Cosgrove, E. Wood, L. Luo, C. Alonge, H. Wei, J. Meng, et al. 2012. Continental-scale water and energy flux analysis and validation for the North American land data assimilation system project phase 2 (NLDAS-2): 1. Intercomparison and application of model products. J. Geophys. Res. 117 (D3):D03109. doi:10.1029/2011JD016048.
- Zaremba, L.L., and J.J. Carroll. 1999. Summer wind flow regimes over the Sacramento Valley. J. Appl. Meteorol. 38:1463–73. doi:10.1175/1520-0450(1999)038<1463:SWFROT>2.0.CO;2.
- Zocche, J.J., L.A. Da Silva, A.P. Damiani, R.Á. Mendonça, P.B. Peres, C.E.I. dos Santos, R. Debastiani, J.F. Dias, V.M. de Andrade, and R.A. Pinho. 2014. Heavy-metal content and oxidative damage in hypsiboas faber: The impact of coal-mining pollutants on amphibians. Arch. Environ. Contam. Toxicol. 66 (1):69–77. doi:10.1007/s00244-013-9949-6.