
 ?Mathematical formulae have been encoded as MathML and are displayed in this HTML version using MathJax in order to improve their display. Uncheck the box to turn MathJax off. This feature requires Javascript. Click on a formula to zoom.
ABSTRACT
Concentrations of volatile organic compounds (VOCs) in air can be reduced in electrostatic separators where VOCs are ionized using ion-molecule reactions, extracted using electric fields, and eliminated in a waste flow. Embodiments for such separator technology have been explored in only a few studies, despite the possible advantage of purification without adsorbent filters. In one design, based on ionization of VOCs in positive polarity with hydrated protons as reactant ions, efficiencies for removal were measured as 30–40% . The results were fitted to a one-dimensional convective diffusion model requiring an unexpectedly high production rate of reactant ions to match both the model and data. A realistic rate of reactant ion production was used in finite element method simulations (COMSOL) and demonstrated that low removal efficiency could be attributed to non-uniform patterns of sample flow and to incomplete mixing of VOCs with reactant ions. In analysis of complex systems, such as this model, even limited computational modeling can outperform a pure analytical approach and bring insights into limiting factors or system bottlenecks.
Implications: In this work, we applied modern computational methods to understand the performance of an air purifier based on electrostatics and ionized volatile organic compounds (VOCs). These were described in the publication early 2000s. The model presented was one-dimensional and did not account for the effects of flow. In our multiphysics finite element models, the efficiency and operation of the filter is better explained by the patterns of flow and flow influences on ion distributions in electric fields. In general, this work helps using and applying computational modelling to understand and improve the performance bottlenecks in air purification system designs.
Introduction
Human health and comfort of inside buildings or enclosed spaces are associated today with indoor air quality (IAQ), which is influenced by parameters including temperature (Sarbu and Sebarchievici Citation2013), humidity (Toftum, Jørgensen, and Fanger Citation1998,) and the relative abundance of major constituents of air including oxygen (Cantos and Estévez Citation2012), nitrogen, and carbon dioxide (Persily Citation2015). Indoor air quality is also governed by a suite of airborne contaminants such as particulate matter (pm) (Fermo et al. Citation2021), microorganisms (Nevalainen et al. Citation1991), reactive gases (ozone, NOx, SOx), and volatile organic compounds (VOCs). These have been linked to human illness (Paleologos, Selim, and Mohamed Citation2021), decreases in labor productivity (Wyon Citation2004), difficulties in human learning (Stafford Citation2015), and degradation of items of historic or cultural value (Grøntoft et al. Citation2010). Consequently, the regulation of VOC levels in air including their origin and abatement is a growing concern of organizations such as the American Society of Heating, Refrigerating and Air-Conditioning Engineers, the UK National Institute for Health and Care Excellence, and the European Environment Agency.
Volatile organic compounds arise from multiple sources such as interior furnishings (Campagnolo et al. Citation2017) construction materials (Campagnolo et al. Citation2017) human metabolism or activities (Amann et al. Citation2014) and outdoor air (Godoi et al. Citation2013) commonly introduced and blended with indoor air for heating, ventilation, and air conditioning (HVAC) in homes and buildings. In fully enclosed spaces such as submarines (Persson and Wadsö Citation2002; Persson et al. Citation2006) and spacecraft (El Sherif Citation2004) where air is recirculated entirely, high IAQ is achieved through technologies to abate VOCs and monitor air using mass spectrometers on submarines (Raatschen, Matthias, and Westermann Citation2017) and ion mobility spectrometers on the International Space Station (Gardner et al. Citation2010; Wallace et al. Citation2017). In such specialized environments, VOCs are removed from the air principally through adsorption on filters (Peel, Arsac, and Jouandon Citation2010; Raatschen, Matthias, and Westermann Citation2017; Winton et al. Citation2016) or regenerative filters (Cummings et al. Citation2019). Similar technologies are used in HVAC systems of buildings worldwide (Luengas et al. Citation2015; Mata et al. Citation2022) with both in-duct and portable air purifiers (Chen, Zhang, and Zhang Citation2005; Kabrein, Yusof, and Leman Citation2016). Removal efficiencies depend on the design of systems or filters (Chen, Zhang, and Zhang Citation2005) and can range from 30–53%.
Although filtration is a common method to abate VOCs in recirculated HVAC systems, limitations arise from recurring costs of scheduled filter replacement or through losses in IAQ when service life of filters is exceeded (Ligotski et al. Citation2019). Alternative methods for purification such as photocatalytic oxidation, nonthermal plasma reactions (Karatum and Deshusses Citation2016) and ozone oxidation have been proposed though not widely adopted. An alternative to all these methods is simple dilution of indoor air using outdoor air with minor conditioning, i.e., particulate removal and temperature control. Brągoszewska, Palmowska, and Biedroń (Citation2020); Stabile et al. (Citation2016); Stabile et al. (Citation2021); Ye et al. (Citation2014) While this approach is comparatively simple and inexpensive, recirculation of indoor air and supporting technologies for VOCs abatement have been driven recently by energy costs for cooling or heating air and the poor quality in some urban centers of outdoor air (Justo Alonso et al. Citation2023).
A feasible alternative to adsorptive filtering for removing VOCs from air was explored by Ito et al. in the early 2000s through electrostatic separators. Ito et al. (Citation2002); Ito, Otani, and Namiki (Citation2003); Ito et al. (Citation2004) In this method, VOCs were ionized through ion-molecule reactions with charge created from an alpha, or later, a soft X-ray source. In both embodiments, the ion sources produced hydrated protons without significant amounts of ozone, NOx, or SOx, as formed in some discharge sources. Ions derived from VOCs were extracted from air using an electric field and vented in a waste flow from a separator. In this paper, we seek answer why measurements for removal efficiency with toluene in air were 30–40%, and fitting their model was possible only using an exaggerated value for the production rate of reactant ions. We show that their experimental findings can be explained using the capabilities of finite element modeling of ion reactions, ion motion and, gas flow in the separator. Furthermore, we demonstrate with simulations design elements to improve removal efficiency using planar structure.
Simulation
Software
Comsol Multiphysics (COMSOL Multiphysics® v. 5.6.0.401 www.comsol.com, COMSOL AB, Stockholm, Sweden) was used to simulate electric fields, air flow, ion motion, and chemical reactions in a VOC Separator described in by Ito et al. (Citation2002); Ito, Otani, and Namiki (Citation2003) and in an improved design. The software included packages known as Laminar Flow (spf), Electrostatic (es), Transport of Diluted Species (TDS), and Chemistry (chemistry). Every COMSOL simulation was defined by start and end points, and a complete simulation is called an experiment. Simulations were based both on stationary and time-dependent conditions with several assumptions or approximations, including:
Reactions were a type of displacement between a VOC and a reactant ion, here a hydrated proton (EquationEquation 1
(1)
The reaction in EquationEquation 1(1)
(1) is described in COMSOL and throughout the text using terminology of Equation 2 designating VOCs as M, hydrated proton as R+, and product ions or protonated VOCs as MR+.
(2) While an X-ray or alpha emission source will show some loss or inhomogeneity in ion abundance with distance from the source window, an approximation by Ito et al. (Citation2002); Ito, Otani, and Namiki (Citation2003) and maintained here, was the formation of reactant ions (R+) continuously and uniformly throughout the separator volume.
(3) X-ray Ionization of air creates ion pairs, and those in negative polarity are denoted here simply as R−. Recombination reactions (Equation 3) occur in the separator volume and were included in the model as:X-ray Ionization of air creates ion pairs, and those in negative polarity are denoted here simply as R−. Recombination reactions (Equation 3) occur in the separator volume and were included in the model as:
(4) Recombination reactions had time dependent solutions using fluid convection solutions by combining flow simulation with ion transportation by electric fields. The transport of ions in electric fields in air at ambient pressure was described by diffusion coefficients (derived from the Nernst–Einstein relationship) from ion mobility coefficients and charge (here ±1). A standard value for the diffusion coefficient of neutral species was 1 × 10⁻⁹ m2 · sec−1, and the ion-ion recombination rate coefficient was kr of 1 × 10⁻⁸ cm3 · sec−1 (Siegel and Fite Citation1976). Recombination was not relevant in a new separator design with a unipolar environment.
(5) Electric fields between components in the separator were not influenced by ion motion. Consequently, flows and electric fields were solved with stationary systems while chemical reactions and transportation of ions were solved with time dependent systems using stationary solutions as fixed fields with the time-dependent solutions.
(6) Space charge effects were neglected, and electric fields were not influenced by charge density of reactant or product ions, which were low compared to neutral components.
(7) Reactions are not influenced by the velocity and direction of gas flow which carries ions and uncharged VOCs (M in EquationEquation 2
(8) A significant difference in separator measurements (Ito et al. Citation2002; Ito, Otani, and Namiki Citation2003) and parameters for the models used here was electric field strength (E). Values for E from 0.5–7.5 V · cm−1 were used in COMSOL to match reasonable mesh sizes and simulation time steps and reach residence times of ∼100 msec of ions. The VOC reactions reach completion in 0.1 to 20 msec for VOC concentrations 10 to 1000 ppb (Lattouf et al. Citation2021) and thus the low electric field approach should lead to equal or higher ionization efficiency than 250 V · cm−1 the electric field used in the Separator measurement by Ito et al. (Citation2002); Ito, Otani, and Namiki (Citation2003) which leads to residence times of only 6.4 ms maximum. The technical reason to use low electric fields was to ensure time steps greater than sub-microseconds in COMSOL simulation, to limit computational times.
(9) Realized separator measurements (Ito et al. Citation2002; Ito, Otani, and Namiki Citation2003) were made with stabilized flows, but simulation covered only a period of about 1 sec. This was considered enough to demonstrate the internal behavior of the separator.
In , parameters for COMSOL modeling are shown for the separator design of Ito et al. (Citation2002); Ito, Otani, and Namiki (Citation2003) and for a proposed new design with improved performance for VOCs removal. Further comments on COMSOL modeling are given in Supplemental section A.
Table 1. Constants selected for COMSOL simulation. The mobility constants and the reaction constants are taken from literature values (Good, Durden, and Kebarle Citation1970; Izadi et al. Citation2019; Siegel and Fite Citation1976). Temperature and pressure are default values in COMSOL.
Design of VOC Separator of Ito et al. Citation2002
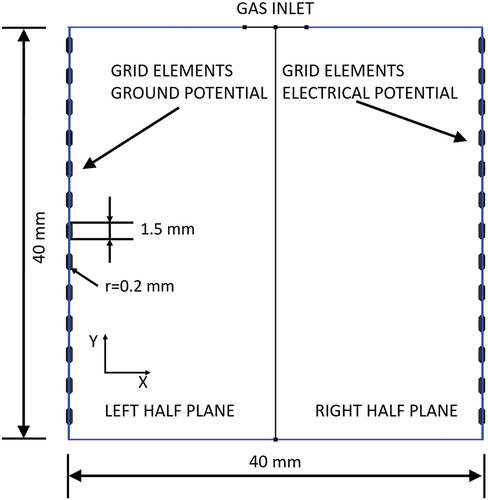
The separator of Ito et al. (Citation2002); Ito, Otani, and Namiki (Citation2003) has a cylindrical structure 50 mm long with a 20 mm radius. The cross section of this cylinder, two-dimensional simulation domain, was simulated in COMSOL in a 2D 40 mm × 40 mm domain (), where the length of simulated area was limited to distance between grid elements depicted in . Sample flow, simulated with average velocity boundary condition, entered the cross section at center top with an inlet 6 mm wide. Air from the sample flow is vented through solid grids on the sides of the Separator, with a pattern of 1.5 mm high slits separated by 1.5 mm lengths of solid. In COMSOL, the slits were defined as horizontal rectangles 0.5 mm wide with 0.2 mm smoothed corner radii. The dimensions, and geometry of the grids and separator were adopted from Ito et al. (Citation2002); Ito, Otani, and Namiki (Citation2003) though values for the mesh size of the grid were inferred from the optical transparency of 51%. While the length of this separator was 50 mm, the simulation model was reduced to 40 mm, because the internal flow patterns are mainly defined by internal volume, and the flow limiting grids. A uniform electric field was established in the volume of the separator through potential differences between the two grids to draw ions to the grid of low potential (on the left in ). In silico modeling began with variations of single parameters to build understanding of individual behaviors in the separator. Parameters were then combined to provide an overall quantitative assessment of separator performance or efficiency for VOC removal. The neutral density of concentration of VOCs in the sample flow entering the separator was 9.9 × 1010 cm−3 (or 3.7 ppb).
Figure 1. Cross section of the structure to separate VOCs from air through ionization and electric field extractions described by and adopted from Ito et al. (Citation2002); Ito, Otani, and Namiki (Citation2003) used in simulation. An axis of symmetry for this separator is established for the visualization and post-processing and has no physical meaning.
Studies of individual parameters
Absence of electric fields
At the start of in silico experiments without electric fields, there were no sample neutrals (M) or reactant ions (R+, R−) in the separator. When sample was introduced into the separator volume (t = 0 s) along with the previously simulated flow pattern, the production of reactant ions was started through “chemistry toolbox”. Product ions (MR+) were produced through EquationEquations 1(1)
(1) and Equation2
(2)
(2) from the mixing of neutral vapor
VOCs M and reactant ions (R+). Sample flow rates were 0.1 to 1.5 L· min−1 with intervals of 0.1 L · min−1. The concentration of VOCs in the sample flow was constant, and the time for modeling reactions and flow patterns was 500 msec. The minimal time step-size was determined independently by the COMSOL solver, with a step-size limited to a maximum of 10 msec.
Absence of sample flow
Changes in densities of ions and neutrals M were explored as a function of electric field without sample flow. A uniform distribution of neutrals (M) was established throughout the separator volume at 3.7 ppb (9.9 × 1010 cm−3). Positive and negative reactant ions were generated constantly at 10 × 1010 cm3 · sec−1. The electric field was varied between 0.5 V · cm−1 and 6.2 V · cm−1 and the residence time for reactant ions, depending on point of origin, was 3.3 sec and 0.27 sec. Simulation periods were 1000 msec with a step-size limited to a maximum of 10 msec and a minimum step-size established independently by COMSOL.
Studies with the combination of electric field, flow, and ionization chemistry
When all parameters (sample flow, neutral densities, rate of formation of reactant ions, and chemically driven spatial formation of product ions) were included into one experiment, the multiphysics capabilities of COMSOL combined synergistic effects into a single solution.
Concentrations of neutrals and reactant ions were zero at t = 0 sec and sample flow was 1 L · min−1. Positive and negative reactant ions were generated at a constant rate of 10 × 1010 cm3 · sec−1 with recombination reactions at a rate of 1 × 10⁻⁸ cm3 · sec−1 (). The electric field in the separator was varied from 0.5 V · cm−1 to 7.5 V · cm−1. The period for simulation was 500 msec with a step-size limited to a maximum of 1 ms and the minimum step-size was established independently by COMSOL.
Results and discussion
Separator by Ito et al. (Citation2002); Ito, Otani, and Namiki (Citation2003)
Flows only
Contour graphics for velocities of gas flow entering the VOC separator at center top are shown () for rates of 0.1 L · min−1 (left) and 1 L · min−1 (right) where a channel of comparatively high velocity is localized with on-axis symmetry to the inlet. On reaching the wall opposite the entrance, the gas flow is split evenly toward the sides of the structure, i.e., toward the grids. Although this pattern of flow is seen vividly in contour graphics at 1 L · min−1, the pattern occurred throughout all the range of flows. Fresh flows entering from the inlet and reaching a wall undergo partial venting through grids with 51% optical transparency. Another portion of gas flows upward along the grid before curling toward the center channel of sample flow. This flow divides again when approaching the center channel of the entering sample flow, with one portion moving upwards and another part flowing downward parallel to the sample flow. This stream joins with the sideways flow, creating a circular pattern and a region of near stagnant volume. The upward flow impacts the top plane of the separator, curls toward the walls, and flows downward, forming another region of near stagnant volume. Consequently, each half contains two stagnant regions, one plainly visible lower volume and a weakly visible or lesser formed upper volume. It is notable that while the flow patterns implicate vortex-type behavior, the maximum Reynolds-number in any flow simulated condition is Re = 14.5, well below the commonly considered turbulent limit Re = 3,500.
Figure 2. Contour map of the steady state flow velocity magnitudes simulated (left). 0.1 L·min−1 (right) 1 L·min−1. Color scaling: (left) dark blue 0 m·sec−1, dark red 0.08 m·sec−1, (right) dark blue 0 m · sec−1, dark red 1 m · sec−1.
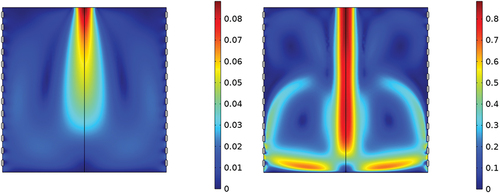
The pronounced flow patterns seen in arise from the high-velocity on-axis flow through the inlet of the structure and the pressures that build locally where flows impact a surface. A symmetrical pressure dome builds on the bottom plane at the point of impact of sample flow (see Supplemental section B, Figure S1), and induces a split in sample flow along pressure contours and toward the walls (i.e., grids). Upon reaching the walls, flow is vented significantly through openings in the grid near the bottom, and this is estimated as 20–30% of total flow while the input and total output flows are balanced. As flow impacts solid surfaces of the grid, flow is directed by collisions upward where flow is drawn toward the center channel through a reduced pressure from venturi effects and together with this flow creates a stagnant region or region of much reduced flows. The splitting of flows by collisions and regions of localized pressure increases establishes another lesser stagnant region toward the top. Although localized pressure increases are seen in the model and provide an understanding of the patterns of flow, the increase in pressure throughout the whole structure is less than 1 Pa and is not expected to have meaningful effect to reactions between neutrals (M) and reactant ions (R+) in the separator.
The findings of COMSOL demonstrate a heterogeneous structure for flows, with some regions of high flow and well-defined flows and other regions of low flow where flows will be nearly stagnant. Ion formation and ion-molecule reactions are time-dependent and should be affected by residence times in these two flow-defined regions. In addition, neutrals (M) carried out of the separator through the grids contributes to loss in VOCs removal efficiencies. As shown in losses are pronounced toward the lower part of the separator near the bottom of the grids. Removal of VOCs through ionization necessitates the introduction of reactant ions as next steps in understanding the performance of this separator design.
Reactant ions only, no field
When the ion source is turned on (t = 0 sec, ), in the absence of electric field without any sample neutrals (M), reactant ion (R+) abundance (density) increases at the rate kR throughout a range of gas flows reaching a maximum of 4.7 × 1010 cm−3 at a flow of 0.1 L · min−1 and 0.5 sec. Plots for flows from 0.2 to 1.5 L · min−1 show lesser abundances of reactant ions reaching 3.3 × 1010 cm−3 at a flow of 1.5 L · min−1 at 0.5 sec. This constitutes a loss of 29.8% of reactant ions between extremes of flow rates.
Figure 3. Average reactant ions (R+) density in the absence of electric field and sample neutrals (M) in the left half of the Separator. The values and changes with time are symmetrical around the vertical axis of symmetry (). Scatter markers are placed on every 10th step of stored data.
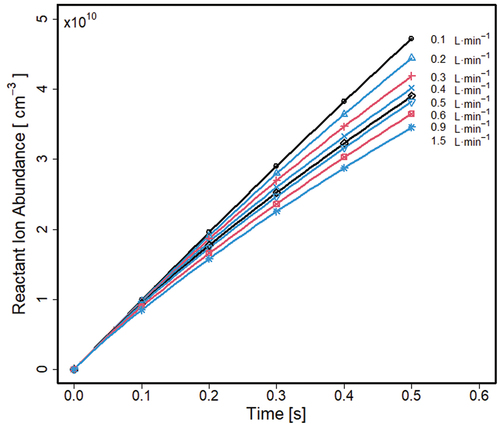
Reactant ion density decline with increased flow is attributed to volumetric losses of these ions carried out of the volume through the grids, with the highest loss rate near the base of the structure. The complex patterns of flows () and reactant ions transportation by flow portends ionization of sample much different from the simple model of uniform flows and ion densities provided in the models of Ito et al. (Citation2002); Ito, Otani, and Namiki (Citation2003).
Neutrals only without reactions
In , plots are shown for the average density of neutrals (M) as a function of time for a range of flows between 0.1 to 1.5 L · min−1 in the absence of an electric field and without any chemical reactions during the simulation period of 500 msec. The plot is for one half of the separator, and flows will be symmetrical around the central vertical axis (). The average density of neutrals (M) exhibits near linear increase in the first 0.1 sec with all flows, except for the highest. Averaged neutral density reaches a plateau for all flows with increased flow. After the maxima are reached, a slight decrease is noticeable at flows of 0.3 L · min−1 and higher. It should be noted that simulation period for low flows do not present the true steady state: simulation periods over 3 sec for 0.1 L · min−1 would be needed, but simulation was intentionally limited to 0.5 sec for consistency with other flow rates.
Figure 4. Average density of sample neutrals (M) solved for the left half of the separator. The values and changes with time should be symmetrical around the axis of symmetry (). Scatter markers are placed on every tenth step of stored data.
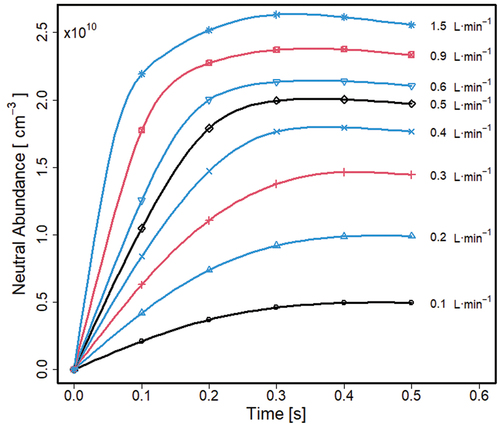
As sample (M) flows into the separator at a certain volumetric rate with static steady state (preparatory simulations) flow pattern, the original volume is replaced with sample at every flow and an increase in average density (the entire volume) occurs with time. Concentrations for every flow eventually reaches a steady state, where all mechanisms of accumulation of sample neutrals and their loss are balanced. A ∼15 times increase in flow rate, from 0.1 to 1.5 L · min−1, led to an increase of sample neutrals of 6.25 times, from 0.4 to 2.5 × 1010 cm−3. An increase of (M) in stagnant regions and “dead flow zones” is boosted with increased flows, and from, the low diffusivity of M. At high flows (, right), a spread of sample occurs in the upper part of the separator, accompanied simultaneously with losses through the grids. Both processes lead to the patterns for (M) with steady states reached due to an increase in losses through the grids. As a result, the average density throughout the separator is a fraction of the original sample flow at 9.9 × 1010 cm−3.
The findings demonstrate that sample neutrals are distributed heterogeneously in the separator, which is most prominent with high and thus practical flow rates. Since the average density never reaches that of the in-flow of sample (9.9 × 1010 cm−3), there are regions where exchange of the original volume with sample does not fully occur. Thus, specific behaviors of flow, here exit flow and the stagnant zones influence the average density of sample neutrals, and this should not be addressed with a model of homogeneous distribution of sample neutrals. Since ions are produced from sample vapor flow, efficiency of ion removal may be influenced by sample flow rates.
Product ion without electric field and with sample flow
The average densities of product ions (MR+) throughout the volume, in the absence of electric fields, are shown in for several flow rates for a sample with a constant vapor composition of ([M] at 9.9 × 1010 cm−3 or 3.7 ppb). A pattern of abundance with flow shows a maximum of 1.35 × 1010 cm−3 at 0.3 L · min−1 and 0.5 sec.
Figure 5. Average density of product ions (MR+) within the left volume of the separator with E = 0 V · cm−1 and sample flows from 0.1 to 1.5 L · min−1. The values and changes with time should be symmetrical around the axis of symmetry (). Scatter markers are placed on every tenth step of stored data. Only a limited number of labels are plotted to keep clarity.
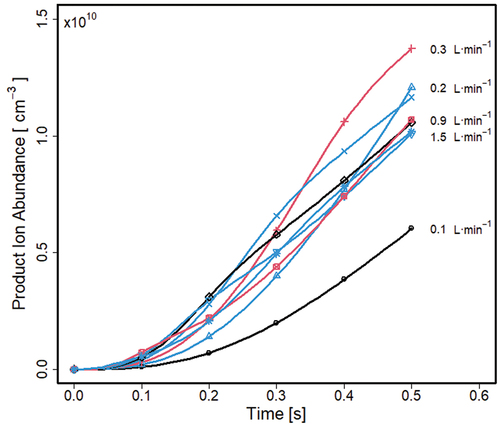
The product ions are formed through [MR+] = kr[R+][M] where an increase in [MR+] with time is consistent with linear increases of (R+), and with increasing (M). The behavior of increase of [MR+] as a function of flow results from the complexity development of the flow patterns in the separator (see ).
The heterogeneity of distribution of ions and neutrals caused by the flows will become even more complex with the addition of electric fields, which affect ions but not sample neutrals. Nevertheless, the reactions described in EquationEquation 2(2)
(2) is affected through local concentrations of neutrals (M) and reactant ions (R+) and thus their transportation in the separator. For this reason, the following studies included product ion MR+ with the presence of an electric field and without flows in the body of the separator.
Product ion (MR+) with electric field, and without gas flow
Changes in average densities of product ions in electric fields without gas flow from 0 to 1 s, starting with a uniform distribution of sample (M) at 9.9 × 1010 cm−3, are shown in for the separator halves. In each half, [MR+] increases with time and average densities in the right half () decrease with increases in electric field strength. Since an electric field exists throughout the separator, all ions are in motion continuously toward low potential with drift velocities equal to k0 · E⃗ where k0 is the mobility coefficient (cm2 · V −1 · sec−1). Average linear velocities in E⃗ of 0.5 to 6.2 V · cm−1 will be 1.2 cm · sec−1 to 14.9 cm · sec−1 for reactant ions and 1 cm · sec−1 to 12.4 cm · sec−1 for product ions, since k0 were 2.4 cm2 · V −1 · sec−1 for R+ and 2.0 cm2 · V −1 · sec−1 for MR+. Ion residence times, from separator center to left grid, will be short (134 ms for R+ and 161 ms for MR+). Consequently, there will be significant ion flow continuously through the left half () during a 1 sec in silico experiment, including those entering from the right half of the separator. It should be noted that simulation period is limited to 1 sec and all neutrals would react, and the electric field would remove all the product ions if simulation was run over a very long period.
Figure 6. Average density of product ions (MR+) in the absence of flow in left half (a) and right half (b) of the separator. Scatter markers are place on every tenth step of stored data.
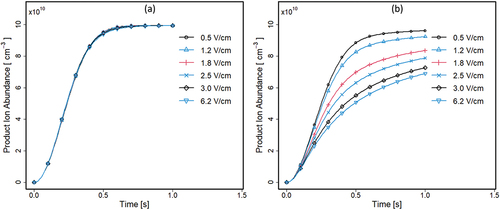
The plot for the right half illustrates the combined effects (simultaneous starting at t = 0) from (i) formation of reactant ions, (ii) conversion of M to MR+, and (iii) extraction of R+ and MR+ at the left grid, all without complex patterns of sample flow (). A distinctive of is the influence of electric field, where increased E⃗ results in decreased [MR+] in right half through transportation of ions toward the left half of the separator. Since ion flux follows ⃗vd = k0 · E⃗, increases in E⃗ will lead to increased ion extraction, including reactant ions from the right half. In the absence of sample flow, reactant ions will be extracted uniformly throughout the volume, reducing the formation of MR+. Thus, the changes at right in abundance are a sum effect from losses in reaction yields with decreased R+ and field extraction of MR+. In contrast, at left reactant ion flow to the grid is replaced with an equal amount from the right half with an apparent balance for [MR+] at all electric fields during the simulation period.
In , the average density for neutrals (M) in both halves of the separator are shown with time and electric field strength. In the left half (), sample neutral density (M) decreases to 0 within ∼800 msec for all fields. In contrast, this is approached in the right half () only at the low field strength of 0.5 V · cm−1 where the plot profile approximates that in the left half. At stronger field strengths, the density of remaining neutrals increases proportionately and divergence becomes more pronounced from the low field profile. In the right half and at the highest field, ∼35% of initial neutrals remain.
Figure 7. Average density of sample neutrals M in left (a) and right (b) halves of the separator in the absence of flow. Scatter markers are placed on every tenth step of stored data.
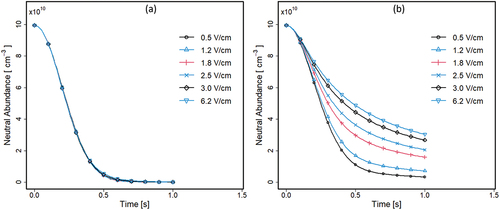
In the left half of the separator, (R+) arises from constant production (from the ion source) and from mobility-based ion flow from the right with an electric field. Consequently, reactant ions are in excess in the left half and become a limiting reagent in the right half, increasingly with increased field strength.
The product ions (MR+) are generated in the reaction shown in EquationEquation 2(2)
(2) at the rate kM, and their generation rate and abundance depends also on the reactant ions density (R+). While (R+) has a linear increase in density in the absence of flow (), the implementation of an electric field transports them from the right to the left half of the structure, modifying their time-dependent profile (see Supplemental Section B, Figure S2).
This ionization asymmetry in the structure highlights a significant loss in efficiency in the right half, resulting in an overall loss in VOCs ionization/removal efficiency in real experiment. This is a design-related feature that can be improved with different structures. In a final step toward the separator suggested by Ito et al. (Citation2002); Ito, Otani, and Namiki (Citation2003) all influences must be brought together to determine VOCs removal efficiency.
Separator performance with electric fields and sample flow
Results in silico studies with all influences in the separator are shown () for average product ion (MR+) densities in both halves. A notable feature is the low absolute values for the product ion abundance of 0.9 × 1010 cm−3 which is less than 10% ionization efficiency for the left half, compared to input density of neutrals (9.9 × 1010 cm−3). There is a minor influence of residence times for ions seen in the variations with electric field. Comparable performance, although intensified by the increased electric field is observed on the right half .
Figure 8. Average density of product ions (MR+) in left (a) and right (b) halves when flow was 1 L · min−1 and electric field strength in the separator volume at values from 0.5 to 7.5V · cm−1. Simulation was run for 500 ms with maximum step size waslimited to 10 msec. Markers are placed to every tenth stored step.
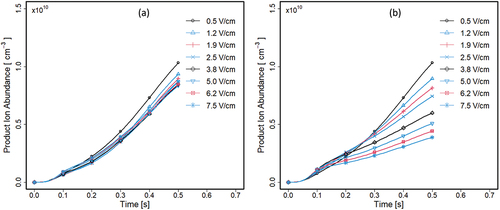
The neutrals (M) are transported by flow and reactant (R+) and product ions (MR+) by flow and electric field (see Supplemental Section B, Figures S3 and S4). Thus, the low absolute efficiencies in both halves reflect the uneven distribution of reaction components available for reactions in both volumes. Since the electric fields in experimental measurements were 100× these values with proportionally reduced residence times, these simulations constitute ion abundances greater than seen in laboratory studies. Overall efficiencies of VOC removal were determined using 1 s simulations with sample neutral concentration of 50 ppb (1.3 × 1012 cm−1), electric field of 7.5 V · cm−1, and inlet flow of 1 L · min−1. Efficiency of removal was defined using reductions of VOC in a “cleaned” flow from the right half of the separator as shown in Equation 4
where fin is total flow through the whole structure, fright is the flow through the right boundary and thus fright = 0.5fin, [M]right is the neutrals’ concentration, and [MR+]right the product ions in the right boundary and [M] in the concentration of neutrals in the inlet. The efficiency of the system based on these calculations was determined as 33% which favorably matches the experimental findings of 30 to 40% reported by Ito et al. (Citation2002); Ito, Otani, and Namiki (Citation2003) from laboratory measurements.
Improved separator with planar structure
An alternative design for a VOC Separator was prepared using understandings from COMSOL models of the separator of Ito et al. (Citation2002); Ito, Otani, and Namiki (Citation2003) and simulated with methods described above. The alternative structure consists of two 200 mm long “plates” separated with a 50 mm gap () where sample flow enters a field-free ionization region (40 mm). Flow then passes into a field-free afterglow region (135 mm long). A 10 mm long section near the end of the plates is used to establish an electric field region to force the ions toward the bottom plate (), separating them from neutral flows. Separation of ions and neutral flows occurs at a 15 mm region with a physical divider to separate the ion-depleted and ion-enriched gas flows (i.e., the flow divider). The width of the flow channels was 10 · mm (along the z-direction). The density of reactant ions was limited to 1 × 1011 cm−3 based on findings from Anttalainen et al. (Citation2021). Parameters included inlet concentration of neutrals, 5 ppb to 50 ppb (1.3 × 1011 cm−3 to 1.3 × 1012 cm−3), flow of sample, 1 to 3 L · min−1, a difference in potential in the electric field region, 20.8 V (E = 4.2 V · cm−1), ion mobility for reactant ions, 2.4 cm2 · V −1 · sec−1, and ion mobility for product ions, 1.0 cm2 · V −1 · sec−1. Specific assumptions in the model included
Figure 9. A proposed VOC Separator with high efficiency for removal of VOCs through electrostatics.
Formation of reactant ions was uniform throughout the reaction volume with an initial maximum density of 1 × 1010 cm−3.
Ions striking walls at the flow divider are neutralized and swept from the separator. Separation efficiencies was established by ion motion before the flow divider and are independent of any neutralizations on walls, after the division of flow. Thus, the neutralization process was not included in the modeling and was inconsequential for efficiencies of separation.
An example of steady state condition of the separator at 1 L · min−1 flow rate and 50 ppb neutral concentration is given in Supplemental Section C, Figure S5.
The influences of flow rates and neutral density of sample on filtering efficiency are shown in for flow between 1 L · min−1 and 3 L · min−1 and neutral densities of M from 5 ppb (1.3 × 1011 cm−3) to 50 ppb (1.3 × 1012 cm−3). The percent filtering efficiency was calculated with EquationEquation 5(5)
(5) as the ratio of [M]out and [M]in:
Figure 10. Efficiency of the planar separator as a function of flow rate when sample concentration was varied between 5 ppb (1.3·1011 cm−3) and 50ppb (1.3·1012 cm−3). Concentration of 50 ppb was simulated with flow rates up to 2.75 L · min−1.
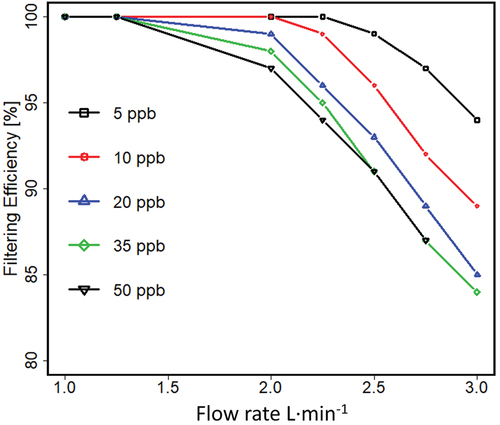
Removal efficiency is decreased with increased sample flow rate or increased sample concentration at a given flow rate with the lowest value of 85% with this structure dimensions and chosen operating parameters. The further details of the simulation and flow rate to ionization reaction efficiency is provided in Supplemental section C, Figure S6.
Core lessons from models
In the separator model of Ito et al. (Citation2002); Ito, Otani, and Namiki (Citation2003) mixing of ions and neutrals was governed by patterns of flow, which affected reaction probabilities through localization of both neutrals and ions and losses of neutrals at grids. While this conclusion was done based on 2D-simulation, it can be assumed that grid elements necessary for electric field realization will cause complex and thus limiting patterns also in real 3D-separator. The geometry and the resulting flow pattern is the main contributor for the low ionization efficiency.
Ion removal in a linear electric field was effective and limited by abundance of reactant ions when flow was increased.
These are not fundamental limitations and rather arise from technology with designs and parameters. While the focus of this work was to explain experimental results by Ito et al. (Citation2002); Ito, Otani, and Namiki (Citation2003), it also validates the power of computational method capable to combine multiple physical models into one model, when exploring solutions for more optimal designs for VOC removal.
Conclusion
The isolation and removal of VOCs from indoor air using an electrostatic separator can be achieved with high efficiency when mechanical designs and operating parameters are configured around patterns of sample flow, dynamics of mixing of ions and neutral (i.e., residence times), and effective transport of ions in electric field to maximize contact probability of neutrals and reactants. The inefficiencies in an original design from 2002 (Ito et al. Citation2002) were identified through simulations using COMSOL modeling in each of these functional aspects. The major contributor for the unexpected low efficiency compared to original model was related to mechanical design, specifically to the grids, which are necessary to create electric field and were not included in the original model, and which caused nonuniform flow field leading to nonuniform concentration patterns in the separator. The findings from simulation model were used to demonstrate the principles for an improved design, where laminar flow and uniform distribution of neutrals and electrostatic removal should be central in any future technology embodiments.
Ethical statement
All authors declare that the manuscript has been written solely by authors and no Artificial Intelligence (AI) has been used.
ComputationalAnalysisOA100823-supplemental-revised.docx
Download MS Word (2.8 MB)Disclosure statement
No potential conflict of interest was reported by the authors.
Data availability statement
The COMSOL models that support the findings of this study are available from the corresponding author, upon reasonable request.
Supplementary material
Supplemental data for this article can be accessed online at https://doi.org/10.1080/10962247.2023.2265329
Additional information
Funding
Notes on contributors
Osmo Anttalainen
Osmo Anttalainen is a Ph.D. student at VERIFIN, University of Helsinki, specializing in chemical separation of atmospheric pressure ions. He earned M.Sc. (E.E.) from the University of Lappeenranta in 1992. He has more than 20 years of experience in instrumentation and applications of ion mobility spectrometry.
Elie Lattouf
Elie Lattouf, Ph.D., is a Physicist and former Associate Professor at the Faculty of Science, Lebanese University, and postdoctoral researcher at the University of Helsinki, and is currently joining ETH in Zürich to contribute to mid-IR spectroscopy and device benchmark in the Vocorder project.
Paula Vanninen
Paula Vanninen, Ph.D., professor, is a Director of the Finnish Institute for Verification of the Chemical Weapons Convention (VERIFIN) at the University of Helsinki. She works to support, execute and guide activities that belong to activities of VERIFIN, as well implements the strategic plan.
Hanna Hakulinen
Hanna Hakulinen, Ph.D., is the Research Director of the Finnish Institute for Verification of the Chemical Weapons Convention (VERIFN) at the University of Helsinki. She specializes on verification analysis and chemical forensics research to support the chemical weapons convention, and engages is versatile laboratory capacity building training activities.
Tapio Kotiaho
Tapio Kotiaho is a professor at the University of Helsinki.
Gary Eiceman
Gary Eiceman is Research Professor at New Mexico State University in Las Cruces, NM, where he has been on faculty since 1980. Recently, he has been a Director of Research at University Helsinki (2020-2023). His research interests include gas phase ion-molecule reactions at ambient pressure, technology for measuring the mobility of ions in electric fields, and applications with portable ion mobility spectrometers. These include the detection of explosives in aviation security, other hazardous substances in airborne vapors, and volatile organic compounds in indoor air of residential and commercial buildings and in confined places such as spacecraft. He is co-author of Ion Mobility Spectrometry which is in a third edition. He assisted in the launch of Sionex Corp in 2000 and Gas Phase Ionics, LLC, in 2021 and has been a consultant to small and large companies for chemical instrumentation.
References
- Amann, A., B.D.L. Costello, W. Miekisch, J. Schubert, B. Buszewski, J. Pleil, N. Ratcliffe, and T. Risby. 2014. The human volatilome: Volatile Organic Compounds (VOCs) in exhaled breath, skin emanations, urine, feces and saliva. J. Breath Res. 8 (3):17. doi:10.1088/1752-7155/8/3/034001.
- Anttalainen, O., E. Lattouf, T. Kotiaho, and G. Eiceman. 2021. Ion density of positive and negative ions at ambient pressure in air at 12–136 mm from 4.9 kV soft x-ray source. Rev. Sci. Instrum. 92 (5):54104–10. doi:10.1063/5.0050669.
- Brągoszewska, E., A. Palmowska, and I. Biedroń. 2020. Investigation of indoor air quality in the ventilated ice rink arena. Atmos. Pollut. Res. 11 (5):903–08. doi:10.1016/j.apr.2020.02.002.
- Campagnolo, D., D.E. Saraga, A. Cattaneo, A. Spinazzè, C. Mandin, R. Mabilia, E. Perreca, I. Sakellaris, N. Canha, V.G. Mihucz, et al. 2017. Vocs and aldehydes source identification in European office buildings - The OFFICAIR study. Build. Environ. 115:18–24. doi:10.1016/j.buildenv.2017.01.009.
- Cantos, J. O., and D.M. Estévez. 2012. Variations of oxygen in the air and its impact on human health. Boletin De La Asociacion De Geografos Espanoles. 58:431–37.
- Chen, W., J.S. Zhang, and Z. Zhang. 2005. Performance of air cleaners for removing multiple volatile organic compounds in indoor air. ASHRAE Tran. 111 (PART 1):1101–14.
- Cummings, C. Y., T.O. Taylor, M.L. Support, U. Kingdom, and P.O. Mahony. 2019. Regenerable and functionalised charcoal for submarine atmosphere control. In 49th International Conference on Environmental Systems, Omni Parker House Hotel Boston, MA, United States. 1–11. July 7-11.
- El Sherif, D. 2004. International Space Station Carbon Dioxide Removal Assembly (ISS CDRA) troubleshooting and evaluation. In International Conference on Environmental Systems, Colorado Springs, Colorado.
- Fermo, P., B. Artíñano, G. De Gennaro, A.M. Pantaleo, A. Parente, F. Battaglia, E. Colicino, G. Di Tanna, A. Goncalves da Silva Junior, I.G. Pereira, et al. 2021. Improving indoor air quality through an air purifier able to reduce aerosol Particulate Matter (PM) and Volatile Organic Compounds (VOCs): Experimental results. Environ. Res. 197:111131. doi:10.1016/j.envres.2021.111131.
- Gardner, B. D., P.M. Erwin, S. Thoresen, J. Granahan, and C. Matty. 2010. International space station major constituent analyzer on-orbit performance. In 40th International Conference on Environmental Systems, ICES, Barcelona, Spain.
- Godoi, R. H., A.F. Godoi, S.J. Gonçalves Junior, S.L. Paralovo, G.C. Borillo, C. Gonçalves Gregório Barbosa, M.G. Arantes, R.C. Charello, N.A. Rosário Filho, M.T. Grassi, et al. 2013. Healthy environment - indoor air quality of Brazilian elementary schools nearby petrochemical industry. Sci. Total Environ. 463-464:639–46. doi:10.1016/j.scitotenv.2013.06.043.
- Good, A., D.A. Durden, and P. Kebarle. 1970. Mechanism and rate constants of ion–molecule reactions leading to formation of H+(H2O)n in moist oxygen and air. J. Chem. Phys. 52 (1):222–29. doi:10.1063/1.1672668.
- Grøntoft, T., M. Odlyha, P. Mottner, E. Dahlin, S. Lopez-Aparicio Susana, S. Jakiela, M. Scharff, G. Andrade, M. Obarzanowski, M. Ryhl-Svendsen, et al. 2010. Pollution monitoring by dosimetry and passive diffusion sampling for evaluation of environmental conditions for paintings in microclimate frames. J. Cult. Herit. 11 (4):411–19. doi:10.1016/j.culher.2010.02.004.
- Ito, T., N. Namiki, H. Lee Emi, and Y. Otani. 2002. Electrostatic Separation of volatile organic compounds by ionization. Environ. Sci. Technol. 36 (19):4170–74. doi:10.1021/es025505z. PMID: 12380091.
- Ito, T., Y. Otani, and N. Namiki. 2003. Separation of volatile organic compound vapor by an ionization and Electrical MigrationSeparation model. Ind. Eng. Chem. Res. 42 (22):5617–21. doi:10.1021/ie0302286.
- Ito, T., Y. Otani, and N. Namiki. 2004. Electrostatic separation of carbon dioxide by ionization in bifurcation flow. Aerosol Air Qual. Res. 4 (1):91–104. doi:10.4209/aaqr.2004.07.0007.
- Izadi, Z., M. Tabrizchi, H. Borsdorf, and H. Farrokhpour. 2019. Humidity effect on the drift times of the reactant ions in ion mobility spectrometry. Anal. Chem. 91 (24):15932–40. doi:10.1021/acs.analchem.9b04450.
- Justo Alonso, M., P. Liu; S. Marman, R. Jørgensen, and H. Mathisen. 2023. Holistic methodology to reduce energy use and improve indoor air quality for demand-controlled ventilation. Energy Build. 279:112692. doi:10.1016/j.enbuild.2022.112692.
- Kabrein, H., M.Z. Yusof, and A.M. Leman. 2016. Progresses of filtration for removing particles and gases pollutants of indoor; limitations and future direction; review article. ARPN J. Eng. Appl. Sci. 11:3633–39.
- Karatum, O., and M.A. Deshusses. 2016. A comparative study of dilute VOCs treatment in a non-thermal plasma reactor. Chem. Eng. J. 294:308–15. doi:10.1016/j.cej.2016.03.002.
- Lattouf, E., O. Anttalainen, T. Kotiaho, H. Hakulinen, P. Vanninen, and G. Eiceman. 2021. Parametric sensitivity in a generalized model for atmospheric pressure chemical ionization reactions. J. Am. Soc. Mass Spectrom. 32 (8):2218–26. doi:10.1021/jasms.1c00158.
- Ligotski, R., U. Sager, U. Schneiderwind, C. Asbach, and F. Schmidt. 2019. Prediction of VOC adsorption performance for estimation of service life of activated carbon based filter media for indoor air purification. Build. Environ. 149:146–56. doi:10.1016/j.buildenv.2018.12.001.
- Luengas, A., A. Barona, C. Hort, G. Gallastegui, V. Platel, and A. Elias. 2015. A review of indoor air treatment technologies. Rev. Environ. Sci. Biotechnol. 14 (3):499–522. doi:10.1007/s11157-015-9363-9.
- Mata, T. M., A.A. Martins, C.S.C. Calheiros, F. Villanueva, N.P. Alonso-Cuevilla, M.F. Gabriel, and G.V. Silva. 2022. Indoor air quality: A review of cleaning technologies. Environments 9 (9):118. doi:10.3390/environments9090118.
- Nevalainen, A., A.L. Pasanen, M. Niininen, T. Reponen, P. Kalliokoski, and M.J. Jantunen. 1991. The indoor air quality in Finnish homes with mold problems. Environ. Int. 17 (4):299–302. doi:10.1016/0160-4120(91)90015-I.
- Paleologos, K. E., M.Y.E. Selim, and A.-M.O. Mohamed. 2021. Pollution assessment for sustainable practices in applied sciences and Engineering. Elsevier Inc. doi:10.1016/B978-0-12-809582-9.00008-6.
- Peel, A.-E., F. Arsac, and E. Jouandon. 2010. Control of the submarine atmosphere in the French navy. In 40th International Conference on Environmental Systems, Barcelona, Spain. 3275.
- Persily, A. 2015. Indoor carbon dioxide concentrations in ventilation and indoor air quality standards. In Proceedings of 36th AIVC, Conference on Effective Ventilation in High Performance Buildings, Madrid, Spain. 810–19.
- Persson, O., C. Östberg, J. Pagels, and A. Sebastian. 2006. Air contaminants in a submarine equipped with air independent propulsion. J. Environ. Monit. 8 (11):1111–21. doi:10.1039/B605331A.
- Persson, O., and L. Wadsö. 2002. Indoor air quality in submarines. Indoor Air. 1:806–11.
- Raatschen, W., C. Matthias, and H. Westermann. 2017. Advanced life support system for CO2, H2, CO, R134a and VOC removal on submarines. In 47th International Conference on Environmental Systems, Charleston, South Carolina. 1–9.
- Sarbu, I., and C. Sebarchievici. 2013. Aspects of indoor environmental quality assessment in buildings. Energy Build. 60:410–19. doi:10.1016/j.enbuild.2013.02.005.
- Siegel, M., and W. Fite. 1976. Terminal ions in weak atmospheric pressure plasmas. Applications of atmospheric pressure ionization to trace impurity analysis in gases. J. Phys. Chem. 80 (26):2871–81. doi:10.1021/j100567a013.
- Stabile, L., M. Dell’isola, A. Frattolillo, A. Massimo, and A. Russi. 2016. Effect of natural ventilation and manual airing on indoor air quality in naturally ventilated Italian classrooms. Build. Environ. 98:180–89. doi:10.1016/j.buildenv.2016.01.009.
- Stabile, L., A. Pacitto, A. Mikszewski, L. Morawska, and G. Buonanno. 2021. Ventilation procedures to minimize the airborne transmission of viruses in classrooms. Build. Environ. 202:108042. doi:10.1016/j.buildenv.2021.108042.
- Stafford, T. M. 2015. Indoor air quality and academic performance. J. Environ. Econ. Manag. 70:34–50. doi:10.1016/j.jeem.2014.11.002.
- Toftum, J., A.S. Jørgensen, and P.O. Fanger. 1998. Upper limits for indoor air humidity to avoid uncomfortably humid skin. Energy Build. 28 (1):1–13. doi:10.1016/S0378-7788(97)00017-0.
- Wallace, W. T., T.F. Limero, L.J. Loh, P.D. Mudgett, and D.B. Gazda. 2017. Monitoring of the atmosphere on the International space station with the air quality monitor. In 47th International Conference on Environmental Systems, Charleston, South Carolina.
- Winton, D., J. Isobe, P. Henson, A. MacKnight, S. Yates, and D. Schuck. 2016. Carbon dioxide removal technologies for Space vehicles - past, present, and future. In 46th International Conference on Environmental Systems, Vienna, Austria. 10–14.
- Wyon, D. 2004. The effects of indoor air quality on performance and productivity. Indoor Air 14:92–101. doi:10.1111/j.1600-0668.2004.00278.x.
- Ye, W., D. Won, and Zhang. 2014. X.A preliminary ventilation rate determination methods study for residential buildings and offices based on VOC emission database. Build. Environ. 79:168–80. doi:10.1016/j.buildenv.2014.05.009.