
 ?Mathematical formulae have been encoded as MathML and are displayed in this HTML version using MathJax in order to improve their display. Uncheck the box to turn MathJax off. This feature requires Javascript. Click on a formula to zoom.
ABSTRACT
Carlsbad Caverns National Park (CAVE) is located in southeastern New Mexico and is adjacent to the Permian Basin, one of the most productive oil and natural gas (O&G) production regions in the United States. Since 2018, ozone (O3) at CAVE has frequently exceeded the 70 ppbv 8-hour National Ambient Air Quality Standard. We examine the influence of regional emissions on O3 formation using observations of O3, nitrogen oxides (NOx = NO + NO2), a suite of volatile organic compounds (VOCs), peroxyacetyl nitrate (PAN), and peroxypropionyl nitrate (PPN). Elevated O3 and its precursors are observed when the wind is from the southeast, the direction of the Permian Basin. We identify 13 days during the July 25 to September 5, 2019 study period when the maximum daily 8-hour average (MDA8) O3 exceeded 65 ppbv; MDA8 O3 exceeded 70 ppbv on 5 of these days. The results of a positive matrix factorization (PMF) analysis are used to identify and attribute source contributions of VOCs and NOx. On days when the winds are from the southeast, there are larger contributions from factors associated with primary O&G emissions; and, on high O3 days, there is more contribution from factors associated with secondary photochemical processing of O&G emissions. The observed ratio of VOCs to NOx is consistently high throughout the study period, consistent with NOx-limited O3 production. Finally, all high O3 days coincide with elevated acyl peroxy nitrate abundances with PPN to PAN ratios > 0.15 ppbv ppbv−1 indicating that anthropogenic VOC precursors, and often alkanes specifically, dominate the photochemistry.
Implications: The results above strongly indicate NOx-sensitive photochemistry at Carlsbad Caverns National Park indicating that reductions in NOx emissions should drive reductions in O3. However, the NOx-sensitivity is largely driven by emissions of NOx into a VOC-rich environment, and a high PPN:PAN ratio and its relationship to O3 indicate substantial influence from alkanes in the regional photochemistry. Thus, simultaneous reductions in emissions of NOx and non-methane VOCs from the oil and gas sector should be considered for reducing O3 at Carlsbad Caverns National Park. Reductions in non-methane VOCs will have the added benefit of reducing formation of other secondary pollutants and air toxics.
Introduction
As of 2021, Texas accounts for nearly a quarter of U.S. natural gas production, and together, Texas and New Mexico account for more than half of U.S. crude production (U.S. Energy Information Administration, Citation2023a, Citation2023b). Oil and gas (O&G) extraction is a major source of emissions of volatile organic compounds (VOCs) and nitrogen oxides (NOx = NO + NO2) emissions (Francoeur et al. Citation2021), and while the emission magnitudes are still underconstrained, these emissions have the potential to increase ground level ozone (O3) production (Olaguer Citation2012), particularly across the central U.S. (Pozzer, Schultz, and Helmig Citation2020; Tzompa-Sosa and Fischer Citation2021). The impact of O&G sources on O3 production has been quantified in some populated locations in Texas (e.g., Ahmadi and John Citation2015; Nelson et al. Citation2023; Pacsi et al. Citation2015), and prior studies indicate that the impacts vary regionally (Tzompa-Sosa and Fischer Citation2021) and should be analyzed on a case-by-case basis (Pacsi et al. Citation2015). While often overlooked, O&G development also likely impacts nearby Class 1 areas (Rodriguez, Barna, and Moore Citation2009). Class 1 areas include large U.S. National Parks and Wilderness Areas, and these locations have special air quality protections under the Clean Air Act.
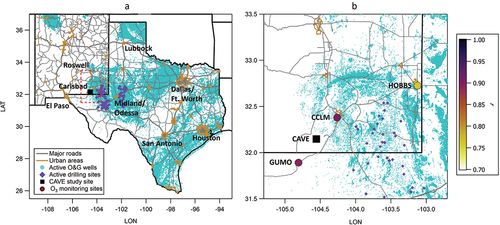
Carlsbad Caverns National Park (CAVE) is located in southeastern New Mexico and within the western part of the Permian O&G production basin (). The Permian Basin is one of the most productive and growing O&G production regions in the country (Koss et al. Citation2017). O&G production within the Permian Basin has contributed to increased emissions of many O3 precursors in the region (Benedict et al. Citation2020; Dix et al. Citation2020). shows the location of CAVE (32.178 N, −104.443 W) with respect to active O&G wells (ArcGIS Citation2022) and several major roadways that connect the populated urban areas in Texas and New Mexico.
Figure 1. (a) Map of the Carlsbad Caverns National Park measurement site (CAVE, black square) with respect to major roads (gray lines), urban areas (orange outlines and text labels), and producing O&G wells (cyan dots) in NM and TX. Active drilling sites during the 2019 study period (purple diamonds) are also shown. (b) Expanded view of the red dashed area in (a) showing the locations of the Guadalupe Mountain National Park (GUMO), Carlsbad, NM city limits (CCLM), and Hobbs-Jefferson (HOBBS) O3 monitors (circular symbols) with respect to the CAVE site (black square). Monitoring sites are colored by the goodness of fit (r) from linear least squares regression of scatter plots of MDA8 O3 values at each site relative to those measured at the CAVE site (square) during the 2019 study period.
Hourly O3 has been measured at CAVE during the photochemically active months (April through September) for over a decade, and O3 has been regularly exceeding the 70 ppbv threshold every summer since 2018. However, observations of O3 precursors at this site are limited. A field campaign in 2017 measured abundances and composition of volatile organic compounds (VOCs) at CAVE (Benedict et al. Citation2020). The 2017 study analyzed measurements collected via canister samples several times per week and showed high mixing ratios of alkanes with strong contributions from O&G emissions to observed VOC levels. The total measured VOC mixing ratio was 7–10 times higher than at other National Parks in the southwestern U.S., largely due to high abundances of light alkanes. Benedict et al. (Citation2020) concluded that higher time resolution VOC measurements paired with nitrogen oxide (NOx = NO + NO2) observations would be needed to assess the impact of local and regional precursor emissions on the O3 impacting CAVE.
A follow up study, conducted at CAVE between July 25 and September 5 in 2019 included simultaneous measurements of O3, its key precursors NOx and VOCs, and related secondary species peroxyacetyl nitrate (PAN) and peroxypropionyl nitrate (PPN). The current paper utilizes these summer 2019 measurements to examine the empirical relationships between O3 and its precursors. This is one of three papers aimed at constraining the influence of regional O&G development on O3 formation. This current paper leverages a detailed description of a positive matrix factorization (PMF) analysis of non-methane VOC observations presented in Pan et al. (Citation2023) to apportion emission sources influencing CAVE. A forthcoming paper uses a box model to probe the underlying mechanisms for the observed empirical relationships presented in the current paper (Marsavin et al., Citation2023). Together these three studies aim to quantify the extent to which emissions from the Permian Basin and other upwind O&G production regions are responsible for the elevated O3 observed at CAVE.
Methods
Site description and meteorological conditions
Detailed information about the CAVE measurement site and the 2019 study can be found in Naimie et al. (Citation2022) who reported on fine particle concentrations in the park. Briefly, the CAVE measurement site is located 33 km southwest of the city of Carlsbad, NM (). It is also located on the western edge of the Permian O&G basin, ~700 km northwest of the Eagle Ford Basin, and ~700 km west of the Barnett Basin. Major roadways extending north-south connect the small urban areas of Roswell, Artesia, and Carlsbad, NM; roadways extending to the east provide access to Midland/Odessa, TX and the O&G production areas surrounding those urban areas.
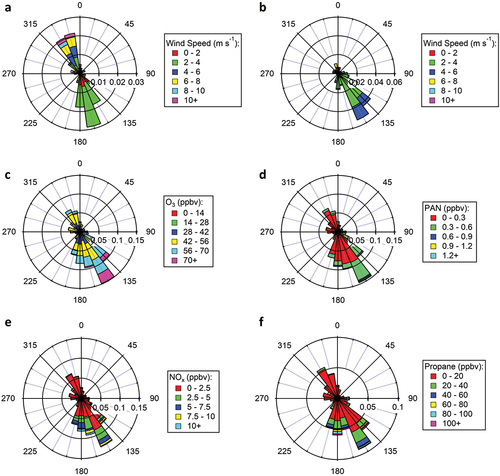
Meteorological parameters including wind speed, wind direction, relative humidity, temperature, solar radiation, and precipitation were measured at CAVE during the study period; instruments were operated and data were provided by the National Park Service (https://ard-request.air-resource.com/data.aspx). Instrumentation was positioned inside, or outside in the vicinity of, a historical building (the “biology” building) within the national park boundary. Instruments positioned inside the building had inlets positioned 1–2 m above the roofline of the building (roughly 6–7 m above ground level). A summary of the meteorological conditions at CAVE during the 2019 study period is shown in Figure S1 of the supporting information (SI). Briefly, ambient air temperature during the study period (July 25 to September 5, 2019) ranged from 19 to 40°C with a daytime (06:00–18:00 MDT) average of 30 ± 4°C and an afternoon (12:00–18:00 MDT) average of 33 ± 3°C. Relative humidity ranged from 9 to 48% during the daytime and 23 to 83% overnight. On average, relative humidity was 30 ± 14% in the daytime and 24 ± 9% during afternoons. During the study period, winds at CAVE are most frequent from the southeast wind sector with stronger, but less frequent, winds coming from the northwest. shows that winds are typically from the southeast wind sector, the direction of the Permian Basin, during peak photochemical times in the afternoon. Stronger winds from the northwest are frequently observed during mornings. Overnight, winds are mostly from the south and sometimes from the northwest.
Figure 2. Rose plots of (a) Winds in the morning between 06:00 and 10:00 MDT and (b) Winds during afternoon between 12:00 and 18:00 MDT as well as mixing ratios of (c) O3, (d) PAN, (e) NOx, and (f) Propane measured at the CAVE site throughout the 2019 study period. Roses are binned by wind direction every 15 degrees with 0° representing north. Axes represent the 0–1 probability in a given wind direction bin; colors represent the range of measured wind speeds and mixing ratios.
Atmospheric composition measurements
A comprehensive description of the trace gas and aerosol measurements collected at CAVE during the 2019 study period (July 25 to September 5) is available in Naimie et al. (Citation2022). Here, we describe the measurements utilized for this analysis, which include O3, methane (CH4), carbon monoxide (CO), nitrogen oxides including nitric oxide (NO), nitrogen dioxide (NO2), and total reactive nitrogen (NOy), a suite of non-methane volatile organic compounds (NMVOC), and APNs including PAN and PPN. All measurements used in this analysis are averaged to 1 hour, although instrument data collection rates varied from 1 second to 1 hour. Detailed descriptions of the instrumentation used to measure O3, APNs, NO, NO2, and NOy can be found in the SI. Briefly, O3 was measured by UV absorption using a Thermo Scientific Instruments model 49i analyzer. NO was measured via NO-O3 chemiluminescence detection using a commercial single-channel NO analyzer operating via NO-O3 chemiluminescence detection (EcoPhysics, model CLD 780 TR) and outfitted with custom chemically selective inlets for measuring NO, NO2 and NOy on a 20 s rotation. NO2 and NOy are converted to NO using custom-built inlets positioned at the inlet tip prior to chemiluminescence detection. NO2 is converted to NO using 395 nm LEDs for UV photolysis (Nussbaumer et al. Citation2021; Pollack, Lerner, and Ryerson Citation2010); reduction of NOy to NO uses a molybdenum converter heated to 320°C. The instrument is regularly calibrated with known mixtures of NO, NO2, and HNO3 (Neuman et al. Citation2003). PAN and PPN were measured every 10 minutes using a custom-built gas chromatography instrument employing a commercial electron capture detector. The detection technique is similar to that described in Flocke et al. (Citation2005) and the instrument configuration is similar to that described in Zaragoza et al. (Citation2017). CH4 was measured via cavity ringdown absorption spectroscopy using a Picarro model G2508 gas analyzer (Crosson Citation2008). CO was measured via non-dispersive infrared (NDIR) spectrophotometry using a Thermo Scientific Instruments model 48C analyzer. A suite of NMVOCs were measured using a custom online multi-channel gas chromatograph with flame ionization, electron capture, and mass spectrometric detection and a proton transfer mass spectrometer (PTR-MS) and are described in detail in Pan et al. (Citation2023).
Additional products utilized
Positive matrix factorization (PMF) is a widely used source apportionment method for analysis of speciated NMVOCs (e.g., Abeleira et al. Citation2017; Bon et al. Citation2011; Brown, Frankel, and Hafner Citation2007; Guha et al. Citation2015; Orak, Reeder, and Pekney Citation2021; Pollack et al. Citation2021; Yuan et al. Citation2012). Here we employ PMF findings from Pan et al. (Citation2023), who used the EPA PMF v5.0 model algorithm (Paatero Citation1997, Citation1999) for source apportionment of 47 speciated NMVOCs measured at CAVE during the 2019 study. Briefly, samples and uncertainties for the PMF analysis were prepared following the procedures outlined in Hopke (Citation2016) and Polissar et al. (Citation1998), and as described in Pollack et al. (Citation2021). For example, VOC measurements with mixing ratios above the corresponding method detection limit (MDL) were used directly as inputs, measurements with values below the MDL were replaced with the corresponding MDL divided by 3, and uncertainties were assigned as 5/6 times the corresponding MDL. A total of 47 species and 573 samples were included in the PMF analysis.
This work also utilizes O3 measurements from nearby EPA monitoring sites (US Environmental Protect Agency Citation2022). The map in shows the location of the CAVE site in relation to three other nearby sites, which include: 1) a monitoring site in Guadalupe Mountains National Park, TX (GUMO; 31.891°N, 104.810°W, 1,701 m AMSL) located ~50 km to the southwest of CAVE, 2) an urban scale monitoring site within the Carlsbad, NM city limit (CCLM; 32.380°N, 104.262°W, 975 m AMSL) located ~30 km to the northeast of CAVE, and 3) the Hobbs-Jefferson neighborhood scale site in Hobbs, NM (HOBBS; 32.727°N, 103.122°W, 1,110 m AMSL) located 140 km northeast of CAVE. A comparison of O3 observations from all four sites during the study period and an historical account of O3 at CAVE and CCLM from January 1, 2015 to December 31, 2022 are presented in the next section.
Results and discussion
High O3 days at CAVE
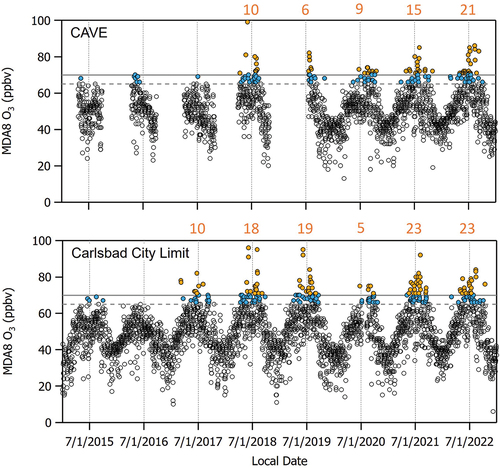
The maximum daily 8-hour average (MDA8) O3 mixing ratios at CAVE began to regularly exceed 70 ppbv in 2018 (). Exceedances of the National Ambient Air Quality Standard (NAAQS) occur when the 3-year average of the fourth highest annual MDA8 exceeds 70 ppbv. There were 10 days at CAVE between April and August in 2018 and at least 6 days in July and August in 2019 when MDA8 O3 > 70 ppbv. Table S1 summarizes the dates when elevated O3 was observed. Although not shown here, we also note that O3 has been regularly exceeding the 70 ppbv threshold every summer since 2019. Since there are no measurements of O3 at the CAVE site between October 31, 2018 and July 18, 2019 when the O3 instrument was relocated to a different building within the park, we use the more continuous data record of O3 measurements from the nearby CCLM site for supporting context. In comparison to CAVE, a total of 19 days with MDA8 O3 > 70 ppbv were measured at CCLM in 2019. Even though the CAVE site historically experiences fewer days with MDA8 O3 > 70 ppbv than the CCLM site (e.g., 10 compared to 18 days in 2018), it is likely that there were > 6 days with high O3 at the CAVE site during the instrument relocation period in 2019.
Figure 3. MDA8 O3 measured at the CAVE and CCLM sites between January 1, 2015 and December 31, 2022 (open symbols). The current NAAQS for O3 of 70 ppbv and a threshold of 65 ppbv also utilized in this work are denoted by the solid and dashed horizontal gray lines, respectively. Colored symbols indicate the number of days in each year with MDA8 O3 > 70 ppbv (orange) and 65 < MDA8 O3 ≤ 70 ppbv (blue). Note that the ticks on the x-axis and the corresponding vertical dashed lines indicate the middle of summer (i.e., July 1st) for each year, and numbers in orange font represent the number of days when MDA8 O3 > 70 ppbv for each year. Measurements at CAVE are only available during the summer months; a gap in the measurements between November 1, 2018 and July 18, 2019 indicates when the CAVE O3 monitor was moved to a different location within the park.
O3 measurements at CAVE are positively correlated with O3 measurements at three other EPA monitoring sites in the nearby vicinity: CCLM, GUMO, and HOBBS. The sites in are colored by the correlation coefficient (r) of the relationship between MDA8 O3 at each site versus MDA8 O3 at CAVE for the duration of the 2019 study period. We find r = 0.90 for the GUMO and CCLM sites, and r = 0.76 for the HOBBS site. Thus, we expect that many O3-related findings based on data from the GUMO and CCLM sites will apply to the CAVE site and vice versa.
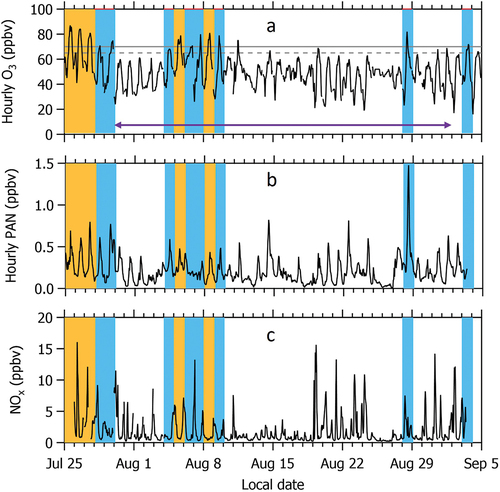
shows that there are five days with MDA8 O3 > 70 ppbv and eight days when MDA8 O3 is between 65 and 70 ppbv at CAVE during the 2019 study period. However, NMVOC measurements are only consistently available during the study period between July 30 - September 2. Therefore, for the parts of this analysis that utilize O3, PAN, and NOx measurements, we define high O3 days as the 13 days when MDA8 O3 > 65 ppbv. For the parts of the analysis that utilize NMVOCs, including the PMF analysis, we consider only the 7 days when MDA8 O3 > 65 ppbv that overlap with the NMVOC measurements. A threshold of 65 ppbv represents a level that may be considered for a future O3 NAAQS.
Figure 4. Time series of hourly (a) O3, (b) PAN, and (c) NOx measured at CAVE during the study period between July 25 and September 5, 2019. Five days with MDA8 O3 > 70 ppbv are highlighted by the orange shaded bars. Eight days when 65 < MDA8 O3 ≤ 70 ppbv are highlighted by the blue shaded bars. In panel (a), the 70 ppbv NAAQS for O3 and a threshold of 65 ppbv also utilized in this work are denoted by the solid and dashed horizontal gray lines, respectively, and purple arrow indicates the date range when NMVOC measurements are available.
The influence of smoke on high O3 days
O3 abundances measured on days impacted by wildfire smoke can be higher than on smoke-free days (e.g., Brey and Fischer Citation2016; Buysse et al. Citation2019; Lindaas et al. Citation2017). While none of the MDA8 O3 measurements acquired from the EPA dataset during the study period were flagged as influenced by wildfire smoke or as an exceptional event, such as a stratospheric intrusion, we followed the procedures outlined in Brey and Fischer (Citation2016) and supplement these criteria with acetonitrile (CH3CN), a common fire tracer among the suite of NMVOCs measured at CAVE, to identify periods impacted by wildfire smoke (Huangfu et al. Citation2021 and references within). We find two days during the 2019 study period (July 30 and August 29) where Hazard Mapping System (HMS) smoke polygons overlapped with the CAVE site. We find that CH3CN and PM2.5 are slightly elevated (greater than 1-sigma above the study average) on July 30, but this is not a high O3 day. August 29 is also a day with an HMS smoke plume in the atmospheric column; however, it is not a high O3 day and fire tracers are not elevated. Although there is no HMS overlap on August 28, this day exhibits elevated CH3CN and PM2.5 at the surface, and it is a high O3 day. However, enhancement ratios of CH3CN to CO throughout the study period do not indicate biomass burning (Huangfu et al. Citation2021), and concentrations of black carbon and PM2.5 levoglucosan (an aerosol smoke tracer) were not enhanced above the study average at the CAVE site, as reported by Naimie et al. (Citation2022). We also note that August 27 and 28 exhibited substantially different meteorology (cooler temperatures and higher relative humidity) compared to other days in the study period. Elevated wind speeds and a shift in wind direction between Aug 26 and 27 indicate a change in weather front that brought aerosols to the measurement site (e.g., water soluble organic carbon was elevated during this 2-day period with aerosols largely composed of ammonium and sulfate; Naimie et al. Citation2022). Aerosol Optical Depth (AOD) from VIIRS aboard Suomi NPP and MODIS was also higher on August 28 compared to August 29 over the CAVE site. Therefore, we conclude that none of the high O3 days observed during the 2019 study period were impacted by wildfire smoke. Although, one of the days (August 28) exhibited larger than average aerosol concentrations.
Ozone precursor source attributions
According to wind sector
Winds frequently move emissions from the Permian O&G Basin to the CAVE site, while stronger, but less frequent, winds from the northwest typically bring cleaner air. Wind roses of 2019 measurements of NOx and propane (C3H8), a common O&G tracer, shown in support this statement. Measurements of CH4, CO, and select NMVOCs show similar wind profiles (e.g., Figure S2). The highest NOx and NMVOC mixing ratios measured at CAVE during the study period are observed when winds are from the southeast, the direction of the Permian Basin. Propane, for instance, is substantially elevated at CAVE. Figure S3 shows that the mean mixing ratio for propane at CAVE during the study period is more than 2 times higher than the mean mixing ratios observed for propane at other O&G impacted areas in the U.S. during summer (e.g., Abeleira et al. Citation2017; Baker et al. Citation2008; Gilman et al. Citation2013; Pollack et al. Citation2021; Tzompa-Sosa et al. Citation2017). Diel profiles of common tracer and precursor species (e.g., Figures S4 and S5) exhibit similar temporal patterns with maximum mixing ratios occurring between 05:00 and 10:00 MDT and minimum mixing ratios occurring during peak photochemical production times in the afternoon. CO is variable with no discernable pattern (e.g., Figure S4). Isoprene, which is typically associated with biogenic emissions, peaks during midday (e.g., Figure S5).
These observations are consistent with prior works that show O&G activities in the Permian Basin are a major source of VOC and NOx precursors in this region (e.g., Benedict et al. Citation2020; Naimie et al. Citation2022). Benedict et al. (Citation2020) used back-trajectories to demonstrate that the source of elevated VOCs at CAVE, as well as that of the highest levels of observed O3, was from the southeast, where the most extensive O&G development activities are located. When winds were from the southeast, they found ≤ C5 alkanes comprised >90% of the VOC concentration in canister samples and that these ≤ C5 alkanes contributed >80% to OH reactivity. Naimie et al. (Citation2022) used back trajectories to show that air masses originating from the Permian Basin often impacted the CAVE site during the 2019 study period and used incremental probability distributions to show that the highest concentrations of select trace gas and aerosol species were strongly associated with transport from the southeast wind sector.
Via tracer-tracer correlations
The i/n-pentane ratio is a robust indicator of the influence of emissions from O&G operations compared to fossil fuel combustion (Gilman et al. Citation2013). Ratios below 1 ppbv ppbv−1 are typically associated with O&G activities, ratios approaching 2 are generally indicative of emissions from fossil fuel combustion, and ratios between 1 and 2 are indicative of a mixture of sources (Gilman et al. Citation2013). The i/n-pentane ratio at CAVE is <1 ppbv ppbv−1 and tightly correlated (r2 = 0.99) indicating that the CAVE site is strongly and regularly influenced by O&G emissions throughout the study period (Benedict et al. Citation2020; Pan et al. Citation2023). The tight correlation further suggests that this area is uniquely impacted by emissions associated with O&G activities.
Strong correlations between NOx and C1–C3 alkanes, which are commonly associated with O&G production activities (r2 > 0.64, ) indicate that the primary source of NOx in this region is associated with O&G production activities and not with other local anthropogenic sources such as highway vehicle emissions. A weak correlation with CO (r2 = 0.11 for correlation with NOx and r2 = 0.06 for correlation with NOy), suggests that urban sources are not a predominant contributor to NOx measured at the CAVE site. The nearest city is Carlsbad, NM, which is located 33 km northeast of the CAVE site (), and winds typically do not bring emissions from the northeast wind sector (). There are also no notable weekday-weekend differences in NOx measured at CAVE that could be associated with urban traffic patterns. This is consistent with the findings of Dix et al (Citation2020, Citation2022) and Francoeur et al. (Citation2021) who show that NOx emissions from O&G production in the Permian Basin are a dominant and growing source of NOx in this region, and that NOx emissions from O&G are largely associated with the drilling, production, and flaring phases of O&G development.
Figure 5. Scatter plots of (a) Methane, (b) Ethane, (c) Propane, and (d) CO versus NOx.
By association with PMF factors
Pan et al. (Citation2023) used PMF to identify seven source factors influencing the CAVE measurement site during the 2019 study period. Of the seven source factors, three were associated with emissions from O&G activity, two were related to secondary chemical production, one was associated with C2–C4 alkenes, and one was associated with regional background. Factor profiles showed that, of the three factors associated with O&G activity, one is predominantly composed of longer-lived species such as C2–C7 alkanes, one is composed of shorter-lived species including C7–C9 alkanes, and one is associated with process specific emissions from O&G and includes C9–C10 alkanes, ethylbenzene, and xylenes. The two secondary factors were split into shorter-lived and longer-lived species. The shorter-lived factor is largely composed of C5 alkyl nitrates and the longer-lived factor is largely composed of C1–C4 alkyl nitrates and oxygenated VOCs (OVOCs). Pan et al. (Citation2023) associated the factor dominated by C2–C4 alkenes to a mixture of sources. The background factor largely consisted of halogenated species, acetonitrile, and isoprene.
Pan et al. (Citation2023) showed that the contributions from the three O&G factors correlated well with each other and with CH4. They also showed that the contributions from these factors are largely associated with winds from the southeast sector. Here, we show that the diel profile of NOx is similar to that of the sum of the three primary O&G factor contributions () and CH4 (Figure S4). shows that all three primary O&G factors correlate well with NOx (r2 ranges from 0.51 to 0.76). These associations provide additional evidence that nearby O&G activities are a substantial source of NOx as well as VOCs at CAVE.
Figure 6. Diel profiles of (a) NOx, (b) O3, and (c) PAN measured at the CAVE site during the 2019 study period and (d) the sum of the three O&G factor contributions associated with primary emissions, (e) The longer-lived secondary factor contribution, and (f) the short-lived secondary factor contribution determined from the PMF analysis. Gray shaded areas demonstrate time periods when pollutant/precursor mixing ratios and PMF factor contributions are at a maximum.
Figure 7. (a–c) Scatter plots of NOx versus the individual PMF factor contributions associated with primary O&G missions. Scatter plots of (d) NOx versus the sum of the three factor contributions associated with primary O&G emissions (e) O3 versus a longer-lived secondary PMF factor contribution, and (f) PAN versus a shorter-lived secondary PMF factor contribution.
High ozone day precursor contributions
Diel profiles () and correlations () of the PMF factor contributions with O3 and PAN elucidate relationships between source factors and secondary pollutants. Diel profiles for the longer-lived and shorter-lived secondary factor contributions () show peak production occurring at the same time as O3 and PAN, respectively. show secondary factor contributions are reasonably well correlated with PAN (average r2 = 0.48) and O3 (r2 < 0.35). We postulate that the C1–C4 alkyl nitrates and OVOCs associated with the longer-lived secondary factor may arise from photochemical processing of the light alkanes associated with the longer-lived O&G primary emissions factor.
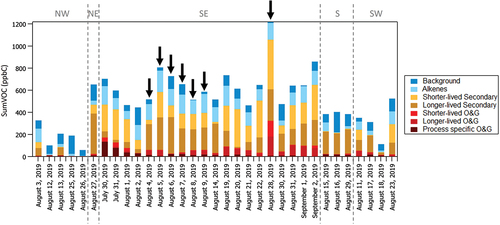
shows the average PMF factor contributions during peak photochemical production times to the sum of total measured VOC (sumVOC; units of ppbC). On average, sumVOC is a factor of 2 larger on days when winds are from the southeast (N = 20 days) compared to days associated with the other wind sectors (N = 13 days). Factor contributions from O&G (shown as shades of red in ) are also, on average, 7% greater on days when winds are from the southeast. highlights that the seven high O3 days (black arrows) during the study period, when NMVOC measurements are available, are also associated with the southeast wind sector. The day with the largest sumVOC and when MDA8 O3 > 65 ppbv (August 28, 2019) coincides with the maximum PAN mixing ratio during the study period (PAN = 1.5 ppbv). Contributions from longer-lived and shorter-lived secondary PMF factors are both enhanced on this day (shades of orange in ). Back trajectories for this day also show transport largely from the Permian O&G Basin within a 12–24 hour period at altitudes <50 m AGL (e.g., Naimie et al. Citation2022) providing additional evidence that emissions from O&G sources were a major contributor to O3 and PAN formation on this day.
Figure 8. Average PMF factor contributions to sumVOC in units of ppbC (colored bars). Days during the 2019 study period are grouped by wind sector (denoted by the vertical dashed lines) according to the average wind direction (denoted by the wind sector labels) during peak photochemical production (12:00 to 18:00 MDT). Dates are ordered chronologically within each wind sector. Black arrows denote the 7 days when NMVOC measurements are available and MDA8 O3 > 65 ppbv. The high O3 day on August 28, 2019 also exhibited the highest observed mixing ratio of PAN (1.5 ppbv) throughout the study period.
A back trajectory analysis of the factor contributions in Pan et al. (Citation2023) shows that on average throughout the study period the longer-lived secondary factor largely originates from the southeast but has some probability of originating from the large concentration of O&G activities located to the northeast. Figure S6 depicts the individual 48-hour back trajectories for each day when MDA8 O3 > 65 ppbv. The individual trajectories show that the majority of the high O3 days originate from the Permian Basin and other O&G basins located to the east and southeast. The trajectories overpass areas to the northeast of the measurement site on two of these days (August 4 and August 5). The air mass reaching CAVE on August 5 passed over an area to the northeast and then arrived at the site from the east immediately overpassing the Permian Basin. Thus, while there may be some contribution from emissions of O3 precursors located to the northeast of CAVE, the majority of high O3 days are associated with air masses originating from the O&G basins located to the east and southeast of the CAVE site.
On average, the seven high O3 days exhibit 17% more contribution from the longer-lived secondary factor (Figure S7). This indicates that the air masses reaching CAVE on high O3 days are more photochemically processed on average compared to non-high O3 days when the winds are from the southeast. Photochemical clocks using ratios of 2-pentyl nitrate (2-PenONO2)/n-pentane and 2-butyl nitrate (2-BuONO2)/n-butane are presented in Pan et al. (Citation2023), where the NMVOC dataset is described in detail. The photochemical clock analysis suggests that most of the alkanes observed at CAVE have undergone photochemical processing for less than one or two days.
Empirical indicators of ozone production regime and efficiency
VOC-to-NOx ratio
Determining the O3 formation regime of a study area can be a useful metric for contextualizing regional O3 photochemistry. In some locations, regional O3 formation can be classified as VOC-limited or NOx-limited, and the ratio of VOCs to NOx can be used as an indicator of O3 sensitivity (Seinfeld Citation1989; Sillman Citation1999). One approach uses the VOC-to-NOx ratio (denoted here as VOC:NOx) to gauge O3 sensitivity (Sillman Citation1999). In this simple rule, VOC:NOx ratios greater than 20:1 ppbC ppbv−1 are associated with NOx-limited O3 production and ratios less than 10:1 ppbC ppbv−1 are associated with VOC-limited production (Seinfeld Citation1989; Sillman Citation1999). However, this metric is typically applied to urban VOC mixtures. Other reports identify the boundary between VOC-limited and NOx-limited regimes as VOC:NOx ratios between 8 and 10 ppbC ppbv−1 with VOC-limited production being associated with ratios less than 4:1 ppbC ppbv−1 (Akimoto and Tanimoto Citation2022 and references within). depicts a scatter plot of sumVOC (in units of ppbC) versus NOx (in units of ppbv) measured at CAVE during the 2019 study period. An orthogonal distance regression results in a slope of 85 ± 2 ppbC ppbv−1 indicating a VOC:NOx ratio that is substantially greater than 20:1 ppbC ppbv−1 and suggesting that O3 production at CAVE is NOx-limited. The data points are tightly correlated (r2 = 0.77) and the VOC:NOx ratio is consistently greater than 20:1 ppbC ppbv−1 during different times of the day with VOC:NOx ratios exceeding 100:1 ppbC ppbv−1 during peak photochemical production in the afternoon, generally consistent with NOx limited production during this part of the day.
Figure 9. Scatter plots of (a) SumVOC versus NOx, (b) Reactivity-weighted sumVOC versus NOx, and (c) O3 versus NOy-NOx. Gray data points in each plot represent N = 705 hourly averaged data points from the entire 2019 study period. Black outlined symbols represent data points collected during non-peak photochemical production times between 06:00–12:00 MDT in plots (a) and (b) and peak photochemical production times between 12:00–18:00 MDT in plot (c). Solid orange symbols represent a subset of the black outlined data points that are associated with the southeast wind sector. In plots (a) and (b), the solid black line represents a linear least squares orthogonal distance regression of the data points. The range of the y-axis is an order of magnitude less in plot (b) than plot (a). In plots (a) and (c), gray dashed lines denote the O3 sensitivity thresholds reported in Sillman (Citation1995, Citation1999).
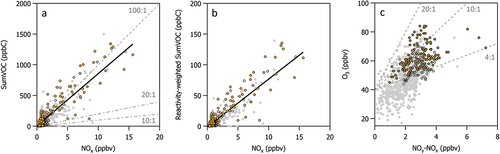
There are several caveats to this simple VOC:NOx ratio rule. One is that the sumVOC calculated in this analysis does not include a comprehensive account of all NMVOC species present in the atmosphere. Thus, sumVOC tends to be an underestimate. However, the VOC:NOx ratio at CAVE, even as an underestimate, is already well above the threshold for NOx-limited production, and thus including additional NMVOC species in sumVOC would push the ratio farther into the NOx-limited regime. Another caveat is that the boundaries between production regimes defined here are typically associated with urban, polluted regions (Sillman Citation1999), which may not be fully representative of the environmental conditions at the CAVE measurement site. A third caveat is that this rule does not account for the impact of several key factors including VOC reactivity, the influence of biogenic species, temporal and geographical variability, changes in meteorology, and photochemical aging (Sillman Citation1999). The dominance of light alkane species at CAVE may yield lower VOC reactivities on a per molecule basis than in other, more urban environments. Here, we consider reactivity with the hydroxyl radical (OH) using a method developed by Chameides et al. (Citation1992), where sumVOC is reactivity-weighted according to “propene-equivalent carbon”. The calculation is reproduced from Chameides (Chameides et al. Citation1992) and summarized in EquationEq. (1)(1)
(1) .
In the equation, C(PE) represents the propene-equivalent sumVOC concentration and C(j) is the mixing ratio of species j in units of ppbC of 54 NMVOC species collected at CAVE during the 2019 study period. kOH(j) represents the rate constant for the reaction between species j and OH and kOH(propene) represents the rate constant for the reaction between propene and OH in units of cm3 molecule−1 s−1 from Atkinson and Arey (Citation2003) and Atkinson (Citation1986). shows a scatter plot of sumVOC (in units of reactivity-weighted ppbC) versus NOx (in units of ppbv). We find that the reactivity-weighted sumVOC is roughly an order of magnitude less than not reactivity-weighted sumVOC, and that the reactivity-weighted VOC:NOx relationship results in a slope of 8.8 ± 0.2 ppbC ppbv−1. As noted by Sillman (Citation1999), no simple rule has been established that would relate reactivity-weighted VOC:NOx ratios with predicted NOx-VOC sensitivity; however, the relationship remains tightly correlated (r2 = 0.79) reinforcing our finding that the O3-production sensitivity regime is consistent at CAVE throughout the study period. We note that weighting the reactivity-weighted and not reactivity-weighted regressions by the measurement uncertainties (i.e., an average uncertainty of 7% for sumVOC and a propagated uncertainty of 11% for NOx) further increases the slopes.
O3 production sensitivity and O3 production efficiency
Another approach for approximating O3 production sensitivity uses the ratio of O3 to (NOy-NOx) to indicate NOx-limited, or NOx-sensitive, conditions (Sillman Citation1995, Citation1999). shows the relationship of O3 to (NOy-NOx) at CAVE during the 2019 study period. O3 and (NOy-NOx) are not well correlated during the entire 2019 study period (r2 < 0.40) nor during peak photochemical production times (12:00–18:00 MDT) (r2 < 0.20). The relationship of odd oxygen (Ox = O3 + NO2) versus (NOy-NOx) shows similar results since NO2 during afternoons is <2 ppbv. An indicator ratio established by Sillman (Citation1995) signifies NOx-limited O3 production when (O3-40 ppbv):(NOy-NOx) is > 4 ppbv ppbv−1 and NOx-sensitive O3 production when (O3-40 ppbv):(NOy-NOx) < 4 ppbv ppbv−1. The O3 background mixing ratio during peak photochemical production times is assumed to be 40 ppbv in this established indicator ratio, and this is likely close to the actual O3 background at CAVE during the 2019 study period (e.g., an average minimum O3 of 38 ppbv is observed in the diel profile in between 12:00 and 18:00 MDT). Guidelines for a few ratios are superimposed on . The data points are largely above the 4:1 threshold indicating NOx-limited production dominates photochemistry. Less than 10% of the data points fall below this threshold, and they are not associated with the southeast wind sector. Including a 5% measurement uncertainty for O3 and a 19% propagated measurement uncertainty on (NOy-NOx) in results in a few more data points falling below this threshold (up to 12% total), but not enough to change the overall assessment that the study area is predominantly NOx-limited.
The relationship in is also often used to quantify O3 production efficiency (OPE), where the slope of an orthogonal distance regression of O3 versus (NOy-NOx) is used to approximate the number of molecules of O3 produced per molecule of NOx oxidized (Trainer et al. Citation1993). However, the data points in are not well correlated, and thus caution should be taken when interpreting the slope from this relationship. Instead, we utilize a histogram of the point-by-point ratio of hourly O3 to hourly (NOy-NOx) (Figure S8) to highlight that the most frequently observed ratio is 20 ± 4 ppbv ppbv−1, where the error bar reflects the 1-sigma propagated uncertainties of the measurements. This ratio is substantially larger than the typical reported range for urban regions in the U.S (McDuffie et al. Citation2016 and references within).
A caveat to the above methods is that NOy species can be lost via deposition between the time of emission/production and sampling (Neuman et al. Citation2009; Trainer et al. Citation1993). However, we observed little change in the ratio of NOy to CO, a long-lived tracer, during the daytime (between 06:00 and 18:00 MDT) throughout the study period (e.g., Figure S10) indicating minimal loss in NOy species.
The relationship between PAN and O3
PAN is a well-established tracer of photochemistry, but its lifetime is strongly impacted by temperature. When enhanced above background values, PAN indicates the production of secondary pollutants. O3 and PAN are often formed by the same chain of chemical reactions in the troposphere between NOx and VOCs in the presence of sunlight. PAN serves as a thermally sensitive temporary reservoir for NOx radicals (Fischer et al. Citation2014). shows that PAN is often elevated at CAVE when O3 is elevated, but the PAN to O3 ratio varies. Elevated mixing ratios of PAN are well correlated with high O3 days during the first week of the study period. However, PAN and O3 are less well correlated during the middle of the study (e.g., there are a few cases where elevated PAN is observed without elevated O3). Diel profiles show the abundance of each of these secondary pollutants peaks during afternoons () with O3 production peaking between 12:00 and 18:00 MDT and a maximum in PAN occurring around 12:00 MDT. Increasing O3 is generally correlated with increasing temperature (Camalier, Cox, and Dolwick Citation2007), and this is consistent with the CAVE observations (e.g., Figure S11). The average afternoon temperature was 32°C on days when MDA8 O3 > 70 ppbv; at this temperature and the NO2/NO ratios characteristic of CAVE during our study period, the effective lifetime of PAN is ~1 hour.
The relationship between PPN and PAN
PPN:PAN ratios indicate the source character of the VOCs that dominate chemical production of PAN (Roberts et al. Citation1998, Citation2002, Citation2003). PPN:PAN ratios < 0.15 ppbv ppbv−1 are often associated with photochemistry dominated by biogenic VOC emissions and PPN:PAN ratios > 0.15 ppbv ppbv−1 are often observed in urban areas where anthropogenic VOCs dominate the photochemistry (Roberts et al. Citation1998, Citation2002, Citation2003). Higher ratios (> 0.2 ppbv ppbv−1) have recently been observed in regions where alkanes comprise a large fraction of OH reactivity (Lindaas et al. Citation2019; Zaragoza et al. Citation2017).
shows that PPN and PAN are tightly correlated (r2 = 0.87) with a PPN:PAN ratio of 0.250 ± 0.003 ppbv ppbv−1 determined from an orthogonal distance regression (ODR). A histogram of the observations (e.g., ) illustrates that a PPN:PAN ratio of 0.25 ppbv ppbv−1 is most frequently observed at the measurement site consistent with other regions with alkane rich photochemistry. Less than 5% of the data points had PPN:PAN ratios < 0.15 ppbv ppbv−1 consistent with the relatively low isoprene emissions of this desert region The highest PPN:PAN ratios are most frequently observed when winds are from the southeast.
Figure 10. (a) Hourly measurements of PPN versus PAN during the entire study period (gray symbols) and when the wind is from the southeast sector (orange). An orthogonal distance regression (ODR) of the data points is shown as a solid black line. Dashed gray lines indicate a range of possible PPN:PAN ratios discussed below. (b) Histogram of hourly averaged PPN:PAN ratios.
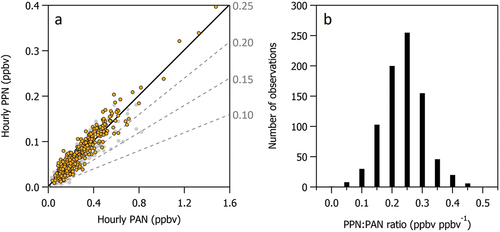
The high PPN:PAN ratio at CAVE likely reflects the high propane abundances. While nearly any VOC can serve as a precursor for PAN, propanal is the immediate precursor for PPN. Propane oxidation produces propanal at a high (0.28) yield (Atkinson, Tuazon, and Carter Citation1985; Droege and Tully Citation1986; Roberts Citation2007; Roberts et al. Citation2001). The PPN:PAN ratio at CAVE is higher than recent observations in the Colorado Front Range where urban and O&G emissions mix. Zaragoza et al. (Citation2017) measured PANs during summer 2014 at a ground-based field site located at the base of the Boulder Atmospheric Observatory in Erie, Colorado (decommissioned in 2016). They found PPN and PAN were strongly correlated (r2 = 0.92) throughout the duration of the field campaign. Using a reduced major axis regression analysis, they determined a PPN:PAN ratio of 0.21 ppbv ppbv−1 for the entire campaign and PPN:PAN ratios >0.20 ppbv ppbv−1 during the most elevated PAN periods. In a separate field campaign in July and September of 2015, Lindaas et al. (Citation2019) measured APNs at the Boulder Atmospheric Observatory and found PPN:PAN ratios ranging from 0.07 to 0.20 ppbv ppbv−1. They showed that high PPN:PAN ratios correlated with a larger contribution of VOCs associated with O&G emissions and secondary species, whereas low PPN:PAN ratios (<0.15 ppbv ppbv−1) were more closely correlated with VOCs associated with biogenic emissions.
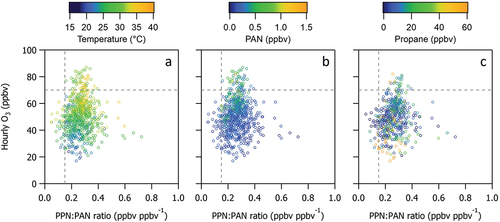
shows that all CAVE hourly O3 mixing ratios > 70 ppbv are coincident with PPN:PAN ratios > 0.15 ppbv ppbv−1. All but two hourly periods with O3 > 70 ppbv, are associated with coincident PPN:PAN ratios > 0.20 ppbv ppbv−1. shows that the most frequently observed PPN:PAN ratio of 0.25 ppbv ppbv−1 is associated with enhanced propane, although enhanced propane is not always associated with elevated O3.
Figure 11. Scatter plots of hourly O3 versus PPN:PAN ratio. Data points are colored by (a) temperature, (b) PAN, and (c) propane.
Conclusion
Since 2018, O3 at CAVE has been regularly exceeding the 70 ppbv 8-hour NAAQS. During the summer 2019 study period, there were 13 high O3 days at the CAVE site, and 7 of these high O3 days overlapped with when there were NMVOC measurements. High O3 days are associated with winds from the southeast sector. Winds are effective at transporting precursor emissions from the Permian Basin and potentially other upwind O&G basins to CAVE. Elevated mixing ratios of NOx and NMVOCs are also frequently observed when winds are from the southeast sector. While the Permian Basin is the closest O&G basin to CAVE, given the predominant wind directions, it is possible that emissions from other O&G basins in this area also contribute to the observed composition at CAVE. NOx and NMVOCs precursors are also largely associated with the O&G sector via tracer-tracer correlations and by association with factor contributions from a PMF analysis. High O3 days also show a larger contribution from the PMF longer-lived secondary factor indicating more photochemical processing on high O3 days compared to other days with winds from the southeast wind sector. The VOC:NOx ratio at CAVE is high and tightly correlated indicating that the area is predominantly NOx-limited throughout the day. Indicator ratios of O3/(NOy-NOx) and Ox/(NOy-NOx) support NOx-limited O3 production at CAVE. A PPN:PAN ratio > 0.15 ppbv ppbv−1 also provides evidence that light alkanes from O&G production influence photochemistry at CAVE.
The results above indicate NOx-limited photochemistry at CAVE indicating that reductions in NOx emissions should drive reductions in O3. However, caution should be taken when using VOC:NOx ratios in O3 sensitivity analyses for policy-making discussions (Akimoto and Tanimoto Citation2022 and references within). Interpretations based on a combination of observations and modeling should be considered when making policy-relevant decisions for CAVE, and those analyses are forthcoming. Thus, simultaneous reductions in emissions of NOx and NMVOCs from the O&G sector should be considered for reducing O3 at CAVE. Reductions in NMVOCs will have the added benefit of reducing formation of other secondary pollutants, like APNs, and other air toxics, such as those on the EPA’s list of hazardous air pollutants (Garcia-Gonzales et al. Citation2019 and references within).
CAVE paper_SI_Revision1.docx
Download MS Word (2.3 MB)Acknowledgment
We thank the Carlsbad Caverns National Park staff and scientists for their support with project logistics. We also thank Kimberley Corwin and Bonne Ford for assistance with determining the HMS smoke polygon overlap with the CAVE site.
Disclosure statement
No potential conflict of interest was reported by the author(s).
Data availability statement
The data that support the findings of this study are openly available in a public repository entitled, Carlsbad Caverns National Park Air Quality Study 2019, and is available at https://doi.org/10.25675/10217/235481.
Supplementary data
Supplemental data for this paper can be accessed online at https://doi.org/10.1080/10962247.2023.2271436.
Additional information
Funding
Notes on contributors
Ilana B. Pollack
Ilana B. Pollack is a Research Scientist III in Atmospheric Science at Colorado State University.
Da Pan
Da Pan is a Research Scientist I in Atmospheric Science at Colorado State University.
Andrey Marsavin
Andrey Marsavin is a Ph.D. student at Colorado State University in Atmospheric Science.
Elana J. Cope
Elana J. Cope is a Ph.D. student at the University of Oregon in Chemistry, and was an undergraduate student at Colorado State University during the 2019 field study.
Julieta Juncosa Calahorrano
Julieta Juncosa Calahorrano is a Ph.D. student at Colorado State University in Atmospheric Science.
L. Naimie
L. Naimie is a Ph.D. student at Colorado State University in Atmospheric Science.
K. B. Benedict
K. B. Benedict is a Research Scientist at Los Alamos National Laboratory. Dr. Benedict was a Research Scientist in Atmospheric Science at Colorado State University during the 2019 field study.
Amy P. Sullivan
Amy P. Sullivan is a Research Scientist III in Atmospheric Science at Colorado State University.
Y. Zhou
Y. Zhou is a Research Scientist II in Atmospheric Science at Colorado State University.
B. C. Sive
B. C. Sive is an atmospheric chemist in the Air Resources Division of the National Park Service. Dr. Sive serves as the Program Manager for the Gaseous Pollutant Monitoring Program (GPMP).
Anthony J. Prenni
Anthony J. Prenni is a Chemist in the Air Resources Division of the National Park Service.
Bret A. Schichtel
Bret A. Schichtel is a Research Physical Scientist in the Air Resource Division of the National Park Service and an affiliate with the Cooperative Institute for Research in the Atmosphere at Colorado State University.
Jeffrey Collett
Jeffrey Collett, Jr. is a Professor of Atmospheric Science at Colorado State University.
Emily V. Fischer
Emily V. Fischer is a Professor of Atmospheric Science at Colorado State University.
References
- Abeleira, A., I.B. Pollack, B. Sive, Y. Zhou, E.V. Fischer, and D.K. Farmer. 2017. Source characterization of volatile organic compounds in the Colorado Northern front range Metropolitan area during spring and summer 2015. J. Geophys. Res. 122 (6):3595–613. doi:10.1002/2016JD026227.
- Ahmadi, M., and K. John. 2015. Statistical evaluation of the impact of shale gas activities on ozone pollution in North Texas. Sci. Total Environ. 536:457–67. doi:10.1016/j.scitotenv.2015.06.114.
- Akimoto, H., and H. Tanimoto. 2022. Rethinking of the adverse effects of NOx-control on the reduction of methane and tropospheric ozone – Challenges toward a denitrified society. Atmos. Environ. 277:119033. doi:10.1016/j.atmosenv.2022.119033.
- ArcGIS. 2022 Oil and natural gas wells for the Homeland Infrastructure Foundation-Level (HIFLD) [Internet Database]. Data Source: Oak Ridge National Laboratory. Data Host: Homeland Infrastructure Foundation-Level Data. Accessed November 14, 2022. https://hifld-geoplatform.opendata.arcgis.com/datasets/geoplatform:oil-and-natural-gas-wells/about.
- Atkinson, R. 1986. Kinetics and mechanisms of the gas-phase reactions of the hydroxyl radical with organic compounds under atmospheric conditions. Chem. Rev. 86 (1):69–201. doi:10.1021/cr00071a004.
- Atkinson, R., and J. Arey. 2003. Atmospheric degradation of volatile organic compounds. Chem. Rev. 103 (12):4605–38. doi:10.1021/cr0206420.
- Atkinson, R., E.C. Tuazon, and W.P.L. Carter. 1985. Extent of H-atom abstraction from the reaction of the OH radical with 1-butene under atmospheric conditions. Int. J. Chem. Kinet. 17 (7):725–34. doi:10.1002/kin.550170703.
- Baker, A.K., A.J. Beyersdorf, L.A. Doezema, A. Katzenstein, S. Meinardi, I.J. Simpson, D.R. Blake, and F. Sherwood Rowland. 2008. Measurements of nonmethane hydrocarbons in 28 United States cities. Atmos. Environ. 42 (1):170–82. doi:10.1016/j.atmosenv.2007.09.007.
- Benedict, K.B., A.J. Prenni, M.M. H. El-Sayed, A. Hecobian, Y. Zhou, K.A. Gebhart, B.C. Sive, B.A. Schichtel, and J.L. Collett. 2020. Volatile organic compounds and ozone at four national parks in the southwestern United States. Atmos. Environ. 239:117783. doi:10.1016/j.atmosenv.2020.117783.
- Bon, D.M., I.M. Ulbrich, J.A. de Gouw, C. Warneke, W.C. Kuster, M.L. Alexander, A. Baker, A.J. Beyersdorf, D. Blake, R. Fall, et al. 2011. Measurements of volatile organic compounds at a suburban ground site (T1) in Mexico City during the MILAGRO 2006 campaign: Measurement comparison, emission ratios, and source attribution. Atmos. Chem. Phys. 11(6):2399–421. doi:10.5194/acp-11-2399-2011.
- Brey, S.J., and E.V. Fischer. 2016. Smoke in the city: How often and where does smoke impact Summertime ozone in the United States? Environ. Sci. Technol. 50 (3):1288–94. doi:10.1021/acs.est.5b05218.
- Brown, S.G., A. Frankel, and H.R. Hafner. 2007. Source apportionment of VOCs in the Los Angeles area using positive matrix factorization. Atmos. Environ. 41 (2):227–37. doi:10.1016/j.atmosenv.2006.08.021.
- Buysse, C.E., A. Kaulfus, U. Nair, and D.A. Jaffe. 2019. Relationships between particulate matter, ozone, and nitrogen oxides during urban smoke events in the Western US. Environ. Sci. Technol. 53 (21):12519–28. doi:10.1021/acs.est.9b05241.
- Camalier, L., W. Cox, and P. Dolwick. 2007. The effects of meteorology on ozone in urban areas and their use in assessing ozone trends. Atmos. Environ. 41 (33):7127–37. doi:10.1016/j.atmosenv.2007.04.061.
- Chameides, W.L., F. Fehsenfeld, M.O. Rodgers, C. Cardelino, J. Martinez, D. Parrish, W. Lonneman, D.R. Lawson, R.A. Rasmussen, P. Zimmerman, et al. 1992. Ozone precursor relationships in the ambient atmosphere. J. Geophys. Res. 97(D5):6037–55. doi:10.1029/91JD03014.
- Crosson, E.R. 2008. A cavity ring-down analyzer for measuring atmospheric levels of methane, carbon dioxide and water vapor. Appl. Phys. B 92:403–08. doi:10.1007/s00340-008-3135-y.
- Dix, B., J. de Bruin, E. Roosenbrand, T. Vlemmix, C. Francoeur, A. Gorchov-Negron, B. McDonald, M. Zhizhin, C. Elvidge, P. Veefkind, et al. 2020. Nitrogen oxide emissions from U.S. Oil and gas production: Recent trends and source attribution. Geophys. Res. Lett. 47(1):e2019GL085866. doi:10.1029/2019GL085866.
- Dix, B., C. Francoeur, M. Li, R. Serrano-Calvo, P.F. Levelt, J.P. Veefkind, B.C. McDonald, and J. de Gouw. 2022. Quantifying NOx emissions from U.S. Oil and gas production regions using TROPOMI NO2. ACS Earth Space. Chem. 6 (2):403–14. doi:10.1021/acsearthspacechem.1c00387.
- Droege, A.T., and F.P. Tully. 1986. Hydrogen-atom abstraction from alkanes by hydroxyl. 3. Propane. J. Phys. Chem. 90 (9):1949–54. doi:10.1021/j100400a042.
- Fischer, E.V., D.J. Jacob, R.M. Yantosca, M.P. Sulprizio, D.B. Millet, J. Mao, F. Paulot, H.B. Singh, A. Roiger, L. Ries et al, 2014. Atmospheric peroxyacetyl nitrate (PAN): A global budget and source attribution. Atmos. Chem. Phys. 14:2679–98. doi:10.5194/acp-14-2679-2014.
- Flocke, F.M., A.J. Weinheimer, A.L. Swanson, J.M. Roberts, R. Schmitt, and S. Shertz. 2005. On the measurement of PANs by gas chromatography and electron capture detection. J. Atmos. Chem. 52 (1):19–43. doi:10.1007/s10874-005-6772-0.
- Francoeur, C.B., B.C. McDonald, J.B. Gilman, K.J. Zarzana, B. Dix, S.S. Brown, J.A. de Gouw, G.J. Frost, M. Li, S.A. McKeen, et al. 2021. Quantifying methane and ozone precursor emissions from oil and gas production regions across the contiguous US. Environ. Sci. Technol. 55(13):9129–39. doi:10.1021/acs.est.0c07352.
- Garcia-Gonzales, D.A., S.B.C. Shonkoff, J. Hays, and M. Jerrett. 2019. Hazardous air pollutants associated with upstream oil and natural gas development: A critical synthesis of Current Peer-reviewed literature. Annu. Rev. Public Health 40 (1):283–304. doi:10.1146/annurev-publhealth-040218-043715.
- Gilman, J.B., B.M. Lerner, W.C. Kuster, and J.A. de Gouw. 2013. Source signature of volatile organic compounds from oil and natural gas operations in Northeastern Colorado. Environ. Sci. Technol. 47 (3):1297–305. doi:10.1021/es304119a.
- Guha, A., D.R. Gentner, R.J. Weber, R. Provencal, and A.H. Goldstein. 2015. Source apportionment of methane and nitrous oxide in California’s San Joaquin Valley at CalNex 2010 via positive matrix factorization. Atmos. Chem. Phys. 15 (20):12043–63. doi:10.5194/acp-15-12043-2015.
- Hopke, P.K. 2016. Review of receptor modeling methods for source apportionment. J. Air Waste Manag. Assoc. 66 (3):237–59. doi:10.1080/10962247.2016.1140693.
- Huangfu, Y., B. Yuan, S. Wang, C. Wu, X. He, J. Qi, J. de Gouw, C. Warneke, J.B. Gilman, A. Wisthaler, et al. 2021. Revisiting acetonitrile as tracer of biomass burning in anthropogenic-influenced environments. Geophys. Res. Lett. 48(11):e2020GL092322. doi:10.1029/2020GL092322.
- Koss, A., B. Yuan, C. Warneke, J.B. Gilman, B.M. Lerner, P.R. Veres, J. Peischl, S. Eilerman, R. Wild, S.S. Brown, et al. 2017. Observations of VOC emissions and photochemical products over US oil- and gas-producing regions using high-resolution H3O+ CIMS (PTR-ToF-MS). Atmos. Meas. Tech. 10(8):2941–68. doi:10.5194/amt-10-2941-2017.
- Lindaas, J., D.K. Farmer, I.B. Pollack, A. Abeleira, F. Flocke, and E.V. Fischer. 2019. Acyl peroxy nitrates link oil and natural gas emissions to high ozone abundances in the Colorado front range during Summer 2015. J. Geophys. Res. 124 (4):2336–50. doi:10.1029/2018JD028825.
- Lindaas, J., D.K. Farmer, I.B. Pollack, A. Abeleira, F. Flocke, R. Roscioli, S. Herndon, and E.V. Fischer. 2017. Changes in ozone and precursors during two aged wildfire smoke events in the Colorado Front Range in summer 2015. Atmos. Chem. Phys. 17 (17):10691–707. doi:10.5194/acp-17-10691-2017.
- Marsavin, A., D. Pan, I.B. Pollack, Y. Zhou, A.P. Sullivan, L.E. Naimie, K.B. Benedict, J.F. Juncosa Calahoranno, E.V. Fischer, A.J. Prenni, B.A. Schichtel, B.C. Sive, and J.L. Collett. 2023. Summertime ozone production at Carlsbad Caverns National Park, New Mexico: Influence of oil and natural gas development.
- McDuffie, E.E., P.M. Edwards, J.B. Gilman, B.M. Lerner, W.P. Dube, M. Trainer, D.E. Wolfe, W.M. Angevine, J. deGouw, E.J. Williams, et al. 2016. Influence of oil and gas emissions on summertime ozone in the Colorado Northern front range. J. Geophys. Res. 121(14):8712–29. doi:10.1002/2016JD025265.
- Naimie, L.E., A.P. Sullivan, K.B. Benedict, A.J. Prenni, B.C. Sive, B.A. Schichtel, E.V. Fischer, I. Pollack, and J. Collett. 2022. PM2.5 in Carlsbad Caverns National Park: Composition, sources, and visibility impacts. J. Air Waste Manag. Assoc. 72 (11):1201–18. doi:10.1080/10962247.2022.2081634.
- Nelson, D., Y. Choi, B. Sadeghi, A.K. Yeganeh, M. Ghahremanloo, and J. Park. 2023. A comprehensive approach combining positive matrix factorization modeling, meteorology, and machine learning for source apportionment of surface ozone precursors: Underlying factors contributing to ozone formation in Houston, Texas. Environ. Pollut. 334:122223. doi:10.1016/j.envpol.2023.122223.
- Neuman, J.A., J.B. Nowak, W. Zheng, F. Flocke, T.B. Ryerson, F.C. Fehsenfeld, J.S. Holloway, D.D. Parrish, G.J. Frost, J. Peischl, et al. 2009. Relationship between photochemical ozone production and NOx oxidation in Houston, Texas. J. Geophys. Res. 114(D7):D00F08. doi:10.1029/2008JD011688.
- Neuman, J.A., T.B. Ryerson, L.G. Huey, R. Jakoubek, J.B. Nowak, C. Simons, and F.C. Fehsenfeld. 2003. Calibration and evaluation of nitric acid and ammonia permeation tubes by UV optical absorption. Environ. Sci. Technol. 37 (13):2975–81. doi:10.1021/es026422l.
- Nussbaumer, C.M., U. Parchatka, I. Tadic, B. Bohn, D. Marno, M. Martinez, R. Rohloff, H. Harder, F. Kluge, K. Pfeilsticker, et al. 2021. Modification of a conventional photolytic converter for improving aircraft measurements of NO2 via chemiluminescence. Atmos. Meas. Tech. 14(10):6759–76. doi:10.5194/amt-14-6759-2021.
- Olaguer, E.P. 2012. The potential near-source ozone impacts of upstream oil and gas industry emissions. J. Air Waste Manag. Assoc. 62 (8):966–77. doi:10.1080/10962247.2012.688923.
- Orak, N.H., M. Reeder, and N.J. Pekney. 2021. Identifying and quantifying source contributions of air quality contaminants during unconventional shale gas extraction. Atmos. Chem. Phys. 21 (6):4729–39. doi:10.5194/acp-21-4729-2021.
- Paatero, P. 1997. Least squares formulation of robust non-negative factor analysis. Chemometr. Intell. Lab. Syst. 37 (1):23–35. doi:10.1016/S0169-7439(96)00044-5.
- Paatero, P. 1999. The multilinear engine—A table-driven, least squares program for solving multilinear problems, including the n-way parallel factor analysis model. J. Comput. Graph. Stat. 8 (4):854–88. doi:10.1080/10618600.1999.10474853.
- Pacsi, A.P., Y. Kimura, G. McGaughey, E.C. McDonald-Buller, and D.T. Allen. 2015. Regional ozone impacts of increased natural gas use in the Texas Power Sector and development in the Eagle Ford shale. Environ. Sci. Technol. 49 (6):3966–73. doi:10.1021/es5055012.
- Pan, D., B. Pollack, B. Sive, A. Marsavin, L. Naimie, K.B. Benedict, Y. Zhou, A.P. Sullivan, A.J. Prenni, E.J. Cope, J.F. Juncosa Calahorrano, E.V. Fischer, B.A. Schichtel, and J. Collett. 2023. Source characterization of volatile organic compounds at Carlsbad Caverns National Park. J. Air Waste Manag Assoc. doi:10.1080/10962247.2023.2266696.
- Polissar, A.V., P.K. Hopke, P. Paatero, W.C. Malm, and J.F. Sisler. 1998. Atmospheric aerosol over Alaska: 2. Elemental composition and sources. J. Geophys. Res. 103 (D15):19045–57. doi:10.1029/98JD01212.
- Pollack, I.B., D. Helmig, K. O’Dell, and E.V. Fischer. 2021. Seasonality and source apportionment of nonmethane volatile organic compounds at Boulder Reservoir, Colorado, between 2017 and 2019. J. Geophys. Res. 126 (9):e2020JD034234. doi:10.1029/2020JD034234.
- Pollack, I.B., B.M. Lerner, and T.B. Ryerson. 2010. Evaluation of ultraviolet light-emitting diodes for detection of atmospheric NO2 by photolysis - chemiluminescence. J. Atmos. Chem. 65 (2–3):111–25. doi:10.1007/s10874-011-9184-3.
- Pozzer, A., M.G. Schultz, and D. Helmig. 2020. Impact of U.S. Oil and natural gas emission increases on surface ozone is most pronounced in the Central United States. Environ. Sci. Technol. 54 (19):12423–33. doi:10.1021/acs.est.9b06983.
- Roberts, J.M. (2007). PAN and related compounds. In volatile organic compounds in the atmosphere, ed. R. Koppmann. doi:10.1002/9780470988657.
- Roberts, J.M., S.B. Bertman, D.D. Parrish, F.C. Fehsenfeld, B.T. Jobson, and H. Niki. 1998. Measurement of alkyl nitrates at Chebogue point, Nova Scotia during the 1993 North Atlantic Regional Experiment (NARE) intensive. J. Geophys. Res. 103 (D11):13569–80. doi:10.1029/98JD00266.
- Roberts, J.M., F. Flocke, C.A. Stroud, D. Hereid, E. Williams, F. Fehsenfeld, W. Brune, M. Martinez, and H. Harder. 2002. Ground‐based measurements of peroxycarboxylic nitric anhydrides (PANs) during the 1999 Southern Oxidants Study Nashville Intensive. J. Geophys. Res. 107 (D21):ACH 1-1-ACH 1–10. doi:10.1029/2001JD000947.
- Roberts, J.M., B.T. Jobson, W. Kuster, P. Goldan, P. Murphy, E. Williams, G. Frost, D. Riemer, E. Apel, C. Stroud, et al. 2003. An examination of the chemistry of peroxycarboxylic nitric anhydrides and related volatile organic compounds during Texas air quality study 2000 using ground‐based measurements. J. Geophys. Res. 108 (D16). doi: 10.1029/2003JD003383.
- Roberts, J.M., C.A. Stroud, B.T. Jobson, M. Trainer, D. Hereid, E. Williams, F. Fehsenfeld, W. Brune, M. Martinez, H. Harder, et al. 2001. Application of a sequential reaction model to PANs and aldehyde measurements in two urban areas. Geophys. Res. Lett. 28(24):4583–86. doi:10.1029/2001GL013507.
- Rodriguez, M.A., M.G. Barna, and T. Moore. 2009. Regional impacts of oil and gas development on ozone formation in the western United States. J. Air Waste Manag. Assoc. 59 (9):1111–18. doi:10.3155/1047-3289.59.9.1111.
- Seinfeld, J.H. 1989. Urban air pollution: State of the science. Science 243 (4892):745–52. doi:10.1126/science.243.4892.745.
- Sillman, S. 1995. The use of NOy, H2O2, and HNO3 as indicators for ozone-NOx -hydrocarbon sensitivity in urban locations. J. Geophys. Res. 100 (D7):14175–88. doi:10.1029/94JD02953.
- Sillman, S. 1999. The relation between ozone, NOx and hydrocarbons in urban and polluted rural environments. Atmos. Environ. 33 (12):1821–45. doi:10.1016/S1352-2310(98)00345-8.
- Trainer, M., D.D. Parrish, M.P. Buhr, R.B. Norton, F.C. Fehsenfeld, K.G. Anlauf, J.W. Bottenheim, Y.Z. Tang, H.A. Wiebe, J.M. Roberts, et al. 1993. Correlation of ozone with NOy in photochemically aged air. J. Geophys. Res. 98(D2):2917–25. doi:10.1029/92JD01910.
- Tzompa-Sosa, Z.A., and E.V. Fischer. 2021. Impacts of emissions of C2-C5 alkanes from the U.S. Oil and gas sector on ozone and other secondary species. J. Geophys. Res. 126 (1):e2019JD031935. doi:10.1029/2019JD031935.
- Tzompa-Sosa, Z.A., E. Mahieu, B. Franco, C.A. Keller, A.J. Turner, D. Helmig, A. Fried, D. Richter, P. Weibring, J. Walega, et al. 2017. Revisiting global fossil fuel and biofuel emissions of ethane. J. Geophys. Res. 122(4):2493–512. doi:10.1002/2016JD025767.
- U.S. Energy Information Administration. 2023a. Natural gas explained. Accessed September, 2023. https://www.eia.gov/energyexplained/natural-gas/where-our-natural-gas-comes-from.php.
- U.S. Energy Information Administration. 2023b. Oil and petroleum products explained. Accessed September, 2023. https://www.eia.gov/energyexplained/oil-and-petroleum-products/where-our-oil-comes-from.php.
- U.S. Environmental Protect Agency. 2022. Air quality system data mart [Internet Database]. Accessed July 18, 2022. https://www.epa.gov/outdoor-air-quality-data.
- Yuan, B., M. Shao, J. de Gouw, D.D. Parrish, S. Lu, M. Wang, L. Zeng, Q. Zhang, Y. Song, J. Zhang, et al. 2012. Volatile organic compounds (VOCs) in urban air: How chemistry affects the interpretation of positive matrix factorization (PMF) analysis. J. Geophys. Res. 117 (D24). doi: 10.1029/2012JD018236.
- Zaragoza, J., S. Callahan, E.E. McDuffie, J. Kirkland, P. Brophy, L. Durrett, D.K. Farmer, Y. Zhou, B. Sive, F. Flocke, et al. 2017. Observations of acyl peroxy nitrates during the Front Range Air Pollution and Photochemistry Éxperiment (FRAPPÉ). J. Geophys. Res. 122(22):,12,416–412,432. doi:10.1002/2017JD027337.