
Abstract
Cutback management may invoke perceptions of distributive (in)justice, potentially shaping how employees respond to change. Using a survey experiment and a longitudinal field study, this article examines how two standards of distributive justice—equality and equity—affect resistance to change in response to cutbacks. The results indicate that distributive justice negatively affects resistance to change, and that distributive equality and distributive equity may have differential effects during cutback management. By signaling distributive justice, public managers may be able to reduce resistance and maintain the organization’s capacity for change and innovation in times of financial distress.
As public organizations face periods of financial decline (Bozeman Citation2010), cutback management is commonplace in public organizations (e.g., Cepiku, Mussari, and Giordano 2016; Raudla, Savi, and Randma-Liiv 2015). The implementation of financial cutbacks in public organizations not only entails fiscal budget balancing, but coincides with wider changes to organizational structures, systems, and processes (Overmans and Noordegraaf Citation2014). The successful implementation of cutbacks thus amounts to significant changes in public organizations and requires the support of organizational members (Schmidt, Groeneveld, and Van de Walle 2017).
At its core, cutback management concerns the distribution of financial cuts across departments and individuals within an organization. Distributive justice is a principle that can inform decision making in cutback management, as well as determine the responses of employees to the distribution of financial cuts. Distributive justice is fostered when such distributions are “consistent with implicit norms for allocation, such as equity or equality” (Colquitt Citation2001:386). Public management research on cutback management strategies lacks a theoretical framework that connects the use of different cutback management strategies to employee responses to change, and distributive justice theory can thus function as such a framework. Management research has shown that the concept of distributive justice offers an important explanation for employee attitudes toward the organization during organizational change (Van Dierendonck and Jacobs Citation2012), but public management research on cutback management has not explicitly built on theories of distributive justice (such as Adams Citation1965; Leventhal Citation1976).
This study aims to connect distributive justice theory with cutback management research in order to examine how employees respond to the distributive justice of cutbacks. The aim to distribute cutbacks “fairly” may seem elementary, but is complicated in practice because a diverse range of standards may underlie individual perceptions of distributive justice. In a fair distribution that adheres to the standard of equality, all involved receive the same, whereas in a fair distribution based on the standard of equity, people get what they deserve. Cutback management strategies may not necessarily adhere to both standards, and distributive equality and distributive equity may have dissimilar effects. This study empirically examines employee perceptions of both standards of distributive justice during cutback management, extending the application of theories of justice in public management research from personnel management and organizational behavior (Rubin Citation2007; Rubin and Kellough Citation2011; Hassan Citation2013).
This article advances research on the role of distributive justice in the context of cutback management by making three contributions. First, this article examines resistance to change of employees, rather than general attitudes toward the organization or the job, such as organizational commitment or job satisfaction (e.g., Kiefer et al. Citation2015; Esteve et al. Citation2017). Especially in times of financial decline, public organizations depend on positive attitudes among their personnel in order to successfully implement organizational changes and generate innovations. It is therefore crucial to examine how the implementation of financial cutbacks affects employees’ resistance to change, so that managers can promote and preserve change readiness and innovation capacity in public organizations in times of financial decline (Van der Voet Citation2019).
The second contribution is that this study explicitly incorporates the role of justice during cutback management, and applies distributive justice theory in a novel way. This article separates distributive equality and distributive equity as two distinct standards of distributive justice (Adams Citation1965; Leventhal Citation1976; Colquitt Citation2001). Studies on justice in organizational change tend either not to separate these two standards of distributive justice or examine situations in which equality and equity coincide. As is further explained in the theoretical section of this article, this distinction informs employee reactions to proportional and targeted cutback management strategies.
Third, this study combines a survey experiment with a longitudinal field study. In doing so, this study overcomes issues of endogeneity that are prevalent in prior research on employee reactions to cutback-related change in public management research (Kiefer et al. Citation2015; Esteve et al. Citation2017; Van der Voet and Vermeeren Citation2017), as well as the generic management sciences (Van Dierendonck and Jacobs Citation2012; Brockner et al. Citation2004). By combining these two designs, this research generates findings with high internal and ecological validity.
In sum, this study investigates the effects of distributive equality and distributive equity on the resistance to change of public sector employees by means of a survey experiment and a longitudinal field study. The main research question is: How do distributive equality and distributive equity of cutback-related change affect employee resistance to change? The research question is investigated by means of a survey experiment and a longitudinal field study. Based on the experiment, it is found that equality and equity both negatively affect resistance to change. Controlling for respondents’ prior levels of change resistance, the results of the longitudinal field study indicate that distributive equity mediates the positive relationship between cutbacks and resistance to change.
THEORY
Equality and Equity as Decision Rules of Distributive Justice
Cutback management concerns the distribution of financial cuts across departments and individuals within an organization in order for the organization to operate at lower levels of resource consumption. Examining cutback management from a perspective of justice is valuable because it provides a principle by which managerial decisions about cuts can be informed and interpreted, as well as a mechanism through which employees’ responses to these decisions can be explained. Research on organizational justice distinguishes between different types of justice, with distributive, procedural, and interactive justice as the main categories (Bernerth et al. Citation2007; Colquitt Citation2001; Colquitt et al. Citation2001). While prior research on organizational change mainly focuses on procedural justice (Van Dierendonck and Jacobs Citation2012), the implementation of financial cuts concerns primarily the allocation of costs and losses across organizational departments and individual members. As experiences of distributive justice are thus a critical element for understanding employee responses to cutback-related change, this article focuses on the role of distributive justice in determining employee resistance to change.
Distributive justice is experienced when an allocation appears consistent with implicit norms (Colquitt Citation2001). However, different norms can underlie distributive justice perceptions. Leventhal (Citation1976) explains that distributive justice can be derived using an equality rule as well as an equity rule. Using a rule of equity, justice is experienced when an individual’s outcome is balanced with his or her input in an exchange relationship (Leventhal Citation1976). To satisfy conditions of distributive equity, outcomes should be proportional to contributions, rights, and deserts [deservingness], which requires the similar treatment of relevantly similar cases and the dissimilar treatment of relevantly dissimilar cases (Feinberg Citation1973:98). When interpreted from an equality rule, justice is a comparative standard that requires that two or more individuals receive the same outcome (Adams Citation1965; Miller Citation1992; Konow Citation2003). The rule of equality is thus by definition egalitarian, whereas the rule of equity is a non-egalitarian standard in which circumstances such as skill, effort, and experience are taken into account.
While many justice scholars acknowledge and discuss equality and equity as comparative and non-comparative standards of distributive justice, equality and equity are rarely examined together in empirical research (Starmans, Sheskin, and Bloom Citation2017). Reflective of the previously mentioned standards of distributive justice, the term distributive equality is used in this study to refer to perceived justice using an absolute egalitarian rule, and the term distributive equity defines justice as a “desert-based” standard that requires a balanced input-outcome ratio in an exchange relationship. Defined in these ways, equality and equity may give rise to experiences of injustice that are distinct yet not mutually exclusive.
Equality and Equity in Cutback Management Strategies
Financial decline and cutback management have become commonplace in public organizations due to a range of underlying causes. Based on a categorization of political vs. technical and internal vs. external factors, Levine’s (Citation1978) framework of organizational decline can be utilized to identify potential causes of cutback management in public organizations. Cutbacks are often attributed to external causes, such as a political decision to implement austerity measures, or a change in the task environment of the organization, such as a decrease in environmental munificence. Conversely, cutbacks can also have internal political or technical causes, such as unremedied inefficiencies that deplete the organization’s resource base, strategic decisions at the organizational level to reallocate resources internally, or the political inability to withstand reduced budget allocations.
When faced with reductions of financial resources, public organizations are often limited in their response, as they have limited opportunities to increase revenue through other means (Schmidt et al. Citation2017). As a consequence, public organizations attempt to increase efficiencies and cut costs by means of cutback management (Raudla et al. Citation2015). In his seminal articles, Levine defined cutback management as “managing organizational change toward lower levels of resource consumption and organizational activity” (Levine Citation1979:180). A distinction is commonly made between proportional and targeted strategies (e.g., Raudla et al. Citation2015; Cepiku et al. Citation2016; Schmidt et al. Citation2017). A targeted strategy is selective in the sense that it aims to allocate cuts across the organization based on a certain criterion (Cepiku et al. Citation2016), such as a department’s current level of efficiency, performance, legitimacy, or its power to resist cuts. Proportional cuts—also referred to as across-the-board cuts—allocate cuts evenly across the organization and may minimize decision-making costs, limit conflict, and prevent managers or politicians from becoming personally associated with cutbacks.
When applied to strategies of cutback management, standards for distributive justice reveal that proportional cutback management strategies are equal, but not necessarily equitable. Cutbacks that are evenly spread across departments within the organization satisfy common-sense ideals of justice; for instance, by relying on verbal cues such as “equal misery approach,” “sharing the pain,” or “being in it together.” However, since some departments may already operate at higher levels of efficiency, such an equal distribution of cuts is not necessarily equitable (compare with the “Efficiency Paradox” in Levine Citation1979:181). Conversely, a targeted allocation of cuts that targets those departments with lower efficiency or higher degrees of slack resources can be said to be unequal, but justifiable from the equity decision rule. In this scenario, certain departments or individuals receive a higher outcome (i.e., smaller resource reduction) because they provide higher inputs (i.e., greater efficiency). A conclusion here is thus that a proportional cutback management strategy adheres to the notion of equality, but not necessarily equity. A targeted cutback management strategy is by definition unequal but may be perceived to be equitable, depending on whether the criterion that is used to distribute cutbacks is deemed relevant and acceptable by change recipients. It is crucial to emphasize the subjective and perceptual nature of employee justice experiences. Even in objectively equal distributions of cutbacks, not all employees might perceive high levels of distributive equality. Distributive equity might be particularly subject to individual subjectivity, given the myriad of input-criteria that may underlie an equitable distribution, and the difficulties to measure and agree on criteria such as effort, performance, or importance.
Employee Responses to Equality and Equity in Cutback Management
Both standards of distributive justice—justice as equality and justice as equity—are likely to shape the responses of employees. One of the most studied responses to organizational change is resistance, which can be defined as individuals’ negative feelings, thoughts, and/or behaviors about organizational change (Piderit Citation2000; Oreg Citation2006). The main theoretical expectation is that when organizational members’ need for distributive justice is not satisfied, they will be more likely to reciprocate by lowering their contributions to the organization in order to (re)balance the exchange relationship between employee and organization (Adams Citation1965). In a context of organizational change, this will make resistance to change by employees more likely. Conversely, high levels of distributive justice—signaled by either equality or equity—will result in lower levels of resistance to change.
This theoretical position can be accounted for by Adams’ theory of distributive justice, and research on social exchange processes more generally (e.g., Lavelle, Rupp, and Brockner Citation2007; Conway et al. Citation2014). This research posits that individuals do not necessarily resist or otherwise negatively respond to organizational change of any kind, but that such reactions are contingent on the content of organizational change (Kiefer et al. Citation2015; Van der Voet and Vermeeren Citation2017). The relationship between justice and employee attitudes is well-supported by empirical evidence obtained in generic management research (Bernerth et al. Citation2007). Meta-analysis by Van Dierendonck and Jacobs (Citation2012) identifies procedural and distributive justice as the main determinants of employee reactions to downsizing initiatives, and shows that distributive justice is the most important among victims of downsizing. In research on downsizing, however, distributive justice is exclusively conceptualized by the standard of distributive equity. The distinction between equality and equity as outlined in this article has thus not yet been examined.
The psychological literature on justice provides arguments for the relative importance of both equality and equity in distributive processes. Research on equality and equity generally shows that people prefer equity over equality. Based on their review of distributive equality and distributive equity, Starmans et al. (Citation2017) state that individuals often tolerate unequal distributions as long as they are perceived to be equitable, and that people may even purposefully allocate resources unevenly in order to adhere to standards of distributive equity. In contrast, there are also indications in the literature that equality may be more consequential than equity. Messick and Schell (Citation1992) propose that, in resource distributions, people tend to prefer simpler heuristics over more complex ones: “Equality acts as [a] simple decision heuristic in tasks that involve the allocation of goods and bads. It is a shortcut that is often used without regards to other questions of deservingness or the goals of an allocation” (Messick and Schell Citation1992:313). In the literature on cutback management, conceptual articles have mostly stressed the importance of the equality rule (e.g., Levine Citation1978, Citation1979). As is argued by Levine (Citation1978:320), “‘Sharing the pain’ is politically expedient because it appeals to common-sense ideals of justice.” Such a position is mirrored in the research on downsizing by Mishra and Spreitzer (Citation1998), who argue that equality signals that employees will not suffer disproportionately, which reduces the threat that employees experience. As a consequence, there will be less need to defend scarce resources and employees will be more likely to work with, rather than oppose, management, resulting in more constructive responses to organizational change.
A key characteristic of justice perceptions during cutback management is that losses rather than gains are distributed. Psychological research indicates that this could affect individuals’ preferences in such a way that equality is preferred over equity. Research by Messick and Schell (Citation1992) and Van Dijk et al. (Citation1999) shows that individuals prefer more equal distributions of costs, burdens, or losses than gains, benefits, or profits (cf. Törnblom and Jonsson Citation1985). A different nature of the goods (or bads) that are distributed is thus likely to have behavioral consequences.
Summarizing, the theoretical expectation of this study is that the implementation of cutbacks evokes experiences of distributive equality and distributive equity among employees. While psychological research generally shows a preference of equity over equality (Starmans et al. Citation2017), equality may be a more straightforward heuristic and may be especially salient when financial cuts (i.e., costs) are distributed. It is expected that both distributive equality and distributive equity are negatively related to resistance to change, and as such, that distributive equality and distributive equity mediate the relationship between financial cutbacks and resistance to change. The following hypotheses are formulated:
H1: Distributive equality is negatively related to resistance to change.
H2: Distributive equity is negatively related to resistance to change.
H3: The positive relationship between cutbacks and resistance to change is mediated by distributive equality.
H4: The positive relationship between cutbacks and resistance to change is mediated by distributive equity.
METHODS
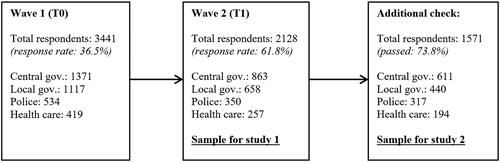
In order to answer the research question and test the study’s hypotheses, this article combines a survey experiment (study 1) and a longitudinal field study (study 2). The data were collected using two consecutive waves (T0 and T1) of the representative Flitspanel survey of the Dutch Ministry of Interior and Kingdom Relations, which consists of approximately 20,000 employees across the fourteen subsectors of the Dutch public sector. The first wave (T0) took place in July 2016. For the purposes of this study, all 9,417 respondents from four different subsectors within the Dutch public sector were invited to participate in the online survey (central government, local government, police, and health care). A total of 3,441 employees participated (overall response rate 36.5%). The sample at T0 consists of 1,371 central government employees (response rate 37.2%), 1,117 local government employees (response rate 34.2%), 534 police employees (response rate 36.6%), and 419 health care employees (response rate 40.2%).
The second wave of the survey (T1) took place in July 2017. For this survey, all 3,441 respondents to the survey at T0 were invited and 2,128 employees provided full responses (overall response rate 61.8%). The sample at T1 consisted of 863 central government employees (response rate 62.9%), 658 local government employees (response rate 58.9%), 350 police employees (response rate 65.5%), and 257 health care employees (response rate 61.3%). Since the survey experiment was embedded in the questionnaire at T1, study 1 is based on this sample of 2,128 employees.
Study 2 concerns a longitudinal field study about respondents’ justice perceptions in cutback-related change. Therefore, justice perceptions were only measured among the respondents who confirmed in an additional check that they had experienced cutback-related changes in the prior year. This results in a decrease in the sample from 2,128 to 1,571 respondents. The sample for study 2 consists of 611 central government employees, 440 local government employees, 317 police employees, and 194 health care employees. An overview of the data collection procedures is given in .
Figure 1. Overview of data collection procedures.
Study 1 consists of a between-subjects, randomized survey experiment. A survey experiment offers a high level of internal validity because it permits systematic manipulation of the independent variables of interest in a controlled environment with subjects randomly assigned to treatments (McDermott Citation2002). Survey experiments may determine the existence and direction of causal relationships, but may not accurately reflect the way such relationships operate in the real world. The survey experiment (study 1) is therefore complemented by a longitudinal field study (study 2). Although this observational design cannot equal the internal validity of the survey experiment, it has higher levels of external or ecological validity due to its emphasis on real-world experiences. By means of structural equation modeling (SEM), the analysis strategy for the field study is to specify a path model in which the relationship between cutbacks and resistance to change is mediated by distributive equity and distributive justice, while controlling for prior levels of resistance to change.
Study 1: Procedures and Measures
The survey experiment aims to uncover the causal effects of distributive equality and distributive equity on resistance to change. The survey experiment randomly assigns the 2,128 respondents to one of four experimental groups. Respondents in each experimental group are presented with a vignette in which a hypothetical management decision to distribute cutbacks between department A and department B in their organization is described. The four vignettes vary in terms of the input of the scenario: even (both departments A and B have overspent the budget in prior years) or uneven (department A has overspent the budget but department B has not), as well as the outcome of the scenario: even (the budget of both departments A and B is cut evenly) or uneven (only the budget of department A is cut and not department B).
The experimental manipulation of distributive equality simply signals whether the outcome of the decision was even or uneven. The experimental manipulation of distributive equity depends on whether input and outcome of the scenario are balanced (Adams Citation1965; Leventhal Citation1976; Colquitt Citation2001). A department’s prior level of spending is considered a relevant input because classic articles on cutback management propose efficiency and slack as a central principle of distributing financial cuts (e.g., Levine Citation1978, Citation1979). Prior (over)spending is also a salient indicator for desert-based standards of distributive equity, because it clearly connects the outcome to a department’s prior actions. This results in four groups: (1) “Equality and Equity”; (2) “Inequality and Equity”; (3) “Equality and Inequity”; and (4) “Inequality and Inequity.”
Group 1, “Equality and Equity,” satisfies both standards of distributive equality and distributive equity, as it specifies that both department A and department B have overspent their budgets and that, consequently, the budgets of departments A and B are cut evenly. Group 2, “Inequality and Equity,” describes a situation in which department A has overspent the budget, but department B has not. The management’s decision is to cut only the budget of department A, and not department B. In this situation, distributive equality is absent because cuts are distributed unevenly, but distributive equity is satisfied because the outcome (budget being cut) is balanced with the input (overspending the budget) of the decision. Group 3, “Equality and Inequity,” also describes a situation in which department A has overspent the budget and department B has not, but in this situation both departments are cut evenly. The standard for distributive equality is thus met. However, the standard for equity is not met because the ratio between inputs and outcomes is unbalanced for department B. Group 4, “Inequality and Inequity,” describes a situation in which neither standard of distributive justice is met. In this scenario, both departments A and B have overspent the budget, but only department A’s budget is cut. The management’s decision thus violates both the standard of equality (even outcome) as well as the standard of equity (balanced input and outcome). The vignette is followed by the question “To what extent do you believe the decision by the management is a good decision?”, which respondents answer using a five-point Likert scale ranging from “1: Very bad decision” to “5: Very good decision.” (cf. Oreg Citation2003). An overview of the experimental conditions is given in . The full vignettes are given in Appendix A.
TABLE 1 Overview of the Experimental Conditions
Study 2: Procedures and Measures
Study 2 consists of a quantitative, longitudinal field study in which respondents’ resistance to change is regressed on measures of their perceived distributive equality and equity of prior cuts, their perceived level of cutback-related change in their organization in the past year, and controlling for a measure of respondents’ level of resistance to change one year earlier. In the survey at both T0 and T1, a measurement scale for resistance to change was administered. In the survey at T1, respondents were asked to indicate the degree to which they had experienced cutbacks in the past year. In addition, measurement scales for the perceived equality and equity of those cutbacks were administered in the survey at T1. All items were measured with a five-point answer scale ranging from “1: Fully disagree” to “5: Fully agree,” except for the degree of cutback-related change, which was measured with a five-point answer scale ranging from “1: Not at all” to “5: To a great extent.” The full measurement scales are given in Appendix B.
Resistance to change. Resistance to change is measured using the behavioral resistance to change scale by Oreg (Citation2006). This scale consists of five items, with a lead-in question that is formulated as: “When I am confronted with changes in my organization, I….” Sample items are “protest” and “complain to my colleagues.”
Distributive equality. Colquitt (Citation2001:389) states that empirical research on distributive justice has emphasized the equity rule. No measure for distributive justice as equality is thus available. Therefore, a four-item measure was developed. Since cutbacks can be distributed between departments as well as individuals, the four items alternate between both levels. Sample items are “All employees were affected in the same degree by the cutbacks” and “The cutbacks have spared some departments but not others” (reversed item).
Distributive equity. Distributive equity was measured by contextualizing the psychometrically validated measure by Colquitt (Citation2001) (originally by Leventhal Citation1976) to a setting of cutback management. The lead-in question is: “The manner in which cutbacks were distributed was fair, given differences in.…” Since cutbacks can be distributed between departments as well as individuals, the four items alternate between both levels. Sample items are “performance between departments” and “the effort that employees exert in their work.”
Cutbacks. The degree of cutback-related change that has been experienced by respondents is measured based on Kiefer et al. (Citation2015). The lead-in question is: “To what extent have you experienced the following in your organization over the past year?” with the item “budget reductions.”
Control variables. The study controls for four personal characteristics of respondents: gender (using a dummy variable that accounts for female gender), age (measured in years), education level (measured as an ordinal variable with five values, corresponding with the Dutch education system), and supervisory position (using a dummy variable that accounts for respondents with a supervisory position). In addition, dummy variables are used to control for employment in the sectors of central government, local government, police, and health care.
RESULTS
In this section, the analyses and results of the survey experiment and the longitudinal field study are presented.
Study 1: Survey Experiment
In order to attribute variation in resistance to change to the independent variables, the survey experiment depends on successful randomization of respondents across the four experimental groups. In , an overview is given of the personal characteristics and sector of employment for the four experimental groups, as well as the total sample. The table shows that health care employees are slightly underrepresented in group 3 and overrepresented in group 4. However, these differences are not statistically significant. As the p-values in indicate, an F-test cannot reject the hypothesis that all groups have the same mean value on personal characteristics or sector. The groups are thus balanced with regards to the variables that are reported in .
TABLE 2 Balance Across Experimental Groups
A regression analysis is performed to examine the causal effects of distributive equality and distributive equity on resistance to change. The results are given in . Since randomization across the treatment groups is successful, only variables based on exogenous, experimental variation are included in the analysis. Dummy variables are used for the two independent variables. The results in model 1 indicate that the intercept for resistance to change is 3.808 on a five-point scale. This suggests that, in general, respondents express relatively high levels of resistance to change. Both the effects of distributive equality (b = −0.566) and distributive equity (b = −0.343) are moderately strong and achieve statistical significance. The analysis indicates that both distributive equality and distributive equity have negative effects on resistance to change. The adjusted R-square statistic indicates that the variables jointly explain 13% of the variance of resistance to change. In model 2, the interaction between equality and equity is shown in model 2. The coefficient of the interaction term is statistically significant (b = .155, p = .037) and indicates that the effect size of the negative relationship between distributive equity and resistance to change is larger when distributive equality is absent.
TABLE 3 Regression Analysis Resistance to Change (N = 2128)
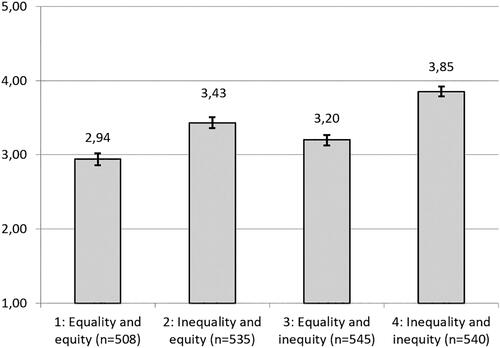
An Anova test was conducted to test for statistically significant differences in change resistance between the treatment groups. In , the mean values of change resistance for the four experimental groups are visualized, including 95% confidence intervals. The confidence intervals are non-overlapping, which indicates that the differences between all experimental groups are statistically significant. The figure shows that respondents who have been presented with the vignette in which financial cutbacks were distributed in an equal and equitable way (group 1) express the lowest level of change resistance (2.94). Conversely respondents in the “Inequality and inequity” group express the highest level of change resistance with a mean of 3.85. The resistance of respondents who have been provided with mixed vignettes (groups 2 and 3) are in between. In line with the results reported in , the mean values of groups 2 and 3 indicate that equality has a stronger effect on change resistance than equity. The overall conclusion of study 1 is that distributive equality and distributive equity have independent, additive effects on employee resistance to change. These effects are statistically significant and substantially meaningful, as indicated by their effect size and explained variance.
Figure 2. Mean scores for resistance to change across experimental groups with 95% confidence intervals.
Study 2: Longitudinal Field Study
The longitudinal field study is intended to extend the results from the survey experiment. Although a survey—even when longitudinal data are used—is less fit to identify causal effects, the survey allows us to study how public employees’ actual experiences of equality and equity are related to resistance to change (hypotheses 1 and 2). This strengthens the ecological validity of the findings that were obtained in the survey experiment. The field study also extends the findings of the survey experiment by examining to what extent the relationship between cutbacks and resistance to change is mediated by distributive equality and distributive equity (hypotheses 3 and 4). The analysis strategy to test the hypotheses is structural equation modeling (SEM).
A first step in SEM is to conduct a confirmatory factor analysis (CFA) to examine the fit of the measurement model to the data. In examining model fit, Kline (Citation2005) recommends use of the chi-square and degrees of freedom (DF), the comparative fit index (CFI), the root mean square error of approximation (RMSEA), and the standardized root mean residual (SRMR). A four-factor measurement model is estimated: distributive equality, distributive equity, resistance to change (T0), and resistance to change (T1). Fit indices for this model are acceptable, but CFI is below the desired threshold of .95. One item of the resistance to change constructs—“presented my objections regarding change to management”—explains particularly little variance of the latent constructs resistance to change T0 and resistance to change T1, as indicated by a multiple squared correlation for this item below the threshold of .20 (Hooper, Coughlan, and Mullen Citation2008). This item is therefore removed, and a modified four-factor model is specified. Substantively, removal of this item can be justified as the item can be interpreted as a constructive rather than obstructive response to change (cf. Mishra and Spreitzer Citation1998). The modified four-factor model satisfies desired thresholds for model fit with CFI = .95, RMSEA lower than .06, and SRMR lower than .08 (Hu and Bentler Citation1999; Hooper et al. Citation2008). In addition, the model fit of the modified four-factor model is better than alternative solutions, such as three-factor model A (single factor for resistance to change at T0 and T1), three-factor model B (single factor for distributive equality and distributive equity), a two-factor model (single factor for resistance to change at T0 and T1, and a single factor for distributive equality and distributive equity), and a one- factor model (all items in one factor). All fit indices are reported in . Model fit for individual constructs and construct reliability (CR) are reported in Appendix B.
TABLE 4 Model Fit of Measurement Model and Structural Models
In , the descriptive statistics of the study’s variables are given. The table shows that the mean value of change resistance is below the midpoint (3.00) of the five-point scale. On average, respondents report the same level of resistance at T0 and T1. The mean values for distributive equality and distributive equity suggest that respondents have, on average, not experienced the cutbacks in their organization to be overly just. The mean for cutbacks is 3.37, indicating that budget reductions have been fairly commonplace among respondents. The demographic variables indicate that 29% of the sample consists of female employees, and that 19% of respondents report having a formal supervisory position. The average age of respondents is 53 years, with an average tenure of 21 years. Central government employees make up the largest group within the sample (39%), followed by local government (28%), police (20%), and health care (12%).
TABLE 5 Means, Standard Deviations (S.D.), and Correlation Matrix (n = 1571).
also gives the correlation coefficients for the relationships between the variables of the study. The strongest relationship exists between resistance to change at T0 and T1 (r = 0.612). Furthermore, correlations between resistance to change at T0 and T1, equality, equity, and the degree of experienced cutbacks are statistically significant. The correlation between equality and equity is 0.358. A higher degree of cutbacks is associated with lower levels of equality and equity. Respondents with higher levels of education or a supervisory position report lower levels of change resistance. With regards to the central variables, the sector employment variables show differences with regards to change resistance and cutbacks. Police employees have experienced higher levels of cutbacks and exhibit more change resistance than other sectors, whereas local government employees report lower levels of cutbacks and resistance to change.
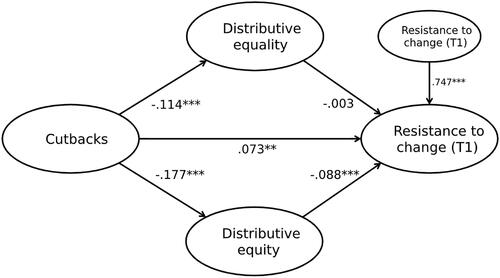
In order to test hypotheses 1, 2, 3, and 4, a structural model for the relationship between cutbacks and resistance to change (T1) is estimated, with distributive equality and distributive equity as mediating variables. Resistance to change (T0) and the demographic and sector variables are modeled as controls for all endogenous variables. Model fit of the structural model is satisfactory with chi square = 1037.60, DF = 195, chi square/DF = 5.32, CFI = .91, RMSEA = .05, and SRMR = .06. reports unstandardized regression coefficients (b), standard errors (S.E.), standardized regression coefficients (Β), and p-values (p) of the relationships in the structural model.
TABLE 6 Results from the Structural Model (n = 1571)
The results in do not corroborate hypothesis 1. Controlling for resistance to change at T0 and the other variables in the model, the relationship between distributive equality and resistance to change (T1) is not statistically significant. A negative, statistically significant relationship exists between distributive equity and resistance to change (T1). The negative effect size (Β = −.088, p < .001) indicates that higher levels of perceived distributive equity are associated with lower levels of resistance to change. The analysis thus provides strong support for hypothesis 2.
Hypothesis 3 proposes a positive relationship between cutbacks and resistance to change that is mediated by distributive equality. Hypothesis 4 states that the positive relationship between cutbacks and resistance to change is mediated by distributive equity. The structural model indicates that cutbacks are negatively related to both distributive equality (Β = −.114, p < .001) and distributive equity (Β = −.177, p < .001). On average, respondents who have reported more budget reductions perceive less distributive equality and distributive equity. Cutbacks are positively related to resistance to change (Β = .072, p = .003). The relationship between distributive equality and resistance to change is not statistically significant (hypothesis 1). Hypothesis 3 is therefore rejected. As the relationship between distributive equity and resistance to change is statistically significant (hypothesis 2), a bootstrapping analysis with 2,000 iterations tests the statistical significance of the indirect relationship between cutbacks and resistance to change. The analysis indicates that the relationship is statistically significant with p = .008. Next to a direct positive relationship between cutbacks and resistance to change, the relationship is thus partly mediated by distributive equity. This result is in support of hypothesis 4. The results concerning the relationships that are specified in hypotheses are depicted in .
Figure 3. Results from the structural model.
DISCUSSION AND CONCLUSION
This study shows that distributive justice is negatively related to resistance to change. This result informs both public management research and practice, since it shows how justice perceptions about cutback management may evoke destructive responses to organizational change. Ensuring distributive justice thus may offer a means of maintaining and improving a public organization’s capacity for change and innovation in times of financial distress.
A major innovation of this article has been to separate equality and equity as two distinct standards of distributive justice. Equality and equity represent a distinction between different standards of justice that allows for the empirical examination of “double injustices” and situations in which standards of distributive justice conflict (Feinberg Citation1974). As is argued by Starmans et al. (Citation2017:6), “the recognition that fairness and equality are different cannot merely be a footnote on empirical studies.” In this article, the results of study 1 indicate that both distributive equality and distributive equity negatively affect resistance to change. The relative importance of equality closely mirrors observations in the literature that individuals are responsive to relatively simple cues about justice, such as the standard of equality (Messick and Schell Citation1992), and that equality is an especially important standard of the distributive justice in the allocation of costs rather than gains (Törnblom and Jonsson Citation1985; Van Dijk et al. Citation1999). In study 2, distributive equity predicts changes in resistance to change, but distributive equality does not. Moreover, the relationship between cutbacks and resistance to change is mediated by distributive equity, but not equality. This result mirrors consensus in the psychological literature that equity matters more than equality in distributions (e.g., Starmans et al. Citation2017), and that non-comparative standards of justice routinely override comparative standards of justice (Feinberg Citation1974).
Comparing the results across study 1 and 2 thus suggests that equality and equity may have different implications during cutback management. Three potential reasons may account for the differences in results between the survey experiment and the longitudinal field study. A first reason may be an equality preference in response to hypothetical experimental scenarios. Based on their review of equality and equity, Starmans et al. (Citation2017) report that participants of laboratory experiments tend to have a strong “equality bias” in comparison to studies in a real-world setting. A second reason may be the temporal differences between study 1 and study 2. Study 1 captures the direct reactions to a change initiative, whereas study 2 examines the relationship between cutback-related change and resistance to change over a one-year period. This suggests that notions of distributive equality and distributive inequity both matter in the moment, but that the effects of perceived inequity endure over a longer period of time. A third potential reason is that the measures for resistance to change in study 1 and study 2 tap into different dimensions of change resistance. Where study 2 relies on a measure of behavioral resistance to change—what individuals do in response to change –, study 1 uses a cognitive measure of resistance to change: what individuals think in response to change (Piderit Citation2000; Oreg Citation2006). Differences in the setting, temporal scope, and dimensions of resistance to change may thus account for the potential diverse consequences of distributive equality and equity, and as such give direction to future research.
A central consideration for both researchers and practitioners concerns the question of which criteria become relevant, salient, and acceptable for an equitable distribution of cuts. In order to operationalize distributive equity in the survey experiment, this article uses overspending of a department’s budget as the input in the input-outcome ratio that underlies distributive equity (Adams Citation1965). A department’s prior level of spending arguably represents an appropriate criterion to justify the allocation of cuts, since prior cutback management research indicates that targeted cutback management strategies are often based on efficiency and/or levels of slack resources (Levine Citation1978, Citation1979) and because overspending clearly signals desert by emphasizing the department’s prior actions. Although overspending is arguably an appropriate signal of desert in the setting of a relatively abstract survey experiment, it must be acknowledged that actual organizational life in the public sector appears considerably more complex. While overspending might indeed be the result of mismanagement or neglect, and thereby desert, it can also be a consequence of external factors that go beyond the control of managers, such as political officials’ preferences or unanticipated shocks in the organization’s task environment. Such circumstances might legitimate overspending to some observers, and may thus influence their equity perceptions.
In contrast to study 1, the field study (study 2) relied on a broader range of input-criteria including performance, effort, and productivity. These criteria may be seen as more salient standards of deservingness that may lead to different justice perceptions, and surveying the real-life equity experiences of respondents is more conducive to the complex, organizational circumstances in which desert and equity are experienced. A focus on prior spending has served a starting point for research on equitable distributions in cutback management, but future research should explore how employees interpret different distributive criteria, such as effort and performance.
Next to a variety of input-criteria that may underlie equity perceptions, future research should aspire to examine justice perceptions in cutback management with greater sensitivity to contextual circumstances. A limitation of the survey experiment and field study presented in this article is that they exclude the cause of cutbacks as an explicit variable of interest. As the previous discussion of overspending indicates, it is likely that the cause of cutbacks is an important determinant of employees’ perceptions of equality and fairness. In this regard, Levine’s (Citation1978) distinction between political vs. technical and internal vs. external causes of financial decline may be of particular interest. A combination of qualitative, quantitative, and experimental research can be utilized to ensure that relationships can be examined under high levels of experimental control, while also adhering to the complexities of organizational reality in the public sector in which experiences of equality and equity come about.
An avenue for future research concerns the role of employees’ distinct motivational drivers during cutback management. The study by Wright, Christensen, and Isett (Citation2013) suggests that public service motivation, in particular the dimension of self-sacrifice, may make employees more willing to support organizational change that has harmful personal consequences. A high degree of self-sacrifice may suppress the negative effects of injustice on responses to change. Similarly, a high degree of user orientation (Jensen and Andersen Citation2015) may cause employees to prioritize the degree to which cuts are equal and equitable for service users such as citizens, pupils, and patients, rather than emphasizing their personal justice experiences. Reasoning from a justice perspective, it may be that other standards of distributive justice than desert matter for such employees. For instance, public sector employees may emphasize that cutbacks do not penalize those service recipients who are most vulnerable (standard of need) or that certain baselines of service quality remain guaranteed for all (standard of sufficiency). Future research can thus examine to what extent other-regarding motivational drivers moderate the relationship between justice perceptions and change responses of public sector employees, and take into account additional standards of distributive justice that are appropriate in such a perspective.
A limitation is that the longitudinal field study rests exclusively on employee perceptions. If such data prove available, future research might consider relating employee perceptions of equality, fairness, and resistance to change to administrative data on budget cuts (such as percentage changes in departmental budgets) or a comparison between employees affected and unaffected by cutback management. Whereas one of the strengths of SEM is to estimate latent constructs using multiple observed indicators, only a single item was used to measure cutbacks. A final limitation is that study 1 and study 2 are not based on independent samples, as respondents of study 1 have also participated in the survey on which study 2 is based.
Cutback management is a topic that is of both academic and practical importance. By examining the role of distributive justice, this article offers practical implications that may inform the behavior and decisions of public managers amidst cutback management. Whereas the cutback management literature touches upon value tradeoffs in cutback management and the importance of fairness (Levine Citation1978), this article shows that different standards of distributive justice do not necessarily coincide. Rather than relying on simplistic notions of equality, such as “sharing the pain,” managers may need to more carefully consider the extent to which their strategies for implementing cutbacks adhere to the different standards of justice that ultimately shape employees’ responses to change. It may be advisable that managers consult with their employees regarding what standards of distributive justice seem particularly appropriate, given the situational circumstances, and in particular which input-criteria appear relevant for an equitable distribution of cutbacks. In such a way, public managers may better preserve the capacity for innovation in times of financial decline.
ACKNOWLEDGMENTS
The author thanks Honorata Mazepus, Brenda Vermeeren, and Andrei Poama for competent advice and feedback during the development of this article, as well as Lotte Bøgh Andersen and the other members of the Crown Prince Frederik Center for Public Leadership for their valuable suggestions on an early version of this study.
Additional information
Funding
Notes on contributors
Joris Van Der Voet
Joris van der Voet ([email protected]) is Assistant Professor of Public Management at the Institute of Public Administration, Leiden University, The Netherlands. He studies the behavior of managers in initiating and implementing organizational change and innovation in public organizations. Joris’ current research project, “Innovation in Times of Decline” (supported by a Veni Grant of the Netherlands Organization for Scientific Research), investigates the relationship between financial resource scarcity and innovation in public organizations. More information is available at www.jorisvandervoet.com.
Related Research Data
References
- Adams, J. S. 1965. “Inequity in Social Exchange.” Pp. 267–99 in Advances in Experimental Social Psychology, vol. 2, edited by Leonard Berkowitz. San Diego, CA: Academic Press.
- Bernerth, J. B., A. A. Armenakis, H. S. Feild, and H. J. Walker. 2007. “Justice, Cynicism, and Commitment: A Study of Important Organizational Change Variables.” The Journal of Applied Behavioral Science 43(3):303–26. doi: https://doi.org/10.1177/0021886306296602.
- Bozeman, B. 2010. “Hard Lessons from Hard Times: Reconsidering and Reorienting the “Managing Decline” Literature.” Public Administration Review 70(4):557–63. doi: https://doi.org/10.1111/j.1540-6210.2010.02176.x.
- Brockner, J., G. Spreitzer, A. Mishra, W. Hochwarter, L. Pepper, and J. Weinberg. 2004. “Perceived Control as an Antidote to the Negative Effects of Layoffs on Survivors’ Organizational Commitment and Job Performance.” Administrative Science Quarterly 49(1):76–100.
- Cepiku, D., R. Mussari, and F. Giordano. 2016. “Local Governments Managing Austerity: Approaches, Determinants and Impact.” Public Administration 94(1):223–43. doi: https://doi.org/10.1111/padm.12222.
- Colquitt, J. A. 2001. “On the Dimensionality of Organizational Justice: A Construct Validation of a Measure.” Journal of Applied Psychology 86(3):386–400. doi: https://doi.org/10.1037/0021-9010.86.3.386.
- Colquitt, J. A., D. E. Conlon, M. J. Wesson, C. O. Porter, and K. Y. Ng. 2001. “Justice at the Millennium: A Meta-Analytic Review of 25 Years of Organizational Justice Research.” Journal of Applied Psychology 86(3):425–45. doi: https://doi.org/10.1037/0021-9010.86.3.425.
- Conway, N., T. Kiefer, J. Hartley, and R. Briner. 2014. “Doing More with Less? Employee Reactions to Psychological Contract Breach via Target Similarity or Spillover during Public Sector Organizational Change.” British Journal of Management 25(4):737–54. doi: https://doi.org/10.1111/1467-8551.12041.
- Esteve, M., C. Schuster, A. Albareda, and C. Losada. 2017. “The Effects of Doing More with Less in the Public Sector: Evidence from a Large‐Scale Survey.” Public Administration Review 77(4):544–53. doi: https://doi.org/10.1111/puar.12766.
- Feinberg, J. 1973. Social Philosophy. Englewood Cliffs, NJ: Prentice-Hall.
- Feinberg, J. 1974. “Non-Comparative Justice.” The Philosophical Review 83(3):297–338. doi: https://doi.org/10.2307/2183696.
- Hassan, S. 2013. “Does Fair Treatment in the Workplace Matter? An Assessment of Organizational Fairness and Employee Outcomes in Government.” The American Review of Public Administration 43(5):539–57. doi: https://doi.org/10.1177/0275074012447979.
- Hooper, D., J. Coughlan, and M. Mullen. 2008. “Structural Equation Modelling: Guidelines for Determining Model Fit.” Electronic Journal of Business Research Methods 6(1):53–60.
- Hu, L. T., and P. M. Bentler. 1999. “Cutoff Criteria for Fit Indexes in Covariance Structure Analysis: Conventional Criteria versus New Alternatives.” Structural Equation Modeling: A Multidisciplinary Journal 6(1):1–55. doi: https://doi.org/10.1080/10705519909540118.
- Jensen, U. T., and L. B. Andersen. 2015. “Public Service Motivation, User Orientation, and Prescription Behaviour: Doing Good for Society or for the Individual User?” Public Administration 93(3):753–68. doi: https://doi.org/10.1111/padm.12163.
- Kiefer, T., J. Hartley, N. Conway, and R. Briner. 2015. “Feeling the Squeeze: Public Employees’ Experiences of Cutback-and Innovation-Related Organizational Changes following a National Announcement of Budget Reductions.” Journal of Public Administration Research and Theory 25(4):1279–305. doi: https://doi.org/10.1093/jopart/muu042.
- Kline, R. B. 2005. Principles and Practice of Structural Equation Modeling. 2nd ed. New York: The Guilford Press.
- Konow, J. 2003. “Which Is the Fairest One of All? A Positive Analysis of Justice Theories.” Journal of Economic Literature 41(4):1188–239. doi: https://doi.org/10.1257/002205103771800013.
- Lavelle, J. J., D. E. Rupp, and J. Brockner. 2007. “Taking a Multifoci Approach to the Study of Justice, Social Exchange, and Citizenship Behavior: The Target Similarity Model.” Journal of Management 33(6):841–66. doi: https://doi.org/10.1177/0149206307307635.
- Levine, C. H. 1978. “Organizational Decline and Cutback Management.” Public Administration Review 38(4):316–25. doi: https://doi.org/10.2307/975813.
- Levine, C. H. 1979. “More on Cutback Management: Hard Questions for Hard Times.” Public Administration Review 39(2):179–83. doi: https://doi.org/10.2307/3110475.
- Leventhal, G. S. 1976. “The Distribution of Rewards and Resources in Groups and Organizations”. Pp. 91–131 in Advances in Experimental Social Psychology, vol. 9, edited by Leonard Berkowitz and Elaine Walster. New York: Academic Press.
- McDermott, R. 2002. “Experimental Methods in Political Science.” Annual Review of Political Science 5(1):31–61. doi: https://doi.org/10.1146/annurev.polisci.5.091001.170657.
- Messick, D. M., and T. Schell. 1992. “Evidence for an Equality Heuristic in Social Decision Making.” Acta Psychologica 80(1-3):311–23. doi: https://doi.org/10.1016/0001-6918(92)90053-G.
- Miller, D. 1992. “Distributive Justice: What the People Think.” Ethics 102(3):555–93. doi: https://doi.org/10.1086/293425.
- Mishra, A. K., and G. M. Spreitzer. 1998. “Explaining How Survivors Respond to Downsizing: The Roles of Trust, Empowerment, Justice, and Work Redesign.” Academy of Management Review 23(3):567–88. doi: https://doi.org/10.5465/amr.1998.926627.
- Oreg, S. 2003. “Resistance to Change: Developing an Individual Differences Measure.” The Journal of Applied Psychology 88(4):680. doi: https://doi.org/10.1037/0021-9010.88.4.680.
- Oreg, S. 2006. “Personality, Context, and Resistance to Organizational Change.” European Journal of Work and Organizational Psychology 15(1):73–101. doi: https://doi.org/10.1080/13594320500451247.
- Overmans, T., and M. Noordegraaf. 2014. “Managing Austerity: Rhetorical and Real Responses to Fiscal Stress in Local Government.” Public Money & Management 34(2):99–106. doi: https://doi.org/10.1080/09540962.2014.887517.
- Piderit, S. K. 2000. “Rethinking Resistance and Recognizing Ambivalence: A Multidimensional View of Attitudes toward an Organizational Change.” Academy of Management Review 25(4):783–94. doi: https://doi.org/10.5465/amr.2000.3707722.
- Raudla, R., R. Savi, and T. Randma-Liiv. 2015. “Cutback Management Literature in the 1970s and 1980s: Taking Stock.” International Review of Administrative Sciences 81(3):433–56. doi: https://doi.org/10.1177/0020852314564313.
- Rubin, E. V. 2007. “The Role of Procedural Justice in Public Personnel Management: Empirical Results from the Department of Defense.” Journal of Public Administration Research and Theory 19(1):125–43. doi: https://doi.org/10.1093/jopart/mum035.
- Rubin, E. V., and J. E. Kellough. 2011. “Does Civil Service Reform Affect Behavior? Linking Alternative Personnel Systems, Perceptions of Procedural Justice, and Complaints.” Journal of Public Administration Research and Theory 22(1):121–41. doi: https://doi.org/10.1093/jopart/mur008.
- Schmidt, E., S. M. Groeneveld, and S. Van de Walle. 2017. “A Change Management Perspective on Public Sector Cutback Management: Towards a Framework for Analysis.” Public Management Review 19(10):1538–55. doi: https://doi.org/10.1080/14719037.2017.1296488.
- Starmans, C., M. Sheskin, and P. Bloom. 2017. “Why People Prefer Unequal Societies.” Nature Human Behaviour 1(4):1–6. doi: https://doi.org/10.1038/s41562-017-0082.
- Törnblom, K. Y., and D. R. Jonsson. 1985. “Subrules of the Equality and Contribution Principles: Their Perceived Fairness in Distribution and Retribution.” Social Psychology Quarterly 48(3):249–61. doi: https://doi.org/10.2307/3033685.
- Van der Voet, J. 2019. “Organizational Decline and Innovation in Public Organizations: A Contextual Framework of Cutback Management.” Perspectives on Public Management and Governance 2(2):139–54.
- Van der Voet, J., and B. Vermeeren. 2017. “Change Management in Hard Times: Can Change Management Mitigate the Negative Relationship between Cutbacks and the Organizational Commitment and Work Engagement of Public Sector Employees?” The American Review of Public Administration 47(2):230–52. doi: https://doi.org/10.1177/0275074015625828.
- Van Dierendonck, D., and G. Jacobs. 2012. “Survivors and Victims: A Meta‐Analytical Review of Fairness and Organizational Commitment after Downsizing.” British Journal of Management 23(1):96–109. doi: https://doi.org/10.1111/j.1467-8551.2010.00724.x.
- Van Dijk, E., M. Engelen, E. van Leeuwen, L. Monden, and E. Sluijter. 1999. “Distributive Justice and the Allocation of Costs, Losses and Profits.” Social Justice Research 12(1):5–18.
- Wright, B. E., R. K. Christensen, and K. R. Isett. 2013. “Motivated to Adapt? The Role of Public Service Motivation as Employees Face Organizational Change.” Public Administration Review 73(5):738–47. doi: https://doi.org/10.1111/puar.12078.
APPENDIX A
Experimental Design and Vignette Study 1
Imagine your organization has to cut back on expenses in order to balance next year’s budget. The management must decide how to allocate cuts across departments.
The management can cut back on Department A and Department B. Departments A and B are similar departments in terms of tasks, size, and performance.
This means that a hiring freeze is implemented, training and education are stopped, and temporary contracts are discontinued.
To what extent do you believe the decision by the management is a good decision? (1: Very bad decision—5: Very good decision) (R)
Notes: (R) indicates item that was reverse coded for the analysis.
APPENDIX B
Measures Used in Study 2
Resistance to change
When I am confronted with changes in my organization, I…
… protest.
… present my objections regarding change to management.*
… complain to my colleagues.
… look for ways to prevent change from taking place.
… speak about change in a positive manner. (R)
Model fit T0: CMIN/DF = 20.70; CFI = 0.98; RMSEA = .11; SRMR = .03; CR = .78
Model fit T1: CMIN/DF = 14.93; CFI = 0.98; RMSEA = .10; SRMR = .02; CR = .77
Distributive equality
The cutbacks were equally divided between departments in my organization.
All employees were affected in the same degree by the cutbacks.
The cutbacks have spared some departments but not others. (R)
The cutbacks made intentional distinctions between employees. (R)
Distributive equity
The manner in which cutbacks were distributed was fair, given differences in …
… performance between departments.
… the effort that employees exert in their work.
… the importance of departments for the organization as a whole.
… the amount of work that people complete.
Model fit: CMIN/DF = 5.97; CFI = 1.00; RMSEA = .06; SRMR = .01; CR = .70
Degree of cutback-related changes
To what extent have you experienced the following in your organization over the past year?
1. Budget reductions
Notes: All items were measured with a five-point answer scale ranging from “1: Fully disagree” to “5: Fully agree,” except for the degree of cutback-related organizational change, which was measured with a five-point answer scale ranging from “1: Not at all” to “5: To a great extent.” The order of items for all scales was randomized in the survey. (R) indicates items that were reverse coded for the analysis. * indicates that item was removed from the analysis.