
Abstract
TIMM50 is a core subunit of the TIM23 complex, the mitochondrial inner membrane translocase responsible for the import of pre-sequence-containing precursors into the mitochondrial matrix and inner membrane. Here we describe a mitochondrial disease patient who is homozygous for a novel variant in TIMM50 and establish the first proteomic map of mitochondrial disease associated with TIMM50 dysfunction. We demonstrate that TIMM50 pathogenic variants reduce the levels and activity of endogenous TIM23 complex, which significantly impacts the mitochondrial proteome, resulting in a combined oxidative phosphorylation (OXPHOS) defect and changes to mitochondrial ultrastructure. Using proteomic data sets from TIMM50 patient fibroblasts and a TIMM50 HEK293 cell model of disease, we reveal that laterally released substrates imported via the TIM23SORT complex pathway are most sensitive to loss of TIMM50. Proteins involved in OXPHOS and mitochondrial ultrastructure are enriched in the TIM23SORT substrate pool, providing a biochemical mechanism for the specific defects in TIMM50-associated mitochondrial disease patients. These results highlight the power of using proteomics to elucidate molecular mechanisms of disease and uncovering novel features of fundamental biology, with the implication that human TIMM50 may have a more pronounced role in lateral insertion than previously understood.
Introduction
Of the approximate 1,100 mitochondrial proteins in human cells, only 13 are encoded by the mitochondrial genome (mtDNA).Citation1,Citation2 The remainder are encoded by the nuclear genome and are imported into mitochondria by translocases embedded within the mitochondrial membranes.Citation3 The translocases of the outer membrane (TOM complex) and inner membrane (TIM23 complex) coordinate to deliver approximately 60% of the mitochondrial proteome to the mitochondrial matrix and inner membrane.Citation4,Citation5 The TIM23 complex is a multifunctional translocase built around a core (comprised of TIMM23, TIMM50 and TIMM17A/B) that engages with discrete subsets of accessory subunits forming either TIM23MOTOR or TIM23SORT complexes ().Citation6 TIM23MOTOR, formed by association with the motor-specific subunits DNAJC19/15, TIMM44, HSPA9, PAM16, GRPEL1 and GRPEL2, is responsible for the translocation of proteins into the mitochondrial matrix, whilst TIM23SORT, formed by association with the sort-specific subunits TIMM21 and ROMO1, facilitates the lateral insertion of single or dual pass membrane proteins into the inner membrane.Citation6 The inner membrane also contains an additional translocase, the TIM22 complex, which is involved in the import of multispanning membrane proteins, including the abundant SLC25A carrier protein family into the inner membrane.Citation7
Figure 1. Isolated TIM23 defect in TIMM50 patient fibroblasts. (A) Depiction of the human TIM23 complex located in the inner mitochondrial membrane. TIM23 consists of core subunits TIMM23, TIMM50 and TIMM17A/B. TIM23CORE associates with accessory subunits forming either TIM23SORT for the lateral insertion of single or dual pass proteins into the inner membrane, or TIM23MOTOR for the complete translocation of proteins into the mitochondrial matrix. IMS: intermembrane space, IMM: inner mitochondrial membrane. (B) Predicted AlphaFoldCitation66,Citation67 structure (AF-Q3ZCQ8) of human TIMM50 colored according to protein domains (mitochondrial targeting sequence (MTS), transmembrane domain (TMD), FCP1-like/core domain (CORE)) and annotated with location of reported pathogenic variants as detailed in Supplementary Table 1. Variant identified in this study is denoted in red. All variants have been mapped to TIMM50 NCBI refseq protein NP_001001563.2. (C) SDS-PAGE and western blot of mitochondria isolated from fibroblast cells probing for TIM translocase subunits, using Coomassie staining as a loading control. Densitometric quantification (right) is presented as percentage of control average, normalized to Coomassie stained loading control. (D) In vitro import of 35S radiolabeled TIMM50WT and TIMM50R113C into mitochondria isolated from WT HEK293 cells in the presence (black circle) or absence (grey circle) of membrane potential (ΔΨ) dissipated with 10 μM FCCP. Following incubation for indicated times, all samples were treated with proteinase K. Coomassie staining is presented as loading control. Empty arrowhead = precursor, filled arrowhead = mature. (E) BN-PAGE and Western blot analysis of mitochondria isolated from fibroblast cells and solubilized in 1% digitonin probing for TIM translocases. Coomassie staining is presented as loading control. Densitometric quantification (below) is presented as percentage of control values, normalized to Coomassie stained loading control. (F) In vitro import of TIM23 substrate (NDUFV3) and TIM22 substrate (GC-1) into mitochondria isolated from fibroblast cells in the presence (black circle) or absence (gray circle) of membrane potential (ΔΨ) dissipated with 10 μM FCCP. Following incubation for indicated times, all samples were treated with proteinase K. Coomassie staining is presented as loading control. Empty arrowhead = precursor, filled arrowhead = mature. Quantifications (right) calculated as percentage of final control timepoint abundance normalized to Coomassie staining. (G) Gene effect scores of TIM23 subunit CRISPR knockouts in cancer cell lines (DepMap Public 23Q2 + Score, Chronos). Lower gene effect scores indicate increased likelihood of dependence in a cell line. A gene effect of −1 is the median score of all common essential genes. Essential gene status was manually curated from the DepMap portal. (H) Determination of mitochondrial protein content in whole cell proteomic data. Total label-free quantification (LFQ) values of mitochondrial proteins were summed and presented as a percentage of total LFQ values of all detected proteins within samples. (I) Quantitative proteomic volcano plot of isolated mitochondria from TIMM50 patient fibroblasts relative to controls. Labelled are significantly altered proteins involved in mitochondrial protein import pathways. (J) Translocase subunit abundance of detected proteins determined from isolated mitochondrial proteomics of fibroblast cells. Values are presented as a percentage of control averages. Data information: C, Control; P, TIMM50 Patient; R, TIMM50 Patient/TIMM50WT Rescue; FC, fold-change; CBB, Coomassie brilliant blue; IB, immunoblot. In C, E, F, H and J, data are presented as mean ± SD. *P ≤ 0.05, **P < 0.01, ***P < 0.001, ****P < 0.0001, n.s = P > 0.05. N = 3 (unpaired Student’s t test).
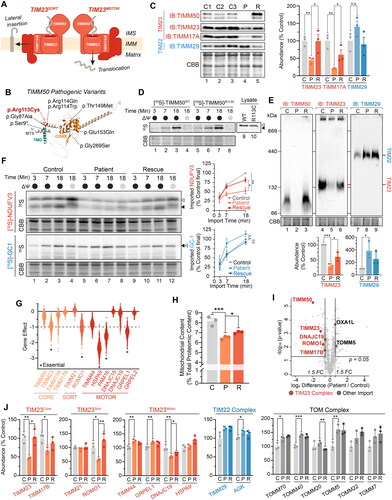
TIM23 complex dysregulation is increasingly associated with mitochondrial diseases, a heterogeneous group of genetic disorders involving mitochondrial dysfunction.Citation7,Citation8 Pathological variants of the core TIM23 complex subunits TIMM23 and TIMM17A/B have not yet been described, but several reported cases of pathogenic variants in TIMM50 have been connected to the mitochondrial disease 3-methylglutaconic aciduria, type IX (MGCA9; MIM: 617698) (Supplementary Table S1).Citation9–14 MGCA9 is an early onset autosomal recessive disorder that is characterized by seizures, intellectual disability, and developmental delay (Supplementary Table S1). MGCA9 patients present with a combined deficiency of the mitochondrial oxidative phosphorylation (OXPHOS) complexes (I-V) that are responsible for aerobic energy production.Citation15 Whilst clinical presentations vary depending on both tissue type and analysis method, pathogenic variants in TIMM50 have been reported to impact all OXPHOS complexes except complex III.Citation9–11
Based on the biochemical function of Tim50 in the yeast Saccharomyces cerevisiae, human TIMM50 is predicted to function as a receptor at the TIM23 complex, interacting with precursor proteins that contain mitochondrial targeting sequences (MTS) and guiding them to the pore of the translocase.Citation16–18 Human TIMM50, however, has diverged from its yeast homolog, no longer possessing a key protein domain involved in precursor handover.Citation19 Therefore, studies on human TIMM50 are required to clarify its function in higher organisms and elucidate the molecular mechanisms underlying mitochondrial dysfunction due to TIMM50 pathogenic variants. Indeed, the role of TIMM50 in mitochondrial protein import evokes the question of whether TIMM50 dysfunction leads to a broad mitochondrial import defect via the TIM23 complex, or if there is a more localized impact on a subset of TIM23 complex substrates. The specific defect observed in OXPHOS complexes suggest the latter,Citation9,Citation11 but the mechanism(s) supporting this phenotype are unknown.
Here, we describe a mitochondrial disease patient homozygous for a novel variant in TIMM50 with clinical symptoms consistent with previously reported cases of MGCA9. Assessment of patient fibroblasts demonstrated reduced levels and activity of the TIM23 complex, which impacts the mitochondrial proteome, resulting in a combined OXPHOS defect and changes to mitochondrial ultrastructure. Using quantitative proteomics of patient fibroblasts and a CRISPR-Cas9 mediated TIMM50 HEK293 cell model of disease, we have established the first proteomic map of mitochondrial disease associated with TIMM50 pathogenic variants. Interrogation of this data set, specifically looking at the proteomic impact on TIM23MOTOR versus TIM23SORT substrates, in addition to protein half-lives in control versus patient cells, suggests that mitochondrial complexes with high turnover and dependence on TIM23SORT are disproportionately affected by TIMM50 pathogenic variants. This specifically impacts several mitochondrial complexes that function in energy production and mitochondrial ultrastructure, providing an explanation for the observed defects in patient cells. This work demonstrates the power of coupling patient cell biology with proteomics to help elucidate molecular mechanisms of disease and uncover novel features of fundamental biology.
Results
Identification of a novel pathogenic variant in TIMM50
A homozygous missense variant in exon 5 of TIMM50 (NM_001001563.5: c.337C > T) was identified by rapid exome sequencing in a patient born to consanguineous parents who presented with global developmental delay, optic nerve atrophy, generalized white matter loss and infantile spasms. While these features are consistent with other reported TIMM50 patients, urinary excretion of 3-methylglutaconic acid (3-MGA) was not detected in this patient. A summary of the clinical characteristics of the patient described in this study and other published TIMM50 patients can be found in Supplementary Table S1. A detailed clinical case report can also be found in the supplementary material.
The c.337C > T TIMM50 variant was predicted to result in an amino acid change from an arginine to a cysteine at amino acid position 113 on the intermembrane space facing side of the protein after the single-pass transmembrane domain (NP_001001563.2; p.(Arg113Cys)) (). The arginine residue at this position has high conservation (100 vertebrates track, UCSC genome browser) and in silico predictions for the variant were consistently pathogenic (PolyPhen, SIFT, CADD, MutationTaster) and rare, with a minor allele frequency of 0.00001053 in the gnomAD v4.0 database (0 homozygotes). Whilst this variant is novel, variants in the adjacent arginine residue (p.(Arg114Trp) and p.(Arg114Gln)), have been reported in patients with MGCA9 () (Supplementary Table S1). Of note, many of the previously reported TIMM50 variants were mapped to a longer TIMM50 isoform which was predicted to have a nuclear localization signal.Citation20 The canonical RefSeq transcript has since been updated to the shorter mitochondrial isoform, and all reported variants were remapped accordingly (Supplementary Table S1). In line with previous investigations of TIMM50 patient fibroblasts,Citation9 this study focused solely on the canonical shorter mitochondrial TIMM50 isoform. Based on the information available at the time of identification, the variant reported here was classified as a variant of uncertain significance with potential clinical relevance. Therefore, additional biochemical analysis was conducted to provide support for its pathogenicity.
TIM23 complex function is impaired in TIMM50 patient fibroblasts
The homozygous p.(Arg113Cys) variant in TIMM50 resulted in near-complete protein loss in mitochondria isolated from patient fibroblasts on SDS-PAGE (). This coincided with significant reductions in the steady state levels of the core TIM23 complex subunits TIMM23 and TIMM17A (). Prolonged stable re-expression of TIMM50WT for 5 days resulted in improved abundances of both TIMM23 and TIMM17A ( and Supplementary Figure S1A). The TIM22 complex subunit TIMM29, which functions independently of the TIM23 complex, was unaffected (). In vitro import of TIMM50WT and the TIMM50 patient variant (TIMM50R113C) into mitochondria isolated from WT HEK293 cells demonstrated comparable import kinetics and precursor processing, suggesting TIMM50R113C is capable of import into the organelle and the observed protein loss is not due to lack of import (). Blue native (BN)-PAGE analysis of mitochondrial protein complexes demonstrated a significant reduction in assembled TIM23 complex abundance (). Re-expression of TIMM50WT significantly increased TIM23 complex abundance, whilst elevated TIM22 complex levels in the patient were unchanged (). To determine if the observed reduction in TIM23 complex impacted mitochondrial protein import rates, in vitro import assays were conducted with radiolabeled TIM23 ([35S]-NDUFV3) and TIM22 complex ([35S]-GC1) substrates. Mitochondria isolated from TIMM50 patient fibroblasts had reduced import kinetics for [35S]-NDUFV3 that improved to near control levels with TIMM50WT re-expression (). The import of the TIM22 complex substrate [35S]-GC1 was unaffected in mitochondria isolated from TIMM50 patient cells (). The persistence of import via the TIM22 complex indicated that the patient fibroblasts retained sufficient membrane potential to facilitate protein import in vitro.
A significant proportion of the mitochondrial proteome is imported via the TIM23 complex, with numerous TIM23 complex subunits classified as being essential for cell viability (). The cellular context of the TIMM50 patient fibroblasts, whereby TIM23 complex levels are significantly reduced but cell viability is maintained, provided a unique opportunity to investigate the consequences of TIM23 complex dysregulation on broader mitochondrial function in human cells. To facilitate this investigation, we employed a proteomic pipeline for the unbiased assessment of TIMM50 patient fibroblasts in both whole cell and isolated mitochondrial samples (Supplementary Figure S1B). Whole cell proteomics revealed that the total cellular mitochondrial protein content was reduced from approximately 8% to 6.5% in patient cells relative to controls, consistent with impaired mitochondrial protein import in TIMM50 patient fibroblasts (). Re-introduction of TIMM50WT only partially increased mitochondrial content, perhaps due to insufficient time of rescue. Mitochondrial proteomics uncovered broad alterations to the mitochondrial proteome, with proteins involved in key mitochondrial processes including OXPHOS and cristae architecture reduced relative to control fibroblasts (Supplementary Figure S1C and D). Whole cell proteomics reaffirmed reductions in OXPHOS and cristae related proteins, in addition to the significant upregulation of nonmitochondrial proteins involved in DNA, RNA and protein synthesis (Supplementary Figure S1E and F). Mitochondrial proteomics revealed reductions in the steady-state levels of core TIM23 complex subunits, with the TIM23SORT subunit ROMO1 and the TIM23MOTOR subunit DNAJC19 being the only noncore subunits significantly reduced ( and ). Components of other mitochondrial import translocases (TIM22 and TOM) were either unaffected or slightly elevated (). These data suggest that defects in TIMM50 patient cells are driven by reduced TIM23 complex levels and consequently TIM23 mediated protein import, resulting in broad impacts on the mitochondrial proteome, with a particular impact on OXPHOS and mitochondrial organization.
Combined OXPHOS deficiency upon loss of TIMM50 function
The TIM23 complex subunit ROMO1 regulates the distribution of TIMM21 between TIM23SORT complexes and MITRAC (mitochondrial translation regulation assembly intermediate of cytochrome c oxidase) complexes during the assembly of complex IV.Citation21 Our proteomic identification of reduced ROMO1 abundance ( and ) in conjunction with the downward trend in OXPHOS proteins (Supplementary Figure S1D and F) in the TIMM50 patient fibroblasts prompted a more targeted OXPHOS complex assessment. Consistent with the literature,Citation9,Citation11 TIMM50 patient fibroblasts had significant reductions in the abundances of complexes I, II and IV, whilst complex V subunits had variable abundances and complex III was unaffected ( and and Supplementary Figure S2A). The abundance of complexes I, II and IV increased with re-expression of TIMM50WT, with the improvement in complexes I and IV being greater than that of complex II (). Notably, across all OXPHOS complexes, every mtDNA encoded subunit was decreased in abundance despite the level of mtDNA in the patient fibroblasts being comparable to controls ( and ). Whilst the reduced levels of mtDNA-encoded subunits undoubtedly contribute to the observed OXPHOS defects, it alone cannot adequately explain the specific combined OXPHOS deficiency. For example, complex II, which contains no mtDNA encoded subunits, was the most reduced OXPHOS complex, while complex III, which does contain an affected mtDNA encoded subunit, was otherwise unchanged in total complex abundance ( to ). Likewise, every OXPHOS complex is also reliant on the import of cytosolically synthesized subunits, and there is no common cofactor or assembly pathway shared by complexes I, II and IV that could explain their specific reductions in abundance (). Despite these changes to steady state OXPHOS complex abundances, the enzymatic activities of the individual complexes were unaffected in enriched mitochondrial preparations from TIMM50 patient fibroblasts ( and Supplementary Table S2). Discrepancies between OXPHOS complex abundance and activity are not uncommon and have been reported previously in TIMM50 patients.Citation9,Citation11 Likewise, pediatric mitochondrial disease patients that have OXPHOS enzymatic defects in skeletal muscle frequently have normal enzyme activities in fibroblasts.Citation22 However, in line with reduced OXPHOS complex abundances, measurement of cellular respiration in TIMM50 patient fibroblasts demonstrated that both basal and maximal oxygen consumption rates were significantly reduced relative to control fibroblasts ().
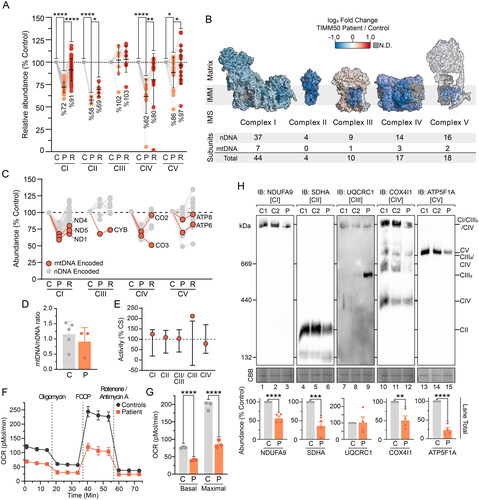
Figure 2. Combined OXPHOS deficiency in TIMM50 patient fibroblasts. (A) Relative abundance of OXPHOS complexes in fibroblast cells as determined from isolated mitochondria proteomics. Each data point represents an individual OXPHOS complex subunit. Complex abundance is calculated as the average abundance of all complex subunits. Percentage values represent complex averages. (B) Mapping of OXPHOS complex subunit fold changes (as shown in A) of TIMM50 patient fibroblasts relative to controls onto complex structures for visualization. Included below are details of complex subunit genomic source. N.D. = not detected. (C) Abundance of mtDNA encoded OXPHOS complex subunits in TIMM50 patient fibroblasts relative to controls as determined from isolated mitochondria proteomics. Each data point represents an individual OXPHOS complex subunit. Gray dots indicate subunits encoded by nuclear DNA. (D) Quantitative PCR determination of mtDNA relative to nuclear DNA (nDNA) in TIMM50 patient and control fibroblast cell lines. N = 3 subcultures (TIMM50 patient cell line) or N = 5 control cell lines. (E) Individual OXPHOS complex enzymology in TIMM50 patient fibroblasts as a percentage of citrate synthase (CS) activity. Error bars indicate range of control fibroblast values. (F and G) Oxygen consumption rate (OCR) measured in live fibroblast cells using a Seahorse XFe96 Analyzer following injection of indicated inhibitors. Control data are presented as average of 5 individual controls. Presented in G are quantifications of basal (prior to oligomycin treatment) and maximal mitochondrial OCR (following FCCP treatment). (H) BN-PAGE of mitochondria isolated from control and TIMM50 patient fibroblast cells solubilized in 1% digitonin and probed for OXPHOS complexes as indicated. Coomassie staining is presented as loading control. Densitometric quantification for total lane intensity (below) is presented as percentage of control values, normalized to Coomassie staining loading control. Data information: C, Control; P, TIMM50 Patient; R, TIMM50 Patient/TIMM50WT Rescue; CBB, Coomassie brilliant blue; IB, immunoblot. In A, D, F, G, and H, data are presented as mean ± SD. *P ≤ 0.05, **P < 0.01, ***P < 0.001, ****P < 0.0001, N = 3 (For A: paired Student’s t test, For G and H: unpaired Student’s t test). In (E), error bars indicate range of control values.
BN-PAGE reaffirmed reduced abundance of complexes I, II and IV whilst complex V presented with a more severe defect than was apparent via mass spectrometry (). The use of the mild detergent digitonin with BN-PAGE preserves complexes I, III and IV in higher-order structures called supercomplexes.Citation23,Citation24 Accordingly, whilst the total abundance of complex III was unchanged in TIMM50 patient fibroblasts, the reduced level of complexes I and IV lead to complex III being stabilized in the independent dimeric form (). Re-expression of TIMM50WT reduced the level of dimeric complex III implying a direct connection with TIMM50 abundance (Supplementary Figure S2B). It is unclear if this stabilized complex III represents fully assembled complex III dimer, especially due to reduced abundance of late-stage complex III assembly factors BCS1L and TTC19 (Supplementary Figure S2C). The persistence of complex III dimers upon supercomplex disruption has been previously documented, and complexes I and IV are known to have high interdependency for stability.Citation25 Therefore, it is difficult to determine if the observed defects in complexes I and IV are both primary defects or if one complex is destabilized upon the loss of the other. Whilst we did not observe a significant defect in MITRAC assembly factors (Supplementary Figure S2D), the significant loss of ROMO1 may be interfering with TIMM21 partitioning between TIM23 complex and MITRAC complexes during complex IV biogenesis.Citation21 The mechanism underlying the loss of complex II in TIMM50 patient fibroblasts in this study and other published work is unclear.Citation9,Citation11 Despite no known biochemical connections, loss of ROMO1 has been shown to reduce complex II steady state abundance and activity.Citation21 The membrane embedded complex II subunits SDHC and SDHD are predicted to be imported via a TIM23 complex pathway involving both TIM23SORT, TIM23MOTOR, and OXA1L machinery.Citation26,Citation27 Thus, the observed defect in complexes I, II and IV independent of complexes III and V may be driven by the loss of ROMO1 and associated import pathways in TIMM50 patient fibroblasts.
TIMM50 pathogenic variants compromise inner membrane integrity
Differences in the abundance of complex V by BN-PAGE analysis and mass spectrometry prompted a closer examination of the observed defect, as variable deficiency in complex V has been reported in TIMM50 patients.Citation10 Additional analysis of complex V via BN-PAGE revealed that the apparent complex V changes were specific to the subunit used for immunodetection (). Whereas a reduction in assembled complex V was observed when immunoblotting with antibodies targeting the F1 domain subunit ATP5F1A ( and ), assessment via the membrane-embedded F0 domain protein ATP5ME showed no change (). Crucially, the steady-state abundance of these two subunits by SDS-PAGE and proteomics were unchanged (). In-gel complex V activity was slightly reduced in patient fibroblasts and demonstrated increased free F1 domain activity (). Furthermore, complex V dimer was also absent when probed with ATP5F1A (). Mapping the mass spectrometry determined subunit fold changes onto the structure of the complex V dimer revealed that all significantly affected subunits were concentrated at the dimer interface (). Disrupted complex V dimerization may explain the variable complex V abundance observed by BN-PAGE, whereby certain complex V sub-complexes may be more sensitive to digitonin solubilization with the absence of dimerization. Indeed, the presentation of complex V defects on BN-PAGE is known to vary with different antibodies without observed changes to overall complex V migration.Citation28,Citation29 Alternatively, assembly factors involved in complex V F1 domain formation (ATPAF1 and ATPAF2) were significantly reduced in TIMM50 patient fibroblasts and could be contributing to the observed phenotype (Supplementary Figure S2C). Whilst F1 subunits were unchanged in abundance (), their incorporation into mature complex V may be reduced due to the decreased levels of these assembly factors. Ultimately, the manifestation of complex V defects in TIMM50 patient fibroblasts appears to be caused by complex instability/assembly defects, rather than defects in subunit abundances.
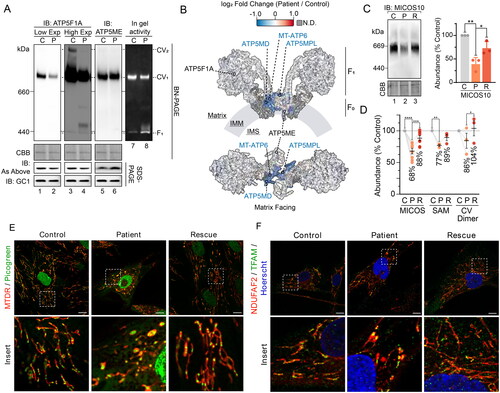
Figure 3. Compromised inner membrane integrity with pathogenic variants in TIMM50. (A) Immunoblotting and in-gel activity of complex V assessed via BN-PAGE and SDS-PAGE of mitochondria isolated from control and TIMM50 patient fibroblast cells. BN-PAGE samples were solubilized in 1% digitonin. “IB: As Above” indicates usage of the same antibody on BN-PAGE as on SDS-PAGE. Coomassie staining was used as a loading control for BN-PAGE. GC1 was used as a loading control for SDS-PAGE. (B) Mapping of complex V subunit fold changes (as shown in ) onto the structure of dimerized complex V (PDB: 7AJD). Labelled are significantly affected subunits, relevant subunits for immunoblotting in , and subcomplex regions. N.D. = not detected. (C) BN-PAGE of mitochondria isolated from fibroblast cells and solubilized in 1% digitonin. Coomassie staining is presented as loading control. Densitometric quantification (right) is presented as percentage of control values, normalized to Coomassie staining loading control. (D) Relative abundance of mitochondrial complexes in fibroblast cells as determined from isolated mitochondria proteomics. Each data point represents an individual complex subunit. Complex abundance is calculated as the average abundance of all complex subunits. Percentage values represent complex averages. (E) Confocal microscopy of fibroblasts immunostained for mitochondria (NDUFAF2, mitochondrial matrix) and mitochondrial DNA (TFAM). Nucleus was stained with Hoechst. Scale bars = 10 μm, Inset shows enlargement of boxed area. (F) Immunofluorescence confocal microscopy of fibroblasts fixed with paraformaldehyde. Nuclei were stained with DAPI and mitochondria with mitochondrial matrix protein NDUFAF2. Immunostaining of TFAM was used for mtDNA visualization. Data information: C, Control; P, TIMM50 Patient; R, TIMM50 Patient/TIMM50WT Rescue; CBB, Coomassie brilliant blue; Exp, exposure; IB, immunoblot. In C and D, data are presented as mean ± SD. *P ≤ 0.05, **P < 0.01, ***P < 0.001, ****P < 0.0001, N = 3 (For C: unpaired Student’s t test, For D: paired Student’s t test).
Complex V dimers are important for the curvature of the mitochondrial inner membrane and the generation and maintenance of cristae.Citation30 Accordingly, we queried if there were changes to additional complexes involved in mitochondrial ultrastructure in the TIMM50 patient fibroblasts. Inner membrane cristae junctions are stabilized by the mitochondrial contact site and cristae organizing system (MICOS),Citation31 which interacts with the outer membrane localized sorting and assembly machinery (SAM) to form the mitochondrial intermembrane space bridging (MIB) complex.Citation32 Consistent with loss of complex V dimers, MICOS and SAM complex abundances were significantly reduced in the TIMM50 patient cells (). The loss of MIB complexes may disrupt the formation of cristae, subsequently impacting the dimerization of complex V. Alternatively, disruption of complex V dimers may impact membrane curvature and thus, the stability of MIB complexes. Whilst it is difficult to discern the primary effect, given the changes to complex V and MIB complexes, we subsequently assessed mitochondrial morphology in the TIMM50 patient cells by live-cell imaging using MitoTracker deep red (MTDR) to stain mitochondria and PicoGreen to stain mtDNA (in addition to nuclear DNA). This revealed the presence of large, swollen mitochondria in the TIMM50 patient cells and the accumulation of mtDNA in defined clusters (). Immunostaining of mtDNA in fixed cells using antibodies against the mtDNA associated protein TFAM demonstrated the same phenotype (). In healthy mitochondria, mtDNA nucleoids are distributed throughout the mitochondrial network to ensure even translation of mtDNA transcripts and partitioning of mtDNA during fission and fusion events.Citation33 Cristae play a vital role in the distribution of mtDNA nucleoids, with loss of cristae causing mitochondrial swelling and mislocalization of mtDNA nucleoids.Citation34–36 The combined observations of reduced complex V dimerization, reduced MIB complex assembly, and the appearance of swollen mitochondria with mtDNA accumulation are suggestive of a cristae defect in the TIMM50 patient fibroblasts. Whether this defect represents a secondary effect driven by defective protein import or involves a more direct role for TIMM50 in cristae formation is unclear.
HEK293 cell models of disease recapitulate TIMM50 patient fibroblast phenotypes
We generated a CRISPR-Cas9 TIMM50 knockout (KO) cell line in Flp-In™ T-Rex™ 293 cells (HEK293), chosen for their high expression of TIMM50 and TIM23 complex subunits (Supplementary Figure S3A), to validate key observations made with the TIMM50 patient fibroblasts. Despite several attempts, we were unable to generate a complete KO of TIMM50, but were able to generate a cell line, designated TIMM50MUT (MUT = mutant (M); and Supplementary Figure S3B) with significantly reduced TIMM50 level, confirmed by SDS-PAGE, BN-PAGE, mass spectrometry and immunofluorescence ( and Supplementary Figure S3C). As observed in the TIMM50 patient fibroblasts, TIMM50MUT cells had significantly reduced core TIM23 complex subunit abundances (, and Supplementary Figure S4A). BN-PAGE further demonstrated reduced abundance of assembled TIM23 complex whilst TIM22 complex levels were unchanged (). Significant reduction in the levels of ROMO1 via mitochondrial proteomics was apparent (), along with slight reductions in the levels of DNAJC19 and elevated TIMM44 levels detected via whole cell proteomics (Supplementary Figure S4A). Re-expression of TIMM50WT rescued the levels of core TIM23 complex subunits and elevated the levels of TIM23SORT (TIMM21 and ROMO1) and TIM23MOTOR (TIMM44 and DNAJC19) subunits (Supplementary Figure S4A). Proteomic analysis confirmed that TIM22 and TOM complex subunits remained unchanged in TIMM50MUT, confirming a specific defect in TIM23 complex abundance (Supplementary Figure S4B and C). Total mitochondrial protein content was slightly reduced, but not to the extent seen in the TIMM50 patient fibroblasts (Supplementary Figure S4D vs Figure S1H).
Figure 4. HEK293 models recapitulate mitochondrial defects. (A) Cell line generation and identities for HEK293 cell models of TIMM50 dysfunction. (B) SDS-PAGE of mitochondria isolated from HEK293 cells subjected to CRISPR-Cas9 gene disruption of TIMM50 and re-expression of WT TIMM50, probing for TIM translocase subunits. Coomassie staining is presented as loading control. Densitometric quantification (right) is presented as percentage of control average, normalized to Coomassie staining loading control. (C) BN-PAGE of mitochondria isolated from HEK293 cells solubilized in 1% digitonin probing for TIM translocase. Coomassie staining is presented as loading control. Densitometric quantification (below) is presented as percentage of control values, normalized to Coomassie staining loading control. (D) Quantitative proteomics volcano plot of isolated mitochondria from HEK293 TIMM50MUT cells relative to WT controls. Labelled are significantly altered proteins involved in mitochondrial protein import. (E) Relative abundance of OXPHOS complexes in HEK293 cells as determined from whole cell proteomics. Each data point represents an individual OXPHOS complex subunit. Complex abundance is calculated as the average abundance of all complex subunits. Percentage values represent complex averages compared to controls. (F) BN-PAGE of mitochondria isolated from HEK293 cells solubilized in 1% digitonin probing for OXPHOS complexes. Coomassie staining is presented as loading control. Densitometric quantification (below) is presented as percentage of control values, normalized to Coomassie staining loading control. (G and H) Oxygen consumption rate (OCR) measured in live HEK293 cells using a Seahorse XFe96 Analyzer following injection of indicated inhibitors. Presented in H are quantifications of basal (prior to oligomycin treatment) and maximal mitochondrial OCR (following FCCP treatment). (I) Radiolabeling of mitochondrial translation products in HEK293 cells performed by pulsing with [35S]-Met/Cys for 2 h in the presence of the cytosolic translation inhibitor anisomycin followed by a chase for the indicated times. Isolated mitochondria were analyzed by SDS-PAGE and autoradiography. Coomassie staining is presented as a loading control. (J) BN-PAGE of mitochondria isolated from HEK293 cells and solubilized in 1% digitonin. Coomassie staining is presented as loading control. Densitometric quantification (below) is presented as percentage of control values, normalized to Coomassie staining loading control. (K) Confocal microscopy of HEK293 immunostained for mitochondria (NDUFAF2, mitochondrial matrix) and mitochondrial DNA (TFAM). Nuclei were stained with Hoechst. Inset shows enlargement of boxed area, scale bar = 10 μm. Data information: C, WT HEK293 Control; M, HEK TIMM50MUT; R, TIMM50MUT/TIMM50 rescue; CBB, Coomassie brilliant blue; FC, fold change; IB, immunoblot. In B, C, E–H, and J, data are presented as mean ± SD. *P ≤ 0.05, **P < 0.01, ***P < 0.001, ****P < 0.0001, N = 3 (For B, C, D, H and J: unpaired Student’s t test, For E: paired Student’s t test).
![Figure 4. HEK293 models recapitulate mitochondrial defects. (A) Cell line generation and identities for HEK293 cell models of TIMM50 dysfunction. (B) SDS-PAGE of mitochondria isolated from HEK293 cells subjected to CRISPR-Cas9 gene disruption of TIMM50 and re-expression of WT TIMM50, probing for TIM translocase subunits. Coomassie staining is presented as loading control. Densitometric quantification (right) is presented as percentage of control average, normalized to Coomassie staining loading control. (C) BN-PAGE of mitochondria isolated from HEK293 cells solubilized in 1% digitonin probing for TIM translocase. Coomassie staining is presented as loading control. Densitometric quantification (below) is presented as percentage of control values, normalized to Coomassie staining loading control. (D) Quantitative proteomics volcano plot of isolated mitochondria from HEK293 TIMM50MUT cells relative to WT controls. Labelled are significantly altered proteins involved in mitochondrial protein import. (E) Relative abundance of OXPHOS complexes in HEK293 cells as determined from whole cell proteomics. Each data point represents an individual OXPHOS complex subunit. Complex abundance is calculated as the average abundance of all complex subunits. Percentage values represent complex averages compared to controls. (F) BN-PAGE of mitochondria isolated from HEK293 cells solubilized in 1% digitonin probing for OXPHOS complexes. Coomassie staining is presented as loading control. Densitometric quantification (below) is presented as percentage of control values, normalized to Coomassie staining loading control. (G and H) Oxygen consumption rate (OCR) measured in live HEK293 cells using a Seahorse XFe96 Analyzer following injection of indicated inhibitors. Presented in H are quantifications of basal (prior to oligomycin treatment) and maximal mitochondrial OCR (following FCCP treatment). (I) Radiolabeling of mitochondrial translation products in HEK293 cells performed by pulsing with [35S]-Met/Cys for 2 h in the presence of the cytosolic translation inhibitor anisomycin followed by a chase for the indicated times. Isolated mitochondria were analyzed by SDS-PAGE and autoradiography. Coomassie staining is presented as a loading control. (J) BN-PAGE of mitochondria isolated from HEK293 cells and solubilized in 1% digitonin. Coomassie staining is presented as loading control. Densitometric quantification (below) is presented as percentage of control values, normalized to Coomassie staining loading control. (K) Confocal microscopy of HEK293 immunostained for mitochondria (NDUFAF2, mitochondrial matrix) and mitochondrial DNA (TFAM). Nuclei were stained with Hoechst. Inset shows enlargement of boxed area, scale bar = 10 μm. Data information: C, WT HEK293 Control; M, HEK TIMM50MUT; R, TIMM50MUT/TIMM50 rescue; CBB, Coomassie brilliant blue; FC, fold change; IB, immunoblot. In B, C, E–H, and J, data are presented as mean ± SD. *P ≤ 0.05, **P < 0.01, ***P < 0.001, ****P < 0.0001, N = 3 (For B, C, D, H and J: unpaired Student’s t test, For E: paired Student’s t test).](/cms/asset/7a831e0f-fd1b-4ae5-82de-92705c2a003f/tmcb_a_2353652_f0004_c.jpg)
As observed in the TIMM50 patient cells, TIMM50MUT cells presented with a combined OXPHOS defect in complexes I, II and IV via BN-PAGE and mass spectrometry (). Complex III levels were unchanged, and complex V appeared upregulated via mass spectrometry and had high variability on BN-PAGE (). Supercomplex formation was also reduced and coincided with increased appearance of free complex III dimers, as was observed in the TIMM50 patient fibroblasts (). The significant variation in complex V on BN-PAGE despite elevated steady state levels via mass spectrometry is further evidence that complex V defects are stability/solubilization related, and do not represent reduced abundance (). Both basal and maximal oxygen consumption rates were significantly reduced in the TIMM50MUT cells (), consistent with the reduced abundances of multiple OXPHOS complexes. The amount of mtDNA in the TIMM50MUT cells was unchanged (Supplementary Figure S4E) and the translation of mtDNA encoded OXPHOS subunits was equivalent to WT control cells (). These data suggest that defects in mtDNA are not responsible for the observed reduction in OXPHOS complex abundances and respiration in the TIMM50MUT cells.
Like TIMM50 patient cells, reduced abundance of ROMO1 in the TIMM50MUT HEK293 cells did not coincide with a defect in MITRAC assembly factors (Supplementary Figure S4F). However, unique to the HEK293 TIMM50MUT cells, was the significant reduction in levels of numerous complex II assembly factors, including SDHAF2, SDHAF3 and SDHAF4 (Supplementary Figure S4G). These complex II assembly factors were not detectable by mass spectrometry in either control or TIMM50 patient fibroblasts (Supplementary Figure S2C). Therefore, while their decrease may contribute to the reduction in complex II observed in patient cells, we cannot make definitive conclusions. Nevertheless, in both fibroblasts and HEK293 cells, there were changes to the distribution and migration of complex II sub-complexes on BN-PAGE (Supplementary Figure S4H). These sub-complexes represent interactions between complex II subunits and assembly factors,Citation37 and their alteration may implicate complex II assembly factors in the observed defect.
The level of MICOS complex in TIMM50MUT cells was significantly reduced () and immunostaining of mitochondria with the matrix protein NDUFAF2 revealed large, swollen mitochondria consistent with the patient fibroblast phenotype (). TFAM immunostaining of mtDNA demonstrated perturbed localization of mtDNA with accumulation in swollen regions (). As with the TIMM50 patient fibroblasts, this phenotype suggests that the TIMM50MUT HEK293 cells harbor a cristae defect. Together, these data demonstrated that the phenotype of the HEK293 TIMM50MUT cells mirrored that of the TIMM50 patient fibroblasts, supporting the phenotypic observations as being specific to TIMM50 dysfunction. Ultimately, it can be concluded that the loss of TIMM50 reduces TIM23 complex abundance, resulting in the manifestation of a combined OXPHOS deficiency and perturbations to mitochondrial cristae, due to impaired protein import via the TIM23 complex.
TIM23SORT import is more significantly impacted than TIM23MOTOR import upon loss of TIMM50
Given the phenotypes observed in both TIMM50 patient fibroblasts and HEK293 TIMM50MUT cells, we asked if a unifying model focused on impaired protein import could sufficiently explain the mitochondrial dysfunction caused by loss of TIMM50 function. We hypothesized that a differential impact on TIM23 substrates, that is TIM23MOTOR (targeted to the matrix) or TIM23SORT (targeted to the inner membrane), could explain the observed defects in TIMM50 patient fibroblasts and TIMM50MUT cells. To facilitate this interrogation, we systematically categorized all nuclear encoded mitochondrial inner membrane and matrix localized proteins (based on MitoCarta 3.0Citation2) into predicted import pathways (). Of the initial 827 proteins, 711 were deemed TIM23 complex substrates, of which 592 were predicted to be imported via TIM23MOTOR and 119 via TIM23SORT ( and Supplementary Table S4). Fifty-eight proteins were designated as TIM22 complex substrates, with another 58 either being imported via alternative pathways or having insufficient information to be properly classified (). Gene Ontology (GO) enrichment mapping of the protein lists generated for the three major inner membrane import pathways (TIM22, TIM23MOTOR and TIM23SORT) affirmed the accuracy of the pipeline, with the TIM22 pathway substrate list being enriched with mitochondrial transporter proteins as expected (). Conversely, the TIM23SORT pathway was enriched with proteins involved in OXPHOS function and cristae formation, whilst the TIM23MOTOR substrates largely represented proteins involved in the mitochondrial central dogma and metabolism ().
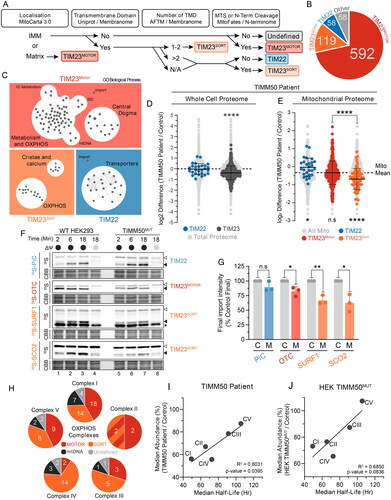
Figure 5. Mitochondrial pathways with increased TIM23SORT dependence are most impacted by loss of TIMM50. (A) Pipeline for import pathway annotation of inner membrane and matrix proteins. Gene list of inner membrane and matrix proteins according to MitoCarta 3.0 (excluding mtDNA encoded proteins) were annotated with the following datasets; Uniprot, predicted transmembrane domain; Membranome, predicted transmembrane domain; AFTM, predicted number of transmembrane domains; Membranome, bitopic; MitoFates, mitochondrial targeting sequence prediction; N-terminome, presence of cleaved n-terminal sequence. Thresholds for each group were as follows; Transmembrane Domain, yes in either database; Number of transmembrane domains, prioritized Membranome bitopic; MTS or N-Term Cleavage, MitoFates score > 0.250 or presence of n-terminal cleavage. Following annotation, substrates predicted to be OXA1L substrates were manually re-assigned. (B) Breakdown of proteins assigned to each import pathway annotation. (C) Enrichment maps of GO biological process terms from import pathway annotation data sets with false discovery rate of less than 0.05. Each dot represents an enriched GO biological process with lines indicating common genes shared across GO biological process gene sets. (D) Fold-change values of mitochondrial proteins grouped according to predicted import pathways in TIMM50 patient fibroblasts relative to controls in whole cell proteomics data set. Light gray dots represent the distribution of the total cellular proteome. Statistical significance indicates import pathway substrate means relative to the total cell proteome mean. (E) Fold-change values of mitochondrial proteins grouped according to predicted import pathways in TIMM50 patient fibroblasts relative to controls in whole cell proteomics data set. Light gray dots represent the distribution of the total mitochondrial proteome with the mitochondrial mean indicated. Bottom: Statistical significance of import pathway substrate means relative to the mitochondrial mean. Top: Statistical significance represents comparison of means between import pathway substrate groups. (F and G) In vitro import of TIM22 (PiC), TIM23MOTOR (OTC) and TIM23SORT (SURF1 and SCO2) substrates into mitochondria isolated from HEK293 cells in the presence (black circle) or absence (gray circle) of membrane potential (ΔΨ) dissipated with 10 μM FCCP. Following incubation for indicated times, all samples were treated with proteinase K. Coomassie staining is presented as loading control. Empty arrowhead = precursor, filled arrowhead = mature. Quantifications (right) calculated as percentage of final control timepoint abundance normalized to Coomassie staining. (H) Pie charts of OXPHOS complexes according to determined import pathway. Multicolored complex II section represents SDHC and SDHD which are imported via a combined TIM23 SORT-MOTOR-OXA1L import pathway. (I and J) Correlation of OXPHOS complex median abundance with median half-life in either TIMM50 patient fibroblasts (G) or TIMM50MUT HEK293 (H) cells relative to controls. Abundance data were collected from whole cell proteomics dataset. Solid line represents linear regression. Data information: C, WT HEK293 Control; M, HEK TIMM50MUT. In D–G, data are presented as mean ± SD. *P ≤ 0.05, **P < 0.01, ***P < 0.001, ****P < 0.0001, N = 3 (unpaired Student’s t test).
The finding that the TIM23SORT pathway substrate list was enriched with proteins involved in OXPHOS function and cristae formation () was reminiscent of the defects observed upon loss of TIMM50 function. To interrogate this further, the substrate list generated for each inner membrane import pathway (TIM22, TIM23MOTOR and TIM23SORT) ( and Supplementary Table S4) was annotated against our whole cell proteomic datasets for both the TIMM50 patient fibroblasts and TIMM50MUT HEK293 cells (Supplementary Table S3). Consistent with our prior observation of reduced mitochondrial protein content in TIMM50 patient and TIMM50MUT cells ( and Supplementary Figure S4D), the combined pool of TIM23 substrates was significantly reduced in abundance whilst the abundance of TIM22 substrates was unchanged ( and Supplementary Figure S5A). Furthermore, splitting the TIM23 substrate pool into separate TIM23MOTOR and TIM23SORT pools revealed that in both TIMM50 patient fibroblasts and TIMM50MUT cells, TIM23SORT substrates were more significantly reduced in abundance than TIM23MOTOR substrates ( and Supplementary Figure S5B). Conversely, within the context of the mitochondrial proteome, substrates of the TIM22 complex were increased in relative abundance to the mitochondrial mean ( and Supplementary Figure S5B). Whilst this could represent a compensatory response, it likely is a consequence of a global TIM23 complex substrate defect skewing the mitochondrial mean (). Indeed, mitochondrial outer membrane (MOM) proteins were also increased relative to the mitochondrial mean in both TIMM50 patient fibroblasts and TIMM50MUT cells (Supplementary Figure S5C and D). Furthermore, TIM22 substrate abundances were unchanged in the context of the total cellular proteome ( and Supplementary Figure S5A), suggesting that TIM22 substrates were not accumulating in the cytosol. This was confirmed using carbonate extraction, which demonstrated efficient incorporation of carrier proteins (SLC25A6 and SLC25A12) into the membrane (Supplementary Figure S5E).
The more pronounced reduction in TIM23SORT substrates compared to TIM23MOTOR substrates provides an explanation for the manifestation of OXPHOS and cristae defects in TIMM50 patient fibroblasts as TIM23SORT substrates are enriched in these pathways (). To obtain biochemical support for these observations, we performed in vitro import analyses using TIM22 (PiC), TIM23MOTOR (OTC) and TIM23SORT (SURF1 and SCO2) substrates in WT control and TIMM50MUT HEK293 cells. Consistent with the proteomics data, both TIM23MOTOR and TIM23SORT substrates had reduced import kinetics in TIMM50MUT mitochondria, with a more severe defect apparent for the TIM23SORT versus the TIM23MOTOR substrates (). The import of the TIM23MOTOR substrate OTC was reduced to 82% of control, whilst the TIM23SORT substrates SURF1 and SCO2 were 67% and 62% of control, respectively ( and ). These observations were specific to the TIM23 complex, as both the steady state levels of the TOM complex and the import kinetics of [35S]-hTOMM40 in the presence and absence of ATP (Supplementary Figure 6F and G) were unchanged in the TIMM50MUT cells compared to WT. This suggests that loss of TIMM50 function leads to a general import defect via the TIM23 complex, which more significantly impacts substrates requiring lateral insertion into the inner membrane via TIM23SORT.
We queried whether increased sensitivity of TIM23SORT substrates upon TIMM50 dysregulation could explain the unique OXPHOS deficiency in both TIMM50 patient fibroblasts and TIMM50MUT cells. This was supported by the consistent defect we observed in the TIM23SORT specific subunit ROMO1 ( and ). However, assessment of the import pathways of OXPHOS complex subunits revealed that all OXPHOS complexes contain both TIM23SORT and TIM23MOTOR substrates (). Therefore, whilst the loss of ROMO1 and associated TIM23SORT import provided explanations for the observed defects in complexes I, II and IV, it did not adequately explain why complexes III and V were resistant to reduced TIMM50 abundance ( and ). Indeed, both complexes III and IV had a greater number of TIM23SORT dependent subunits compared to TIM23MOTOR (). Thus, we queried if the rate of protein import of substrates through the TIM23 translocase was influencing the observed deficiencies. As an indirect measure of protein import, we collated protein half-life data from Morgenstern et al.,Citation1 who used a proteomic approach to determine the protein half-lives of over 800 mitochondrial proteins. Combining these half-life data with our substrate annotations of TIM23MOTOR, TIM23SORT and TIM22, we observed no statistically significant difference in the average protein half-life of these different substrate classes (Supplementary Figure S5H), suggesting that the more severe defect in TIM23SORT substrates was not because of an increased rate of import. Due to the global reliance of OXPHOS complexes on TIM23SORT for subunit import (), we questioned if defect severity in OXPHOS complexes was related to total complex half-life, rather than the individual subunit half-life. Indeed, we found that OXPHOS complex abundance in both TIMM50 patient fibroblasts and TIMM50MUT cells positively correlated with complex half-life (). These data suggest that complexes III and V do not present with a significant abundance defect in TIMM50 disease models because their increased complex half-life is able to overcome any apparent defects that would arise in steady state abundance due to reduced TIM23 complex import. Hence, the observation that complexes I, II and IV have increased turnover relative to complexes III and V and thus present with a more severe defect is supported by existing measurements of OXPHOS complex half-life.Citation38
In summary, we show that mitochondrial dysfunction manifesting upon the loss of TIMM50 is determined by at least two factors: (a) pathway reliance on TIM23SORT vs TIM23MOTOR for protein import, and (b) the rate of protein import into mitochondria. These observations can be used to explain the defects in cristae and OXPHOS complexes due to the reliance of certain protein complexes on higher import rates via TIM23SORT.
Discussion
Our data provide insight into the molecular mechanisms of mitochondrial dysfunction associated with pathogenic variants in TIMM50. Using an untargeted proteomic approach to explore the consequences of TIMM50 functional loss on the mitochondrial proteome in both TIMM50 patient fibroblasts and HEK293 cell models of disease, we find that substrates imported via the TIM23SORT complex are most significantly impacted by reduced TIMM50 abundance. Ultimately, mitochondrial pathways with high reliance on TIM23SORT for subunit import are most affected by loss of TIMM50, which includes two key mitochondrial processes involved in efficient energy generation: oxidative phosphorylation and mitochondrial cristae formation.
We validated a novel pathogenic variant in TIMM50 identified in a pediatric patient born to consanguineous parents. The onset and nature of the clinical presentation were consistent with other reported pathogenic variants in TIMM50 causing MGCA9, including global developmental delay, optic nerve atrophy, generalized white matter loss and infantile spasms (Supplementary Table 1), although 3-MGA was not present. The novel p.(Arg113Cys) variant triggered TIMM50 protein loss, similar to previously described TIMM50 pathogenic variants,Citation9,Citation11 which induced: (a) reductions to the steady-state levels of other core TIM23 complex subunits; (b) loss of mature TIM23 complex on BN-PAGE; and (c) reduced kinetics of import via TIM23 in vitro.
Whilst human TIMM50 has diverged from its yeast homolog, no longer possessing a key protein domain involved in precursor handover,Citation19 the observed consequences on TIM23 complex assembly and function in TIMM50 patient fibroblasts confirm a crucial role for TIMM50 at the complex. Potential phosphatase activity for TIMM50 in vitro has been reported, suggesting that additional roles for human TIMM50 in regulating membrane permeability exist.Citation19 Although we cannot conclusively eliminate the potential influence of such additional functions, our data propose that the manifestation of mitochondrial defects in TIMM50 patient cells is primarily driven by localized impacts at the TIM23 complex and perturbations to protein import. Whether this reduced rate of import is caused by the absence of TIMM50, or rather the loss of TIM23 complex is unclear. However, TIMM50 patient fibroblasts cultured in galactose media showed a rescue in the abundance of OXPHOS complexes.Citation9 Whilst growth in galactose increases demand on OXPHOS complexes for aerobic energy production,Citation39 it also triggered increased levels of TIM23 complex subunits in these TIMM50 patient fibroblasts.Citation9 This suggests that despite reduced TIMM50 levels, increasing TIM23 complex subunit abundance had positive outcomes on the import of TIM23 substrates.
Using proteomics, we identified key mitochondrial processes influenced by the loss of TIMM50. In line with previous work,Citation9,Citation11 we characterized a combined defect in the abundances of complexes I, II and IV of the electron transport chain. This defect did not coincide with significant reductions in the enzymatic activity of these complexes, highlighting the additional insight provided by alternative assessment methods when investigating mitochondrial disease patient fibroblasts. In addition to disruptions in OXPHOS complex abundance, we identified changes to mitochondrial ultrastructure in TIMM50 patient cells. It has previously been suggested that mitochondria are shorter and rounded, and have reduced cristae in TIMM50 patient cells, and that TIMM50 may play a direct role in cristae formation.Citation11 Our proteomic data determined that several key complexes that uphold mitochondrial cristae formation, namely complex V, MICOS and the SAM complex, were impacted in TIMM50 patient fibroblasts, providing a rationale for the observed changes in mitochondrial ultrastructure. Indeed, the structural changes observed in the TIMM50 patient cells are comparable to knockdown of the MICOS subunit Mic60, whereby mitochondria swell and accumulate mtDNA.Citation34 Taken together, these data suggest that defects in TIM23 complex import, underpinned by TIMM50 mutation, drive defects in key modulators of organelle energy production and structure and this underpins the clinical features associated with TIMM50 mutation.
Over 60% of the mitochondrial proteome is imported via the TIM23 complex.Citation4,Citation5 Whilst our data demonstrate that lack of functional TIMM50 influences global TIM23 complex function, we find specifically that import via the TIM23SORT pathway is impacted to a greater extent than that of the TIM23MOTOR pathway. This contrasts with models of Tim50 depletion in yeast, whereby TIM23MOTOR import is more dependent on Tim50.Citation16,Citation40 The mechanism(s) underscoring this phenotype are unclear, but we postulate that TIMM50 has a more central role in TIM23SORT import in human mitochondria. Indeed, the most significantly impacted peripheral TIM23 complex subunit upon loss of TIMM50 was the TIM23SORT subunit ROMO1. TIMM50 may have a distinct role in the import of substrates via TIM23SORT that is additive to defects caused by hypothesized loss of TIMM50 receptor function. Further exploration of this TIMM50-ROMO1 axis will aid in decoding the role of TIMM50 in the pathway governing lateral release of proteins into the inner membrane.
Increased sensitivity of TIM23SORT substrates appears to be the key driver of specific mitochondrial defects in the TIMM50 patient fibroblasts. The enrichment of OXPHOS subunits and proteins involved in cristae formation within the substrate profile of TIM23SORT is consistent with characterization of TIMM50 patient fibroblasts in this study and others.Citation9–13 Although each OXPHOS complex contains laterally inserted substrates, we did not observe any defects in complex III. Our analysis of protein and complex half-lives suggests that this is likely due to the increased half-life of complex III subunits.Citation1,Citation38 Complex V was also largely unaffected by loss of TIMM50 by proteomics, with defects in complex V dimerization only apparent with BN-PAGE analysis. We hypothesize that this is due to the loss of several single-pass transmembrane subunits at the dimerization site, which we predict to be imported via TIM23SORT. Beyond these subunits, we determined that most core complex V subunits are imported via TIM23MOTOR and have extended half-lives, explaining why steady state complex abundances were largely unchanged in the patient.
Models of defective protein import in Timm23 heterozygous knockout mice demonstrate a neurological phenotype consistent with human pathogenic variants in TIMM50.Citation41 Zebrafish timm50 knockdown models also present with severe neurological defects, cellular apoptosis in the central nervous system and cardiac dysmorphia.Citation19 Furthermore, inhibition of the TIM23 complex subunit timm44 in zebrafish triggers increased apoptosis and dilated cardiomyopathy.Citation42 This finding is not dissimilar to Timm50 KO mice that present with cardiac hypertrophy, elevated reactive oxygen species (ROS) and decreased activity of OXPHOS complexes I, II and IV.Citation43 Moreover, antioxidant treatment reduces cardiac hypertrophy in Timm50 KO mice, directly implicating oxidative stress in this pathology.Citation43 The driving mechanism behind ROS generation in TIMM50 disease models is unclear. Our data demonstrating reduced OXPHOS complex abundance and respiration rates upon loss of TIMM50 support a model of ROS generation centered on OXPHOS dysfunction. Indeed, supercomplex assemblies are known to sequester OXPHOS associated ROS production.Citation44,Citation45 Thus, the destabilization of super complexes upon loss of TIMM50 and emergence of increased free respiratory chain complexes despite persistence in individual activities may be indicative of abnormally regulated OXPHOS complexes generating excess ROS species. Alternatively, the absence of TIMM50 at TIM23 complexes may result in constitutively active TIM23 complex leaking ions across the inner-membrane due to the hypothesized role of TIMM50 in controlling the open and closed states of the TIM23 translocases.
In summary, we have used proteomics to create a molecular map of the proteomic consequences that result from loss of functional TIMM50. This molecular map can be refined to help serve as a guide in diagnosis of patients with TIMM50 variants that require further functional support. Importantly, our approach has uncovered novel insight into the fundamental biology suggesting a connection of TIMM50 in the lateral release of inner membrane proteins.
Materials and Methods
Clinical details, genomic sequencing, and variant detection
Samples from the proband and family members were obtained after receiving written, informed consent for diagnostic or research investigations from the responsible human ethics institutional review board (Royal Children’s Hospital HREC 34228) and research was conducted according to the Declaration of Helsinki. Detailed clinical information is available in Supplementary File 1 and Supplementary Table S1.
For the proband, blood DNA was extracted, and exome sequencing (ES) was performed at a clinically accredited laboratory (Victorian Clinical Genetics Services, Melbourne, Australia).Citation46 ES was performed by massively parallel sequencing using a SureSelect QXT CREv2 exome capture kit (Agilent Technologies) on an Illumina instrument with a targeted mean coverage of 100× with a minimum of 90% of bases sequenced to at least 15×. Data were processed using CPipe,Citation47 in order to generate annotated variant calls within the target region (coding exons ± 2 base pairs), via alignment to the reference genome (GRCh37). Variant prioritization by a multidisciplinary team, including clinical geneticists and medical genomics scientists, was phenotype-driven as previously described.Citation46 Segregation of TIMM50 and FDXR variants was performed by PCR and DNA sequencing in blood DNA extracted from the parents.
Cell lines, cell culture, and stable cell line generation
All cell lines were cultured at 37 °C with 5% CO2 in Dulbecco’s Modified Eagle Medium (DMEM) (Thermo Fisher Scientific) containing 1% (vol/vol) penicillin-streptomycin (Thermo Fisher Scientific) and 5–10% (vol/vol) fetal bovine serum (In vitro Technologies). Patient fibroblasts were established from a skin biopsy. Doxycycline-inducible TIMM50WT rescue cell lines in both fibroblasts and HEK293 cells were generated using the Lenti-X Tet-On Inducible Expression System (Takara Bio) as previously described.Citation48 TIMM50WT re-expression was induced with 50 ng/mL doxycycline for 5 days.
For the generation of CRISPR-Cas9 edited cells, HEK Flp-In™ T-REx™ 293 (Thermo Fisher Scientific) were transfected with pSpCas9(sgRNA)-2A-GFP (Addgene #48138) containing a short guide RNA targeting TIMM50 (5′-ACGCTCGTTTTGGAGCTCAC-3′) and single-cell sorted (FACSAriaTM III sorter, BD Biosciences) by GFP fluorescence. Clones were screened via western blotting for TIMM50 and genomically verified by Sanger sequencing of the Cas9 target site.
Mitochondrial isolation and treatments
Mitochondria were isolated via differential centrifugation as previously described.Citation49,Citation50 Briefly, cells were harvested in phosphate-buffered saline (PBS) (137 mM NaCl, 2.7 mM KCl, 10 mM Na2HPO4, 1.8 mM KH2PO4, pH 7.4) and isolated by centrifugation at 500 × g, 4 °C. Cells were homogenized with a Dounce homogenizer in isolation buffer (20 mM HEPES-KOH pH 7.6, 220 mM mannitol, 70 mM sucrose, 1 mM EDTA, 0.5 mM phenylmethylsulfonyl fluoride (PMSF), and 2 mg/mL bovine serum albumin (BSA) (BSA was omitted for downstream assessment involving MSMS)) and centrifuged at 800 × g, 4 °C to remove nuclear debris and intact cells. Supernatant containing mitochondria was isolated and centrifuged at 12,000 × g, 4 °C to isolate the mitochondrial pellet. Mitochondria were resuspended in isolation buffer (omitting PMSF and BSA), with protein concentration determined using the Pierce BCA protein assay kit (Thermo Fisher Scientific). For carbonate extraction, mitochondria were resuspended in freshly prepared 100 mM sodium carbonate and incubated on ice for 30 minutes followed by centrifugation at 100,000 × g and 4 °C for 30 min. Separated pellet and soluble fractions were trichloroacetic acid (TCA) precipitated with 12.5% (wt/vol) TCA and analyzed by SDS-PAGE.
In vitro import assay
NDUFV3, GC-1, PiC, OTC, SURF1, SCO2, TOMM40, TIMM50WT and TIMM50R113C mRNA were synthesized using a mMESSAGE mMACHINE™ SP6 transcription kit (Ambion) and translated in rabbit reticulocyte lysate (Promega) in the presence of [35S]-Methionine/Cysteine (PerkinElmer). Isolated mitochondria (1 mg/mL) in import buffer (250 mM sucrose, 5 mM magnesium acetate, 80 mM potassium acetate, 10 mM sodium succinate, 1 mM DTT, 5 mM ATP, 20 mM HEPES-KOH pH 7.4) were incubated at 37 °C with radiolabeled proteins in the presence or absence of 10 μM carbonyl cyanide-p-trifluoromethoxyphenylhydrazone (FCCP). Following import, reactions were treated on ice with 50 μg/mL proteinase K for 10 min then 1 mM PMSF for 5 min to stop protease activity. For ATP depletion, both radiolabeled protein lysates and mitochondria resuspended in import buffer (without the addition of ATP) were treated with 25 U/mL of apyrase prior to import. For SDS-PAGE analysis, samples were TCA precipitated and solubilized in SDS-PAGE loading buffer before heating at 65 °C for 15 min and 95 °C for 5 min (with shaking). For BN-PAGE analysis, samples were resuspended in 1% digitonin solubilization buffer and prepared for electrophoresis as describe below in BN-PAGE electrophoresis and in-gel activity. Following electrophoresis, gels were transferred to PVDF membrane with radioactive signal captured with a phosphor imager screen and visualized on an Amersham Typhoon Biomolecular Imager (Cytiva).
Radiolabeling of mitochondrial translation products
Radiolabeling of cultured HEK293 cells was conducted as previously described.Citation51,Citation52 Briefly, cells were cultured in Met/Cys-free DMEM (Thermo Fisher Scientific) containing 1% (vol/vol) penicillin-streptomycin (Thermo Fisher Scientific), 10% (vol/vol) dialyzed fetal bovine serum (In vitro Technologies), 1 mM sodium pyruvate (Thermo Fisher Scientific), 1 × GlutaMAX (Thermo Fisher Scientific), 50 μg/mL uridine (Thermo Fisher Scientific), 7 μg/mL anisomycin (Sigma-Aldrich), and 7 μCi [35S]-Methionine/Cysteine (PerkinElmer) for 2 h. Radiolabeling was quenched with 10 μM methionine for 15 min. Labelling media was replaced with standard culturing DMEM for 0, 3, or 24 h. Labelled cells were harvested by centrifugation at 800 × g, 4 °C and pellets stored at −20 °C. 50 µg of isolated mitochondria were analyzed using SDS-PAGE on 10–16% tris-tricine gels. Following electrophoresis, gels were transferred to polyvinylidene fluoride (PVDF) membrane with radioactive signal captured with a phosphor imager screen and visualized on an Amersham Typhoon Biomolecular Imager (Cytiva).
Tricine gel electrophoresis
Tris-tricine gel electrophoresis was performed as previously described.Citation48,Citation53 Briefly, tricine gel buffered solutions (1 M Tris-Cl, 0.1% [wt/vol] Sodium dodecyl sulfate (SDS), pH 8.45) containing either 10 or 16% (vol/vol) acrylamide solution (49.5% acrylamide, 1.5% bis-acrylamide) were used to pour 10–16% gels using a gradient mixer. 16% acrylamide solutions also contained 13% (vol/vol) glycerol. Polymerized gels were overlayed with a 4% (vol/vol) acrylamide tricine gel buffered solution stacking gel. Polymerization of acrylamide containing gels was catalyzed by sequential addition of tetramethylethylenediamine (TEMED) (Sigma) and 10% ammonium persulfate (APS) (Sigma). Electrophoresis was conducted with anode (50 mM Bis-Tris, pH 7.0) and cathode buffers (0.1 M Tris, 0.1 M tricine, 0.1% [wt/vol] SDS, pH 8.45). For assessment via Tris-tricine SDS-PAGE, mitochondria were heated at 95 °C in SDS-loading dye (50 mM Tris-Cl pH 6.8, 100 mM dithiothreitol (DTT), 2% [wt/vol] SDS, 10% [vol/vol] glycerol, 0.1% [wt/vol] bromophenol blue) for 5 min.
BN-PAGE electrophoresis and in-gel activity
For BN-PAGE, mitochondria were solubilized at 1 mg/mL in 1% (wt/vol) digitonin solubilization buffer (20 mM Tris-Cl pH 7.4, 50 mM NaCl, 0.1 mM EDTA and 10% [vol/vol] glycerol) on ice for 30 min. Following clarification by centrifugation, supernatants were combined with blue native loading dye (0.5% [wt/vol] Coomassie blue G-250 (MP Biomedicals), 50 mM α-amino n-caproic acid, 10 mM Bis-Tris pH 7.0) and loaded onto 4–16% acrylamide gradient gels as previously described.Citation48 Electrophoresis was carried out at 4 °C overnight with anode buffer (50 mM Bis-Tris pH 7.0) and cathode buffer (50 mM tricine, 15 mM Bis-Tris, 0.02% [wt/vol] Coomassie blue G250). Cathode buffer was replaced with buffer lacking Coomassie blue G-250 once samples entered the separation gel. For in-gel detection of complex V enzymatic activity, BN-PAGE gels were incubated in staining solution (35 mM Tris, 270 mM glycine, 14 mM MgSO4, 0.2% Pb(NO3)2, 8 mM ATP pH 7.8) overnight and staining captured on a ChemiDoc MP imaging machine.
Immunoblotting and antibodies
Following electrophoresis, gels were transferred to PVDF membrane (0.45 μM Immobilon-P; Merck) with Owl HEP-1 Semidry Electroblotting systems (Thermo Fisher Scientific). Immunoblotting was conducted with horse radish peroxidase-conjugated secondary antibodies (Sigma-Aldrich). Primary antibodies used in this study include: TIMM50 (Proteintech; 22229-1-AP), TIMM23 (BDBiosciences; 611222), TIMM17A (GeneTex; GTX108280), NDUFA9 (Ryan Laboratory, Monash University), UQCRC1 (Abcam; ab110252), COX4I1 (Cell Signaling Technology; 4850), ATP5F1A (Abcam; ab14748), ATP5ME (Abcam; ab122241), MICOS10 (Aviva Systems Biology; ARP44801_P050), MICOS60 (Proteintech; 10179-1-AP), TOMM40 (Santa Cruz; sc-365466), TOMM22 (Santa Cruz; sc-101286), SLC25A6 (Abcam; ab154007), SLC25A12 (Abcam; ab200201) and CYCS (BDBiosciences; 556432). Immunodetection was performed on a ChemiDoc MP imaging machine (BioRad) using Clarity Western ECL Substrate (BioRad). Densitometric Quantification of Western blot signal was performed using the Image Lab software (BioRad) following the manufacturer’s instructions.
Quantitative proteomics and data presentation
Isolated mitochondria were solubilized, reduced, and alkylated in SDC buffer (1% [wt/vol] sodium deoxycholate, 100 mM Tris-Cl pH 8.1, 40 mM chloroacetamide, 10 mM tris(2-carboxyethyl)phosphine (TCEP)) by boiling at 99 °C for 5 min and sonication (Powersonic 603 Ultrasonic Cleaner, 40 KHz on high power) for 15 min at room temperature. Proteins were digested with 1:50 (wt/wt; trypsin:protein) trypsin overnight at 37 °C. Peptide solutions were clarified by centrifugation and loaded onto SDB-RPS substrate (3MTMEmporeTM) stage-tips with isopropanol containing 1% (vol/vol) trifluoroacetic acid (TFA). Stage-tips were washed with isopropanol contaning 1% TFA, then 0.2% (vol/vol) TFA, before elution with 80% (vol/vol) acetonitrile (ACN), 5% (vol/vol) ammonium hydroxide. Eluates were dried by CentriVap SpeedVac concentrator (Labconco) and reconstituted in 0.1% (vol/vol) TFA, 2% (vol/vol) ACN for analysis.
Whole cell pellets were solubilized in 5% (vol/vol) SDS, 50 mM tetraethylammonium bromide (TEAB) pH 8.5 at room temperature and clarified by centrifugation. Solubilizations were loaded onto Micro S-TRAP columns (PROFITI) according to the manufacturer’s instructions with tryptic digests performed overnight with a 1:25 trypsin to protein ratio. Eluates were dried by CentriVap SpeedVac concentrator (Labconco) and reconstituted in 0.1% (vol/vol) TFA, 2% (vol/vol) ACN for analysis.
LC MS/MS was carried out on an OrbiTrap Eclipse Mass Spectrometer (Thermo Fisher Scientific) equipped with an Acclaim Pepmap nanotrap column (Dionex-C18, 100 Å, 75 µm × 2 cm) and Acclaim Pepmap RSLC analytical column (Dionex-C18, 100 Å, 75 µm × 50 cm). Tryptic peptides were injected into the enrichment column at an isocratic flow of 5 µL/min of 2% (vol/vol) ACN containing 0.1% (vol/vol) formic acid for 5 min applied before the enrichment column was switched in line with the analytical column. The eluents were 5% (vol/vol) dimethyl sulfoxide (DMSO) in 0.1% (vol/vol) formic acid (solvent A) and 5% (vol/vol) DMSO in 100% (vol/vol) ACN and 0.1% (vol/vol) formic acid (solvent B). The flow gradient was (i) 0–6 min at 3% B; (ii) 6–7 min, 3–4% B; (iii) 7-82 min, 4–25% B; (iv) 82–86 min, 25–40% B; (v) 86–87 min, 40–80% B; (vi) 87–90 min, 80% B; (vii) 90–95 min, 80% to 3% and equilibrated at 3% B for 10 min before the next sample injection. Full MS resolutions were set to 120,000, scanning from 350–1400 m/z in the profile mode. Full MS automatic gain control (AGC) target was 250% with an IT of 50 ms. AGC target value for fragment spectra was set at 2000%; 50 windows of 13.7 Da were used with an overlap of 1 Da. Resolution was set to 30,000 and maximum IT to 55 ms. Normalized collision energy was set at 30%. All data were acquired in centroid mode using positive polarity.
Raw data were processed with Spectronaut (v 18.1.230626.50606, Sagan) against the UniProt human database (canonical + isoforms, reviewed) acquired in March 2021. Exported protein reports were imported into Perseus (v 1.6.14.0) for statistical analysis. Prior to analysis, potential contaminants were removed with a curated list. Briefly, MS2 quantities were log2 transformed and grouped in sample triplicate. Proteins present in less than two samples within any group were removed. Remaining proteins were annotated with the MitoCarta 3.0 data set. For isolated mitochondria and normalized mitochondrial whole cell analysis, the “subtract row cluster” feature was used for normalization according to MitoCarta 3.0 annotation. Subsequent data sets had non-mitochondrial proteins removed. For all data sets two-sample t tests were performed between groups using P value for truncation (threshold P value < 0.05) and presented as volcano plots using the scatter plot function. For bar chart assessment, unlogged MS2 quantities were presented as percentage of control average with statistical significance calculated by parametric unpaired multiple t tests in GraphPad Prism 9.3.1. For assessment of complex abundance, log2 fold changes of subunits were converted to percentages of control and statistical significance was determined by parametric paired multiple t test. Mitochondrial content was calculated from whole cell proteomic data by summing total MS2 quantities of mitochondrial proteins relative to the sum MS2 quantity of all detected proteins. Statistical significance was determined by parametric paired multiple t test. Topographical mapping of proteomic log2 fold changes was performed as previously described.Citation54 Structures used were as follows: complex I (PDB: 5LDW), complex II (PDB: 1ZOY), complex III (PDB: 1BGY), complex IV (PDB: 5B1A), complex V (PDB: 7AJD).
MSMS data have been deposited to the ProteomeXchange Consortium, via the PRIDE partner repository, with the data set identifier PXD047774
OXPHOS enzymology
Respiratory chain enzyme activities were measured in fibroblasts by spectrophotometry as described,Citation55 using enriched mitochondrial fractions with (CI, CII, CIV and CS) or without (CII + CIII and CIII) hypotonic treatment. CI was measured as rotenone-sensitive NADH:ubiquinone1 oxidoreductase, measuring NADH oxidation at 340 nm. CII activity was measured as succinate:ubiquinone1 oxidoreductase, monitoring ubiquinone1 reduction at 280 nm. CII + CIII was assayed as succinate:cytochrome c reductase, measuring cytochrome c reduction at 550 nm, while CIII was assayed as decylbenzylquinol:cytochrome c reductase, measuring cytochrome c reduction at 550 nm. CIV was measured as cytochrome c oxidase, monitoring cytochrome c oxidation at 550 nm. The citrate synthase (CS) catalyzed production of coenzyme A (CoA.SH) from oxaloacetate was assayed by monitoring the formation of 5-thio-2 nitrobenzoate anions at 412 nm resulting from the spontaneous reaction of free sulfhydryl groups with the thiol reagent 5,5′-dithio-bis-(2-nitobenzoic acid). Enzyme activities were calculated as initial rates (CI, CII, CII + CIII and CS) or as first-order rate constants (CIII and CIV).
Cellular respiration measurement
Cellular oxygen consumption rates (OCR) were measured in a Seahorse Bioscience XFe96 Analyzer according to the manufacturer’s protocols. Briefly, 2.5 × 10⁴ (HEK293) or 1.5 × 10⁴ (fibroblast) cells were plated per well in XFe96 culture plates (pre-treated with poly-D-Lysine) and grown overnight under standard culture conditions. Rates were measured in non-buffered DMEM media (Agilent) containing 10 mM glucose, 1 mM sodium pyruvate and 2 mM glutamine. Measurements consisted of three cycles each of 3 min mix and 3 min measure using the following inhibitors: 2 μM oligomycin; 0.5 μM FCCP; 0.5 μM rotenone and 0.3 μM antimycin A.
Following the assay, cell numbers per well were normalized using CyQuant (Thermo Fisher Scientific). Fibroblast control data are presented as average values of five independent control cell lines. Basal OCR was calculated from the average of all measurements prior to injection of oligomycin. To calculate maximal respiration, either the initial measurement following FCCP addition was used (HEK293) or an average of all measurements (fibroblasts).
mtDNA depletion measurement
DNA was isolated from triplicate cell pellets for each cell line using a Wizard SV gDNA purification kit (Promega). Triplicate qPCR reactions were performed for each sample using TaqMan Platinum qPCR SuperMix-UDG (Thermo Fisher Scientific) with primers and probes specific for MT-ND1 (FAM/BHQ1) and CFTR (HEX/BHQ1) as described previouslyCitation56 in a Roche LC480 real time PCR instrument. Data were analyzed using the LC480 software version 1.5.1.62 SP3 to determine the relative abundance of mtDNA by comparing the amount of the mitochondrial gene MT-ND1 with the single-copy nuclear reference gene CFTR.
Cell imaging
Fibroblasts were seeded onto coverslips and grown overnight. HEK293 cells were seeded on to coverslips coated with 0.01% Poly-L-Lysine (Merck). For live cell imaging, cells were incubated with 50 nM MitoTracker Deep Red (Molecular Probes) and 2 μL/mL PicoGreen (Invitrogen) for 20 min at 37 °C, 5% CO2. Cells were rinsed in DMEM with 10% FBS (Cell Sera), 1% (vol/vol) penicillin/streptomycin prior to mounting coverslips on microscope slides. For immunofluorescence, cells were fixed with 4% paraformaldehyde (Proscitech) diluted in PBS containing 5% (wt/vol) sucrose (Sigma) for 10 min at room temperature. Following fixation, cells were washed with PBS and permeabilized with 0.1% (vol/vol) Triton-X 100 (Sigma) in PBS. Primary antibodies were diluted in PBS containing 3% (wt/vol) BSA (Sigma) and incubated for 1 h at room temperature. Secondary antibody goat anti-mouse AlexaFluor 488 or anti-rabbit AlexaFluor 568 (Invitrogen) was diluted in PBS containing 3% BSA for 1 h at room temperature. Cells were then washed with PBS and stained with Hoechst 33258 (10 μg/mL, Sigma) and mounted on slides with mounting media (0.1 M Tris-Cl pH 8.0, 90% glycerol, 0.2 M 1,4-diazabicyclo[2.2.2]octane (Sigma)). Imaging was performed using a Leica SP8 confocal microscope equipped with 488 and 552 nm 20 mW solid state lasers, a 638 nm 30 mW solid state laser and a Direct Modulation laser diode (DMOD) 405 nm 50 mW laser. Samples were mounted on a 63X HC PL APO CS2 oil lens and images were captured with the Leica LAS X SP8 software. Laser intensity and gain were optimized for each sample. Images were processed using Fiji image analysis software (https://imagej.nih.gov/ij/).
Bioinformatics
Gene effect data and essentiality annotations of TIM23 complex subunits were collected from http://www.depmap.org (accessed: August 25, 2023. CRISPR DepMap Public 23Q2 + Score, Chronos).
Import pathway annotation datasets were manually curated from publicly available data sets. A gene list of inner membrane and matrix localized proteins as determined by MitoCarta 3.0,Citation2 was appended with the indicated datasets: Uniprot, predicted transmembrane domain; Membranome, predicted transmembrane domain; AFTM, predicted number of transmembrane domains; Membranome, bitopic; MitoFates, mitochondrial targeting sequence prediction; N-terminome, presence of cleaved n-terminal sequence.Citation1,Citation57–61 All data were accessed September 1, 2023. After excluding mtDNA encoded proteins, genes were then annotated and sorted according to the parameters outlined in the pipeline. Thresholds for each group were as follows; Transmembrane Domain, yes in either database; Number of transmembrane domains, prioritized Membranome bitopic; MTS or N-Term Cleavage, MitoFates score >0.250 or presence of n-terminal cleavage. Following annotation, pathways predicted to be imported via OXA1L,Citation26,Citation27,Citation62 which was not considered in the pipeline, were manually annotated, and re-assigned. The full annotated data set is included in Supplementary Table S4.
GO biological process enrichment analysis of significantly up and downregulated genes and import pathway gene lists were generated with NIH DAVID functional annotation tool.Citation63,Citation64 GO biological process enrichments with >4 genes and FDR q-value <0.05 were visualized with the Cytoscape plug-in EnrichmentMap.Citation65
Supplemental Material
Download Zip (6.5 MB)Acknowledgments
We thank the patient and family for their participation in this research study. This research was supported by MRFF Genomics Health Futures Mission—2020 Genomics Health Futures Mission Grant Opportunity (MRF2007959) to DS, DRT and DC; NHMRC Ideas Grant (APP2021085) to DS, DRT and AEF; Mito Foundation funding (Booster Grant to DS; large equipment grants to AEF and DRT) and the Victorian Government’s Operational Infrastructure Support Program. DRT was supported by an NHMRC Principal Research Fellowship (GNT1155244) and JC was supported by an Australian Government Research Training Program (RTP) scholarship and by a Mito Foundation PhD Top-Up scholarship. We thank the Biological Optical Microscopy Platform and Bio21 Mass Spectrometry and Proteomics Facility for the provision of instrumentation, training, and technical support.
Disclosure statement
The authors have no conflicts of interest to declare.
Data availability statement
The data sets produced in this study are available in the following databases: Quantitative proteomic MSMS data: PRIDE PXD047774 (http://www.ebi.ac.uk/pride/archive/projects/ PXD047774)
References
- Morgenstern M, Peikert CD, Lübbert P, Suppanz I, Klemm C, Alka O, Steiert C, Naumenko N, Schendzielorz A, Melchionda L, et al. Quantitative high-confidence human mitochondrial proteome and its dynamics in cellular context. Cell Metab. 2021;33:2464–2483.e18.
- Rath S, Sharma R, Gupta R, Ast T, Chan C, Durham TJ, Goodman RP, Grabarek Z, Haas ME, Hung WHW, et al. Mitocarta3.0: an updated mitochondrial proteome now with sub-organelle localization and pathway annotations. Nucleic Acids Res. 2021;49:D1541. doi:10.1093/nar/gkaa1011.
- Anderson AJ, Jackson TD, Stroud DA, Stojanovski D. Mitochondria—hubs for regulating cellular biochemistry: emerging concepts and networks. Open Biol. 2019;9:190126.
- Vögtle F-N, Wortelkamp S, Zahedi RP, Becker D, Leidhold C, Gevaert K, Kellermann J, Voos W, Sickmann A, Pfanner N, et al. Global analysis of the mitochondrial n-proteome identifies a processing peptidase critical for protein stability. Cell. 2009;139:428–439.
- Araiso Y, Tsutsumi A, Qiu J, Imai K, Shiota T, Song J, Lindau C, Wenz L-S, Sakaue H, Yunoki K, et al. Structure of the mitochondrial import gate reveals distinct preprotein paths. Nature. 2019;575:395–401. doi:10.1038/s41586-019-1680-7.
- Callegari S, Cruz-Zaragoza LD, Rehling P. From TOM to the TIM23 complex–handing over of a precursor. Biol Chem. 2020;401:709–721. doi:10.1515/hsz-2020-0101.
- Kang Y, Fielden LF, Stojanovski D. Mitochondrial protein transport in health and disease. Semin Cell Dev Biol. 2018;76:142–153. doi:10.1016/j.semcdb.2017.07.028.
- Baker MJ, Crameri JJ, Thorburn DR, Frazier AE, Stojanovski D. Mitochondrial biology and dysfunction in secondary mitochondrial disease. Open Biol. 2022;12:220274.
- Reyes A, Melchionda L, Burlina A, Robinson AJ, Ghezzi D, Zeviani M. Mutations in TIMM50 compromise cell survival in oxphos-dependent metabolic conditions. EMBO Mol Med. 2018;10:e8698.
- Shahrour MA, Staretz-Chacham O, Dayan D, Stephen J, Weech A, Damseh N, Pri Chen H, Edvardson S, Mazaheri S, Saada A, et al. Mitochondrial epileptic encephalopathy, 3-methylglutaconic aciduria and variable complex v deficiency associated with TIMM50 mutations. Clin Genet. 2017;91:690–696. doi:10.1111/cge.12855.
- Tort F, Ugarteburu O, Texidó L, Gea-Sorlí S, García-Villoria J, Ferrer-Cortès X, Arias Á, Matalonga L, Gort L, Ferrer I, et al. Mutations in TIMM50 cause severe mitochondrial dysfunction by targeting key aspects of mitochondrial physiology. Hum Mutat. 2019;40:1700–1712. doi:10.1002/humu.23779.
- Mir A, Hadab S, Sammak M, Alhazmi R, Housawi Y, Bashir S. Complete resolution of epileptic spasms with vigabatrin in a patient with 3-methylglutaconic aciduria caused by TIMM50 gene mutation. Clin Genet. 2020;98:102–103.
- Moudi M, Vahidi Mehrjardi MY, Hozhabri H, Metanat Z, Kalantar SM, Taheri M, Ghasemi N, Dehghani M. Novel variants underlying autosomal recessive neurodevelopmental disorders with intellectual disability in Iranian consanguineous families. J Clin Lab Anal. 2022;36:e24241.
- Palmer CS, Anderson AJ, Stojanovski D. Mitochondrial protein import dysfunction: mitochondrial disease, neurodegenerative disease and cancer. FEBS Lett. 2021;595:1107–1131. doi:10.1002/1873-3468.14022.
- Frazier AE, Thorburn DR, Compton AG. Mitochondrial energy generation disorders: genes, mechanisms, and clues to pathology. J Biol Chem. 2019;294:5386–5395. doi:10.1074/jbc.R117.809194.
- Geissler A, Chacinska A, Truscott KN, Wiedemann N, Brandner K, Sickmann A, Meyer HE, Meisinger C, Pfanner N, Rehling P. The mitochondrial presequence translocase: an essential role of TIM50 in directing preproteins to the import channel. Cell. 2002;111:507–518. doi:10.1016/S0092-8674(02)01073-5.
- Yamamoto H, Esaki M, Kanamori T, Tamura Y, Nishikawa S-i, Endo T. Tim50 is a subunit of the TIM23 complex that links protein translocation across the outer and inner mitochondrial membranes. Cell. 2002;111:519–528.
- Mokranjac D, Paschen SA, Kozany C, Prokisch H, Hoppins SC, Nargang FE, Neupert W, Hell K. Tim50, a novel component of the TIM23 preprotein translocase of mitochondria. EMBO J. 2003;22:816–825. doi:10.1093/emboj/cdg090.
- Guo Y, Cheong N, Zhang Z, De Rose R, Deng Y, Farber SA, Fernandes-Alnemri T, Alnemri ES. Tim50, a component of the mitochondrial translocator, regulates mitochondrial integrity and cell death*. J Biol Chem. 2004;279:24813–24825.
- Xu H, Somers ZB, Robinson ML, Hebert MD. Tim50a, a nuclear isoform of the mitochondrial Tim50, interacts with proteins involved in snRNP biogenesis. BMC Cell Biol. 2005;6:29.
- Norton M, Ng AC-H, Baird S, Dumoulin A, Shutt T, Mah N, Andrade-Navarro MA, McBride HM, Screaton RA. ROMO1 is an essential redox-dependent regulator of mitochondrial dynamics. Sci Signal. 2014;7:ra10.
- Thorburn DR, Chow CW, Kirby DM. Respiratory chain enzyme analysis in muscle and liver. Mitochondrion. 2004;4:363–375.
- Schägger H, Pfeiffer K. Supercomplexes in the respiratory chains of yeast and mammalian mitochondria. EMBO J. 2000;19:1777–1783.
- Cruciat C-M, Brunner S, Baumann F, Neupert W, Stuart RA. The cytochrome bc1 and cytochrome c oxidase complexes associate to form a single supracomplex in yeast mitochondria. J Biol Chem. 2000;275:18093–18098. doi:10.1074/jbc.M001901200.
- Li Y, D’Aurelio M, Deng J-H, Park J-S, Manfredi G, Hu P, Lu J, Bai Y. An assembled complex IV maintains the stability and activity of complex I in mammalian mitochondria*. J Biol Chem. 2007;282:17557–17562. doi:10.1074/jbc.M701056200.
- Stiller Sebastian B, Höpker J, Oeljeklaus S, Schütze C, Schrempp Sandra G, Vent-Schmidt J, Horvath Susanne E, Frazier Ann E, Gebert N, van der Laan M, et al. Mitochondrial oxa translocase plays a major role in biogenesis of inner-membrane proteins. Cell Metab. 2016;23:901–908. doi:10.1016/j.cmet.2016.04.005.
- Bohnert M, Rehling P, Guiard B, Herrmann JM, Pfanner N, van der Laan M. Cooperation of stop-transfer and conservative sorting mechanisms in mitochondrial protein transport. Curr Biol. 2010;20:1227–1232. doi:10.1016/j.cub.2010.05.058.
- He J, Carroll J, Ding S, Fearnley IM, Montgomery MG, Walker JE. Assembly of the peripheral stalk of ATP synthase in human mitochondria. Proc Natl Acad Sci USA. 2020;117:29602–29608. doi:10.1073/pnas.2017987117.
- Carroll J, He J, Ding S, Fearnley IM, Walker JE. TMEM70 and TMEM242 help to assemble the rotor ring of human ATP synthase and interact with assembly factors for complex I. Proc Natl Acad Sci USA. 2021;118:e2100558118. doi:10.1073/pnas.2100558118.
- Blum TB, Hahn A, Meier T, Davies KM, Kühlbrandt W. Dimers of mitochondrial ATP synthase induce membrane curvature and self-assemble into rows. Proc Natl Acad Sci USA. 2019;116:4250–4255. doi:10.1073/pnas.1816556116.
- Eramo MJ, Lisnyak V, Formosa LE, Ryan MT. The ‘mitochondrial contact site and cristae organising system’ (MICOS) in health and human disease. J Biochem. 2020;167:243–255. doi:10.1093/jb/mvz111.
- Tang J, Zhang K, Dong J, Yan C, Hu C, Ji H, Chen L, Chen S, Zhao H, Song Z. Sam50-Mic19-Mic60 axis determines mitochondrial cristae architecture by mediating mitochondrial outer and inner membrane contact. Cell Death Differ. 2020;27:146–160. doi:10.1038/s41418-019-0345-2.
- Chapman J, Ng YS, Nicholls TJ. The maintenance of mitochondrial DNA integrity and dynamics by mitochondrial membranes. Life (Basel). 2020;10.
- Li H, Ruan Y, Zhang K, Jian F, Hu C, Miao L, Gong L, Sun L, Zhang X, Chen S, et al. Mic60/mitofilin determines MICOS assembly essential for mitochondrial dynamics and mtDNA nucleoid organization. Cell Death Differ. 2016;23:380–392. doi:10.1038/cdd.2015.102.
- Liu T, Stephan T, Chen P, Keller-Findeisen J, Chen J, Riedel D, Yang Z, Jakobs S, Chen Z. Multi-color live-cell STED nanoscopy of mitochondria with a gentle inner membrane stain. Proc Natl Acad Sci USA. 2022;119:e2215799119. doi:10.1073/pnas.2215799119.
- Stephan T, Brüser C, Deckers M, Steyer AM, Balzarotti F, Barbot M, Behr TS, Heim G, Hübner W, Ilgen P, et al. Micos assembly controls mitochondrial inner membrane remodeling and crista junction redistribution to mediate cristae formation. EMBO J. 2020;39:e104105.
- Bezawork-Geleta A, Wen H, Dong L, Yan B, Vider J, Boukalova S, Krobova L, Vanova K, Zobalova R, Sobol M, et al. Alternative assembly of respiratory complex II connects energy stress to metabolic checkpoints. Nat Commun. 2018;9:2221.
- Karunadharma PP, Basisty N, Chiao YA, Dai D-F, Drake R, Levy N, Koh WJ, Emond MJ, Kruse S, Marcinek D, et al. Respiratory chain protein turnover rates in mice are highly heterogeneous but strikingly conserved across tissues, ages, and treatments. FASEB J. 2015;29:3582–3592. doi:10.1096/fj.15-272666.
- Aguer C, Gambarotta D, Mailloux RJ, Moffat C, Dent R, McPherson R, Harper M-E. Galactose enhances oxidative metabolism and reveals mitochondrial dysfunction in human primary muscle cells. PLoS One. 2011;6:e28536. [Database] doi:10.1371/journal.pone.0028536.
- Schendzielorz AB, Schulz C, Lytovchenko O, Clancy A, Guiard B, Ieva R, van der Laan M, Rehling P. Two distinct membrane potential–dependent steps drive mitochondrial matrix protein translocation. J Cell Biol. 2016;216:83–92.
- Ahting U, Floss T, Uez N, Schneider-Lohmar I, Becker L, Kling E, Iuso A, Bender A, de Angelis MH, Gailus-Durner V, et al. Neurological phenotype and reduced lifespan in heterozygous Tim23 knockout mice, the first mouse model of defective mitochondrial import. Biochim Biophys Acta. 2009;1787:371–376.
- Miyata N, Tang Z, Conti MA, Johnson ME, Douglas CJ, Hasson SA, Damoiseaux R, Chia-En AC, Koehler CM. Adaptation of a genetic screen reveals an inhibitor for mitochondrial protein import component Tim44. J Biol Chem. 2017;292:5429–5442. doi:10.1074/jbc.M116.770131.
- Tang K, Zhao Y, Li H, Zhu M, Li W, Liu W, Zhu G, Xu D, Peng W, Xu Y. Translocase of inner membrane 50 functions as a novel protective regulator of pathological cardiac hypertrophy. J Am Heart Assoc. 2017;6:e004346.
- Lopez-Fabuel I, Le Douce J, Logan A, James AM, Bonvento G, Murphy MP, Almeida A, Bolaños JP. Complex I assembly into supercomplexes determines differential mitochondrial ROS production in neurons and astrocytes. Proc Natl Acad Sci USA. 2016;113:13063–13068. doi:10.1073/pnas.1613701113.
- Maranzana E, Barbero G, Falasca AI, Lenaz G, Genova ML. Mitochondrial respiratory supercomplex association limits production of reactive oxygen species from complex I. Antioxid Redox Signaling. 2013;19:1469–1480. doi:10.1089/ars.2012.4845.
- Stark Z, Dashnow H, Lunke S, Tan TY, Yeung A, Sadedin S, Thorne N, Macciocca I, Gaff C, Oshlack A, et al. A clinically driven variant prioritization framework outperforms purely computational approaches for the diagnostic analysis of singleton WES data. Eur J Hum Genet. 2017;25:1268–1272.
- Sadedin SP, Dashnow H, James PA, Bahlo M, Bauer DC, Lonie A, Lunke S, Macciocca I, Ross JP, Siemering KR, et al. Cpipe: a shared variant detection pipeline designed for diagnostic settings. Genome Med. 2015;7:68.
- Anderson AJ, Crameri JJ, Ang C-S, Malcolm TR, Kang Y, Baker MJ, Palmer CS, Sharpe AJ, Formosa LE, Ganio K, et al. Human Tim8a, Tim8b and Tim13 are auxiliary assembly factors of mature complex IV. EMBO Rep. 2023;24:e56430. doi:10.15252/embr.202256430.
- Johnston AJ, Hoogenraad J, Dougan DA, Truscott KN, Yano M, Mori M, Hoogenraad NJ, Ryan MT. Insertion and assembly of human Tom7 into the preprotein translocase complex of the outer mitochondrial membrane. J Biol Chem. 2002;277:42197–42204.
- Jackson TD, Crameri JJ, Muellner-Wong L, Frazier AE, Palmer CS, Formosa LE, Hock DH, Fujihara KM, Stait T, Sharpe AJ, et al. Sideroflexin 4 is a complex I assembly factor that interacts with the MCIA complex and is required for the assembly of the ND2 module. Proc Natl Acad Sci USA. 2022;119:e2115566119. doi:10.1073/pnas.2115566119.
- Formosa LE, Hofer A, Tischner C, Wenz T, Ryan MT. Translation and assembly of radiolabeled mitochondrial DNA-encoded protein subunits from cultured cells and isolated mitochondria. Methods Mol Biol. 2016;1351:115–129.
- Formosa LE, Muellner-Wong L, Reljic B, Sharpe AJ, Jackson TD, Beilharz TH, Stojanovski D, Lazarou M, Stroud DA, Ryan MT. Dissecting the roles of mitochondrial complex I intermediate assembly complex factors in the biogenesis of complex I. Cell Rep. 2020;31:107541.
- Schägger H, von Jagow G. Tricine-sodium dodecyl sulfate-polyacrylamide gel electrophoresis for the separation of proteins in the range from 1 to 100 kda. Anal Biochem. 1987;166:368–379.
- Stroud DA, Surgenor EE, Formosa LE, Reljic B, Frazier AE, Dibley MG, Osellame LD, Stait T, Beilharz TH, Thorburn DR, et al. Accessory subunits are integral for assembly and function of human mitochondrial complex I. Nature. 2016;538:123–126. doi:10.1038/nature19754.
- Frazier AE, Thorburn DR. Biochemical analyses of the electron transport chain complexes by spectrophotometry. Methods Mol Biol. 2012;837:49–62. doi:10.1007/978-1-61779-504-6_4.
- Pagnamenta AT, Taanman JW, Wilson CJ, Anderson NE, Marotta R, Duncan AJ, Bitner-Glindzicz M, Taylor RW, Laskowski A, Thorburn DR, et al. Dominant inheritance of premature ovarian failure associated with mutant mitochondrial DNA polymerase gamma. Hum Reprod. 2006;21:2467–2473.
- Calvo SE, Julien O, Clauser KR, Shen H, Kamer KJ, Wells JA, Mootha VK. Comparative analysis of mitochondrial n-termini from mouse, human, and yeast. Mol Cell Proteomics. 2017;16:512–523.
- Fukasawa Y, Tsuji J, Fu SC, Tomii K, Horton P, Imai K. Mitofates: improved prediction of mitochondrial targeting sequences and their cleavage sites. Mol Cell Proteomics. 2015;14:1113–1126.
- Pei J, Cong Q. AFTM: a database of transmembrane regions in the human proteome predicted by alphafold. Database (Oxford). 2023;2023.
- Lomize AL, Hage JM, Pogozheva ID. Membranome 2.0: database for proteome-wide profiling of bitopic proteins and their dimers. Bioinformatics. 2018;34:1061–1062. doi:10.1093/bioinformatics/btx720.
- Lomize AL, Lomize MA, Krolicki SR, Pogozheva ID. Membranome: a database for proteome-wide analysis of single-pass membrane proteins. Nucleic Acids Res. 2017;45:D250–D255.
- Homberg B, Rehling P, Cruz-Zaragoza LD. The multifaceted mitochondrial OXA insertase. Trends Cell Biol. 2023;33:765–772. doi:10.1016/j.tcb.2023.02.001.
- Huang da W, Sherman BT, Lempicki RA. Systematic and integrative analysis of large gene lists using DAVID bioinformatics resources. Nat Protoc. 2009;4:44–57. doi:10.1038/nprot.2008.211.
- Sherman BT, Hao M, Qiu J, Jiao X, Baseler MW, Lane HC, Imamichi T, Chang W. A web server for functional enrichment analysis and functional annotation of gene lists (2021 update). Nucleic Acids Res. 2022;50:W216–W221.
- Merico D, Isserlin R, Stueker O, Emili A, Bader GD. Enrichment map: a network-based method for gene-set enrichment visualization and interpretation. PLoS One. 2010;5:e13984.
- Varadi M, Anyango S, Deshpande M, Nair S, Natassia C, Yordanova G, Yuan D, Stroe O, Wood G, Laydon A, et al. Alphafold protein structure database: massively expanding the structural coverage of protein-sequence space with high-accuracy models. Nucleic Acids Res. 2021;50:D439–D444. doi:10.1093/nar/gkab1061.
- Jumper J, Evans R, Pritzel A, Green T, Figurnov M, Ronneberger O, Tunyasuvunakool K, Bates R, Žídek A, Potapenko A, et al. Highly accurate protein structure prediction with alphafold. Nature. 2021;596:590–596.