
Abstract
The protein tyrosine phosphatase Src homology region 2 domain-containing phosphatase-1 (SHP-1) plays an important role in modulating glucose and lipid homeostasis. We previously suggested a potential role of SHP-1 in the regulation of peroxisome proliferator-activated receptor γ2 (PPARγ2) expression and activity but the mechanisms were unexplored. PPARγ2 is the master regulator of adipogenesis, but how its activity is regulated by tyrosine phosphorylation is largely unknown. Here, we found that SHP-1 binds to PPARγ2 primarily via its N-terminal SH2-domain. We confirmed the phosphorylation of PPARγ2 on tyrosine-residue 78 (Y78), which was reduced by SHP-1 in vitro resulting in decreased PPARγ2 stability. Loss of SHP-1 led to elevated, agonist-induced expression of the classical PPARγ2 targets FABP4 and CD36, concomitant with increased lipid content in cells expressing PPARγ2, an effect blunted by abrogation of PPARγ2 phosphorylation. Collectively, we discovered that SHP-1 affects the stability of PPARγ2 through dephosphorylation thereby influencing adipogenesis.
Introduction
The Src homology region 2 domain-containing phosphatase-1, (SHP-1) (also known as protein tyrosine phosphatase non-receptor type 6 (PTPN6)) regulates signal transduction by dephosphorylating phospho-tyrosine residues on its target proteins. SHP-1 is mostly known for its role in hematopoietic cellsCitation1–3 where it negatively regulates signaling mediated by cytokine receptors such as interleukin-3 receptor, erythropoietin receptor, colony-stimulating factor 1 receptor, and T cell/B cell antigen receptor.Citation4 In addition to its established impact on immune cells, SHP-1 is also expressed in nonhematopoietic cells such as intestinal epithelial cells,Citation5,Citation6 myocytes,Citation6 adipocytes,Citation7 and hepatocytes,Citation8,Citation9 where it regulates receptor tyrosine kinases,Citation10 epidermal growth factor receptor,Citation11 insulin receptor substrate-1 (IRS-1), and carcinoembryonic antigen-related cell adhesion molecule 1 (CEACAM1).Citation12
SHP-1 possesses two N-terminally located SH2 domains, a single phosphatase domain and a C-terminal tail.Citation13 The C-terminal tail of SHP-1 possesses multiple tyrosine and serine residues harboring regulatory functions.Citation14 The structural and molecular analysis of SHP-1 has revealed that its enzymatic function is regulated by structural rearrangement of the SH2 domains, which by binding to the catalytic domain keep the phosphatase inactive.Citation15 The catalytic block is lifted when the SH2-domains interact with phosphotyrosine residues in target proteins, which are then transferred to the C-terminal catalytic domain for dephosphorylation.Citation13
Peroxisome proliferator-activated receptor γ (PPARγ), a member of the nuclear hormone receptor superfamily, is a ligand-activated transcription factor that forms a heterodimer with retinoid X receptor α (RXRα) and then binds to its consensus sequence called PPAR responsive element on the DNA to activate transcription.Citation16–18 Several natural ligands such as polyunsaturated fatty acidsCitation19, eicosanoidsCitation20 and synthetic ligands including thiazolidinediones like rosiglitazoneCitation21 are known to activate PPARγ.Citation22,Citation23 In addition, the activity of PPARγ is modulated by several posttranslational modifications such as phosphorylationCitation24,Citation25, SUMOylationCitation26–28 and ubiquitination.Citation29,Citation30
PPARγ is expressed predominantly in adipose tissue,Citation31 in immune cells,Citation32 and to a lower extent in other metabolic tissues such as the liver.Citation33 In adipose tissue, PPARγ plays a key role in lipid metabolism and adipocyte differentiation. For instance, fibroblasts that lack PPARγ are not able to mature into mature adipocytes.Citation34 In addition to lipid metabolism, PPARγ is also known to modulate glucose metabolism, inflammation and cell proliferation, and its functions are organ and context dependent.Citation33 In liver, increased expression of PPARγ has been shown to lead to increased lipid accretion and hepatic steatosis.Citation35,Citation36
Previously, we have shown that SHP-1 modulates PPARγ activity, but the underlying molecular mechanisms remain elusive.Citation9 Herein, we demonstrate that SHP-1 interacts with PPARγ2 to promote its dephosphorylation, which results in its degradation and subsequently in altered expression of adipogenic genes. Taken together, our data reveal a relationship between SHP-1 and PPARγ2 adding an additional opportunity to exploit this novel regulation for exploring new therapeutic strategies for limiting fat accretion in obesity.
Results
SHP-1 interacts with PPARγ2
We first determined whether SHP-1 is expressed in the same subcellular compartment as the nuclear transcription factor PPARγ and found the presence of both proteins in the nucleus of HepG2 and differentiated 3T3-L1 adipocytes (Supplementary material, Figure S1A to C). This prompted us to investigate the molecular mechanisms by which SHP-1 regulates PPARγ. We first tested whether these proteins physically interact in vitro. Co-expression of FLAG-SHP-1 and MYC-PPARγ2 constructs in NIH3T3 cells, followed by immunoprecipitation of FLAG-SHP-1 indeed revealed an interaction between SHP-1 and PPARγ2 (). Furthermore, the binding of SHP-1 to PPARγ2 was unaffected by treatment of NIH3T3 cells with the PPARγ2 agonist rosiglitazone ( and ), indicating that this interaction is not ligand-dependent.
Figure 1. SHP-1 interacts with PPARγ mainly through the SH2 domains. (A) NIH3T3 cells were transfected with the indicated plasmids and were either treated with DMSO or 100 nM rosiglitazone for 1 h. Cell lysates were immunoprecipitated using anti-FLAG M2 beads. The expression of respective proteins was determined by western blot analysis using the indicated antibodies (representative of two independent experiments). (B) Quantification of immunoprecipitated Myc-PPARγ2 and FLAG-SHP-1 was performed by densitometry using ImageJ (N = 2). (C) Schematic representation of various SHP-1 constructs generated via recombinant DNA technology. (D) HepG2 cells were transfected with the indicated plasmids and cell lysates were immunoprecipitated using anti-FLAG M2 beads. The expression of respective proteins was determined by western blot analysis using the indicated antibodies (representative of two independent experiments). (E) Quantification of immunoprecipitated Myc-PPARγ2 and FLAG-SHP-1 constructs was performed by densitometry using ImageJ software (N = 2). (F) HepG2 cells were transfected with the indicated plasmids and cell lysates were immunoprecipitated using anti-FLAG M2 beads. The expression of respective proteins was determined by western blot analysis using the indicated antibodies (representative of three independent experiments). (G) Quantification of immunoprecipitated Myc-PPARγ2 and GFP-FLAG3 SH2 domain constructs was performed by densitometry using ImageJ software (N = 3). IP: immunoprecipitation, WCE: whole cell extracts.
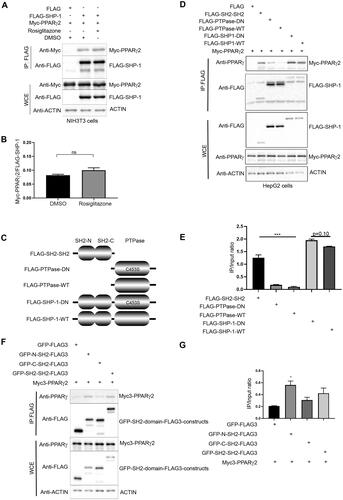
After establishing that SHP-1 interacts with PPARγ2, we asked which domain of SHP-1 is responsible for this interaction. We generated SHP-1 constructs expressing either a FLAG-tagged N-terminal fragment containing only the two SH2-domains (SH2-SH2) or two FLAG-tagged C-terminal fragments without the SH2-domains, but carrying the phosphatase domain in its wild-type (PTPase WT) or substrate-trapping, dominant negative (PTPase DN, C453S mutation) form (). FLAG-immunoprecipitations from HepG2 cells co-transfected with these SHP-1 fragments or full-length WT or DN SHP-1 and Myc-PPARγ2 showed a slight, but not significant increase in the interaction of PPARγ2 with full-length DN compared to WT SHP-1 (). A similar finding was observed with an additional substrate-trapping mutant (SHP-1 D419A) (Supplementary material, Figure S2A and B). Deletion of the N-terminus of SHP-1 strongly reduced the association between PPARγ2 and SHP-1, but the DN form of the PTPase domain still bound better to PPARγ2 than the WT version ( and ). The N-terminal fragment retained the interaction with PPARγ2 at a similar level as full-length SHP-1 ( and ) indicating that SHP-1 mainly interacts with PPARγ2 via its SH2-domains. To further dissect whether the N-terminal SH2 (N-SH2) or C-terminal SH2 (C-SH2) domain is responsible for interaction with PPARγ2, we generated C-terminally FLAG-tagged GFP-SH2 domain fusions containing either N-SH2-, C-SH2- or both SH2-domains, because the N-SH2 domain tagged only with FLAG-epitopes was unstable (data not shown). FLAG-immunoprecipitations from HepG2 cells co-transfected with these GFP fusion constructs and Myc-PPARγ2 showed that PPARγ2 interacted mainly with the N-SH2 domain ( and ).
Collectively these findings show that PPARγ2 is a novel binding partner of SHP-1 and that the interaction is independent of PPARγ2 activation.
SHP-1 dephosphorylates PPARγ2
Next, we investigated whether PPARγ2, which has been shown to be tyrosine-phosphorylated,Citation37 could be a substrate of SHP-1 in vitro. To confirm the tyrosine-phosphorylation of PPARγ2, cells were transfected with a FLAG-PPARγ2 construct and were either left untreated or treated with the general tyrosine phosphatase inhibitor bpV(HOpic) for 30 min. Immunoprecipitated PPARγ2 was strongly tyrosine-phosphorylated as detected with phosphotyrosine-specific antibodies after bpV(HOpic)-treatment (). To determine whether SHP-1 could directly dephosphorylate PPARγ2 we performed in vitro dephosphorylation assays. Phosphorylated Myc-PPARγ2 was immunoprecipitated as substrate from transiently transfected cells treated with bpV(HOpic) as described above. This substrate was incubated with FLAG-SHP-1-WT or FLAG-SHP-1-DN proteins eluted from FLAG-immunoprecipitates of transfected cells. As a negative control, eluates from cells transfected with an empty FLAG-vector and as a positive control recombinant lambda-phosphatase were included in the experiment. Similar to lambda phosphatase, SHP-1 WT, but not SHP-1 DN was able to dephosphorylate PPARγ2. Overall, these results indicate that SHP-1 interacts with PPARγ2 and that SHP-1 efficiently dephosphorylates PPARγ2 ( and ).
Figure 2. SHP-1 dephosphorylates PPARγ2 in vitro. (A) HEK293T cells were transfected with an empty FLAG-vector or a FLAG-PPARg2 plasmid. After 24 h cells were treated with bpV(HOpic) (20 μM) for 30 min. Lysates were immunoprecipitated with anti-FLAG beads and analyzed by western blot analysis using respective antibodies. IP: immunoprecipitation, WCE: whole cell extracts, 4G10/PY20: mix of phosphotyrosine-specific antibodies (N = 3). (B) HEK293T cells were transfected with FLAG empty vector, FLAG-SHP-1-WT, FLAG-SHP-1-DN or Myc-PPARg2 plasmids. After 24 h cells were either left untreated or treated with 20 µM bpV(HOpic) for 30 min. Myc-precipitated, tyrosine-phosphorylated Myc-PPARγ2 was used as substrate and incubated for 30 min at 37 °C with FLAG, FLAG-SHP-1-WT or FLAG-SHP-1-DN eluted from FLAG-beads after FLAG-precipitation or with recombinant λ phosphatase. Tyrosine-phosphorylation of Myc-PPARγ2 was determined by western blot analysis using phosphotyrosine-specific antibodies to measure SHP-1 activity. The expression of respective Myc- and FLAG-constructs was verified by immunoblotting of whole cell extracts with the indicated antibodies (WT: wild-type, DN: dominant negative). (Representative of three independent experiments.) (C) Quantification of levels of phosphotyrosine Myc-PPARγ2 and total Myc-PPARγ2 was performed by densitometry using ImageJ software (N = 3). (D) NIH3T3 cells were either transfected with V5 empty vector, PTP1B-V5, SHP-1-V5 or FLAG-PPARg2 constructs. After 24 h cells were either left untreated or treated with 20 µM bpV(HOpic) for 30 min. FLAG-PPARγ2 eluted from FLAG-agarose beads was used as substrate and incubated with V5-precipitated V5, PTP1B-V5 or SHP-1-V5 at 37 °C for 30 min. Tyrosine-phosphorylation of FLAG-PPARγ2 was determined by western blotting using phospho-tyrosine specific antibodies to measure PTP1B and SHP-1 activity. The expression of respective V5- and FLAG-constructs was verified by immunoblotting of whole cell extracts with the indicated antibodies. (Representative of three independent experiments.) (E) Quantification of levels of phospho-tyrosine FLAG-PPARγ2 and total FLAG-PPARγ2 was performed by densitometry using ImageJ software (N = 3). (F) V5, SHP-1-V5 or PTP1B-V5 immunoprecipitates were incubated with DiFMUP (6,8-difluoro-4-methylumbelliferyl phosphate) substrate. Reaction was performed at 37 °C for 30 min. Phosphatase activity was assessed by measuring fluorescence at 455 nm (setting: Ex 358/Em 455) (N = 2). IP: immunoprecipitation, WCE: whole cell extracts.
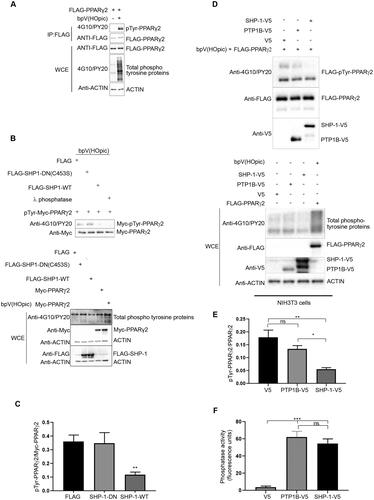
Previously, protein tyrosine phosphatase 1B (PTP1B) has been implicated in PPARγ dephosphorylation.Citation25 Our dephosphorylation assay performed with phosphorylated PPARγ2 as substrate and SHP-1 and PTP1B as enzymes immunoprecipitated and purified from transfected cells revealed that SHP-1 dephosphorylated PPARγ2 in vitro to a greater extent than PTP1B ( and ). SHP-1 and PTP1B used in the dephosphorylation assay were equally efficient in dephosphorylating a non-specific tyrosine-phosphatase substrate (DifMUP) ruling out that the difference in the dephosphorylation of PPARγ2 was only due to reduced PTP1B-activity (). Together, these results suggest SHP-1 as a major phosphatase regulating the tyrosine phosphorylation status of PPARγ2, although additional phosphatases like PTP1B might contribute to this effect.
SHP-1 modulates PPARγ2 stability
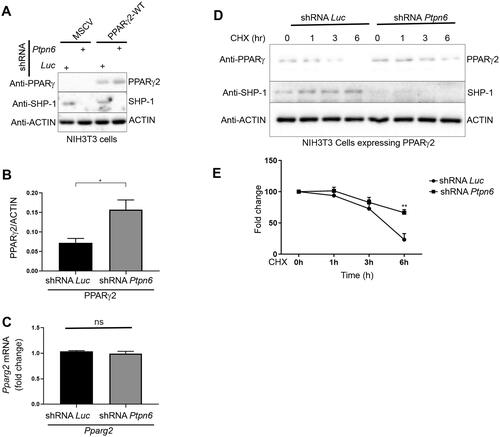
Next, we wanted to examine the functional relationship between SHP-1 and PPARγ2 in more details. We generated 3T3-L1 cells with a SHP-1 knock down (KD) and control cells by using lentivirus-encoded shPtpn6 and shScramble shRNAs. During differentiation of these cells into adipocytes, SHP-1 and PPARγ protein levels in control cells concomitantly increased implying a co-regulation of the two proteins. PPARγ protein levels showed a small increase at day 5 and 7 in SHP-1 KD cells compared to control cells as well as mRNA levels at day 7 (Supplementary material, Figure S3A to D). These results suggest that SHP-1 influences PPARγ-stability, but might also play a role in its transcriptional regulation, which would corroborate our previous data showing an increase of PPARγ-transcripts in livers of high fat fed mice with a hepatocyte-specific SHP-1 knockout compared to their wild-type counterparts.Citation9 To analyze more specifically the posttranslational regulation of PPARγ through SHP-1, we exogenously expressed PPARγ2 in HepG2 and NIH3T3 cells ( and ). While HepG2 cells failed to respond to PPARγ2 overexpression with and without rosiglitazone treatment (), NIH3T3 cells displayed a robust induction of classical PPARγ target genes (CD36 and FABP4) in the presence of PPARγ2, an effect that was further increased after treatment with rosiglitazone (). Therefore, we chose NIH3T3 cells for the following experiments. We generated NIH3T3 cells overexpressing PPARγ2 using retroviral transduction and knocked down (KD) SHP-1 in these and control cells using lentivirus encoded Ptpn6 shRNA (). Depletion of SHP-1 resulted in a slight increase of PPARγ2 protein expression ( and ), which was not due to higher transcription, since there was no significant difference in the Pparg2 transcript levels between SHP-1 WT and KD cells (). To corroborate these data, we measured PPARγ2 stability in control or SHP-1 depleted cells exposed to the protein synthesis inhibitor cycloheximide. Whereas the half-life of PPARγ2 was observed to be 4–4.5 h and it was almost fully degraded after 6 h in SHP-1 WT cells, loss of SHP-1 significantly reduced PPARγ2 degradation, which led to less than 50% decrease of PPARγ2 even after 6 h ( and ). Although we did not observe the same significant increase in PPARγ2 levels in SHP-1 KD during 3T3-L1 adipocyte differentiation as in SHP-1 KD NIH3T3 cells, which might be explained by cell type-specific variations, together, these results show that SHP-1 controls PPARγ2 stability.
Figure 3. CD36 and FABP4 transcript levels are increased in NIH3T3, but not HepG2 cells in response to rosiglitazone treatment after overexpression of PPARγ2. (A, C) HepG2 cells and (B, D). NIH3T3 cells were transfected with either FLAG empty vector or FLAG-PPARg2. After 24 h cells were treated either with DMSO or rosiglitazone (100 nM) for 16 h. Expression of indicated proteins was determined by western blot analysis (A and B) using respective antibodies. The amounts of CD36 and FABP4 transcripts were evaluated by qPCR (C and D) (N = 3).
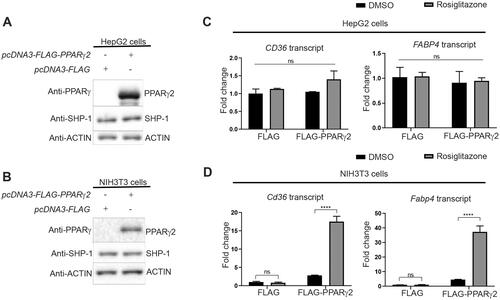
Figure 4. SHP-1 modulates PPARγ2 stability. (A) NIH3T3 cells were infected with retrovirus encoding empty vector (MSCV) or Pparg2. In addition, cells were transduced with lentivirus containing shRNA-control (Luc) or shRNA-Ptpn6. The expression of the indicated proteins was determined by western blotting. (B) Quantification of PPARγ2 amounts was performed by densitometry using ImageJ software (N = 3). (C) Pparg2 transcript levels were quantified by qPCR (N = 3). (D) NIH3T3 cells overexpressing Pparg2 in SHP-1-WT (shRNA Luc) and SHP-1-KD (shRNA Ptpn6) background were treated with cycloheximide (CHX) for the indicated times. The expression of respective proteins was determined by western blotting (N = 2). (E) Quantification of PPARγ2 levels was performed by densitometry using ImageJ software (N = 2).
SHP-1 regulates PPARγ2-mediated adipogenesis
Finally, we analyzed the molecular mechanisms and functional effects of the SHP-1-regulated PPARγ2 stability on PPARγ2 activity. Previously, the tyrosine residue 78 (Y78) has been identified as the major site for tyrosine-phosphorylation in PPARγ2 and Y78 phosphorylation increased the stability of PPARγ2 in HEK293-cells by reducing ubiquitin-dependent degradation.Citation25,Citation37 In agreement to these previous findings, we found that the protein amount of a PPARγ2-Y78F mutant, in which the tyrosine 78 is replaced by the non-phosphorylatable phenylalanine, was much lower than PPARγ2-WT in NIH3T3-cells, despite no differences in the transcript levels of these two constructs (Supplementary material, Figure 4A and B). However, treatment of these cells with the proteasome inhibitor MG132 restored the stability of the PPARγ2-Y78F mutant to PPARγ2-WT levels (Supplementary material, Figure 4C and D) supporting the previous finding that Y78 is the main site regulating PPARγ2 stability and that repressing Tyr phosphorylation promotes PPARγ2 degradation by the proteasome.
To determine whether Y78 residue undergoes phosphorylation in NIH3T3 cells, we treated NIH3T3 cells expressing wild-type PPARγ2 or mutant PPARγ2 (Y78F) with the proteasome inhibitor MG132 to stabilize PPARγ2 protein levels as well as bpV(HOpic) and immunoprecipitated PPARγ2. We observed that levels of tyrosine phosphorylated PPARγ2 were significantly lower in the Y78F mutant compared to wild-type PPARγ indicating that Y78 is the main residue undergoing tyrosine phosphorylation in NIH3T3 cells ().
Figure 5. SHP-1 regulates PPARγ2-mediated adipogenesis through tyrosine residue 78. (A) NIH3T3 cells overexpressing Pparg2 and Pparg2 (Y78F) in SHP-1-WT background were treated with 20 µM MG132 for 1 h. During the last 30 min of MG132 incubation, cells were treated with 20 µM of bpV(HOpic). Protein lysates were prepared and immune-precipitated using a PPARγ-specific antibody. Expression of indicated proteins was determined by western blot analysis using respective antibodies (N = 2). (B) Knockdown (KD) of SHP-1 in NIH3T3 cells stably expressing PPARγ2-WT or PPARγ2-Y78F using lentiviral-mediated shRNA transduction. Expression of indicated proteins was confirmed by western blot analysis (N = 2). (C–E) mRNA levels of Pparg2 (C), Fabp4 (D) and Cd36 (E) were determined by qPCR in NIH3T3 SHP-1-WT or -KD cells stably transduced with empty vector (Control), PPARγ2-WT or -Y78F. Cells were treated with either DMSO or 100 nM rosiglitazone for 16 h (N = 3). (F) NIH3T3 cells with or without knockdown of SHP-1 stably expressing either control retroviral vector, PPARγ2-WT or -Y78F were cultured to confluence and then treated with rosiglitazone (100 nM). On day 10, cells were fixed and lipid content was determined by oil red O staining. (G) Quantification of oil red O-staining from cells shown in . Oil red O-stained NIH3T3 cells were dissolved in isopropanol and intracellular lipid content was quantified by measuring absorbance at 500 nm (N = 3). (H) Model depicting the control of PPARγ2 activity by SHP-1. This figure was partly generated using Servier Medical Art (https://smart.servier.com), provided by Servier, licensed under a Creative Commons Attribution 3.0 unported license.
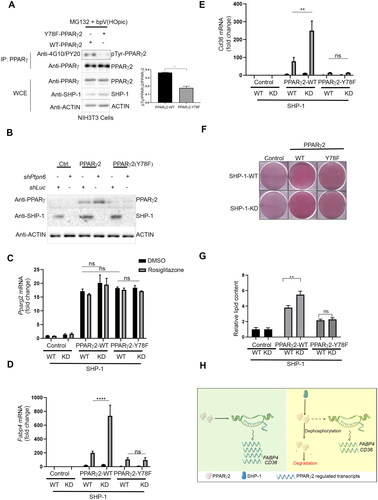
To understand the role of Y78 in SHP-1-controlled PPARγ2 stability, we compared NIH3T3 cells overexpressing PPARγ2-WT or the PPARγ2-Y78F mutant in the SHP-1-WT and SHP-1-KD background (). As before, we found higher levels of PPARγ2-WT in SHP-1 depleted cells and low amounts of PPARγ2-Y78F in SHP-1-WT cells. Interestingly, the PPARγ2-Y78F levels were unaffected by the loss of SHP-1 suggesting that the SHP-1 mediated regulation of PPARγ2 stability depends on the presence and probably the phosphorylation of Y78. We ruled out the possibility that the observed effects are due to differences in Pparg2 transcription, because we did not find a significant difference in the transcript levels of any of the Pparg2 constructs in SHP-1-WT and SHP-1-KD conditions with or without rosiglitazone treatment ().
To determine the impact of SHP-1 on PPARγ2 activity, we examined the expression of classical PPARγ target genes (Fabp4 and Cd36). Reflecting the PPARγ2 protein levels seen in , Fabp4 and Cd36 transcripts significantly increased in cells overexpressing wild-type PPARγ2 in SHP-1-KD cells as compared to SHP-1-WT cells after rosiglitazone treatment ( and ). However, there was no significant difference in the low levels of Fabp4 and Cd36 transcripts in cells of SHP-1-WT or SHP-1-KD background expressing PPARγ2-Y78F after rosiglitazone treatment.
To analyze whether the impact of SHP-1-mediated regulation of PPARγ2 activity also results in phenotypic changes, we treated PPARγ2-WT and -Y78F overexpressing NIH3T3-cells with rosiglitazone in the SHP-WT or -KD background. Similar to the Fabp4 and Cd36 transcript levels and mirroring the PPARγ2 protein levels, loss of SHP-1 caused an increase in lipid content in PPARγ2-WT, but not PPARγ2-Y78F expressing cells, which generally showed reduced lipid content ( and ). These findings indicate that SHP-1-mediated regulation of PPARγ2 stability through tyrosine residue Y78 results in altered PPARγ2 activity consequently affecting adipogenesis.
Discussion
In the present study, we discovered a new interacting partner and a substrate of SHP-1, namely PPARγ2. As depicted in the model in , we found that knockdown of SHP-1 stabilizes PPARγ2-WT protein leading to increased PPARγ2 protein expression as well as enhanced transcription of Cd36 and Fabp4 resulting in elevated adipogenesis. The substitution of tyrosine residue 78 with a non-phosphorylatable phenylalanine markedly destabilized PPARγ2, consequently dampening the SHP-1-dependent effects. Thus, SHP-1-mediated dephosphorylation at the Y78 residue results in the degradation of PPARγ2 and consequently modification of its activity. Since SHP-1 interacted to the same extent with PPARγ2 from untreated or rosiglitazone-treated cells, this SHP-1-mediated regulation seems to be independent of the activation status of PPARγ2.
While SHP-1 function has been vastly characterized in the immune system, a much more limited number of SHP-1 substrates have been documented in metabolic tissues such as CEACAM1Citation12 and phosphatidylinositol 3-kinase regulatory subunit p85.Citation7 Our work provides several lines of evidence that establish PPARγ, one of the master regulators of adipogenesis, as a SHP-1 substrate. SHP-1 interacts with PPARγ2 via its N-terminal SH2 domains, which are responsible for the detection of phosphotyrosine residues in SHP-1 target proteins. PPARγ2 bound stronger to a SHP-1 substrate-trapping mutant as compared to wild-type SHP-1. Choi et al., discovered that phosphorylation of PPARγ at the Y78 residue in adipocytes led to the suppression of pro-inflammatory gene expression, as well as the secretion of chemokines and cytokines, ultimately resulting in reduced macrophage migration and this phosphorylation was reversed by PTP1B.Citation25 In our study, SHP-1 dephosphorylated PPARγ2 in vitro, even better than PTP1B, which has been suggested to be the phosphatase responsible for PPARγ dephosphorylation.Citation25 The identification of PPARγ2 as SHP-1 substrate adds another transcription factor to the short list of transcriptional regulators including β-catenin and TonEBP/OREBP, which have been described as SHP-1 targets.Citation38,Citation39
Protein dephosphorylation can lead to a variety of cellular responses, including protein degradation. The relationship between protein dephosphorylation and proteasomal degradation is complex and depends on many factors, such as the specific protein being targeted and the context of the cellular environment. There are a number of studies where the link between protein dephosphorylation and protein degradation have been shown. For instance, Nalavadi et al. demonstrated that fragile X mental retardation protein degradation in dendrites by the ubiquitin proteasome system is mediated by protein phosphatase 2a activity.Citation40 In another report, dephosphorylation of Bcl-2 resulted in its ubiquitin mediated degradation.Citation41 However, to the best of our knowledge, except for one,Citation37 there have been no other reports linking the dephosphorylation of a tyrosine residue to the degradation of a respective protein.
The stability of nuclear receptors is influenced by their interaction with coactivators/co-suppressors and phosphorylation-induced ubiquitin-mediated protein degradation.Citation42,Citation43 We showed that SHP-1 loss increased PPARγ2 stability, an effect that is abrogated by mutation of the tyrosine 78 residue to phenylalanine. Previously, it has been demonstrated that the Y78 residue of PPARγ2 is tyrosine phosphorylated by c-Abl kinase, which leads to PPARγ2 stabilization by inhibiting ubiquitin-dependent degradation.Citation37 Therefore, our data imply that by dephosphorylating the Y78 residue SHP-1 negatively regulates the stability of PPARγ2. A compelling avenue for future investigation lies in unraveling the molecular mechanism how changes in tyrosine phosphorylation modulate ubiquitin-mediated protein degradation. One could speculate about different potential mechanisms. First, tyrosine phosphorylation might inhibit the interaction with an E3 ubiquitin ligase either directly or indirectly by recruiting another protein that prevents the access of an E3-ubiquitin ligase thereby limiting ubiquitination. Conversely, tyrosine-phosphorylation might recruit a deubiquitinase and stabilize PPARγ by reversing ubiquitination. Several E3 ubiquitin ligases for PPARγ including makorin ring finger protein 1 (MKRN1),Citation44 neural precursor cell expressed developmentally downregulated protein 4 (NEDD4)Citation45 and tripartite motif-containing 25 (TRIM25)Citation46 as well as a deubiquitinase for PPARγ, ubiquitin-specific protease 22 (USP22), have been described and future studies should provide deeper insights into the so far unknown molecular details of this novel regulatory mechanism. Previously Xiao et al., demonstrated that SHP-1 regulates casitas-B-lineage lymphoma (Cbl)-b protein mediated T cell response by controlling the tyrosine phosphorylation and ubiquitination of Cbl-b.Citation47 It will be interesting in the future to study whether dephosphorylation by SHP-1 controls the stability and activity of other proteins.
Overall, we discovered a novel function for the protein-tyrosine phosphatase SHP-1, which by dephosphorylating PPARγ2 regulates protein stability and thereby adipogenesis. However, the present study has certain limitations, which allow room for future investigations. Indeed, the physiological implication and relevance of tyrosyl phosphorylation of PPARγ2 remains to be further characterized. The utilization of an in vivo model expressing PPARγ2(Y78F) may provide further insights into the physiological significance of this site in metabolic processes. Furthermore, the specific signaling pathway(s) responsible for promoting tyrosine phosphorylation of PPARγ2 and the exact molecular mechanism how nuclear SHP-1 is activated to dephosphorylate PPARγ2 remain elusive and need further investigations.
Methods
DNA constructs
SH2-SH2 and PTPase(-DN,C453S) fragments were PCR-amplified from pcDNA5-FLAG3-SHP-1 constructs and pcDNA5-FLAG3-SHP-1-DN(-C453S) described elsewhereCitation48 and cloned using HindIII and EcoRI to generate pcDNA5-FLAG3-SH2-SH2, pcDNA5-PTPase-WT, and pcDNA5-PTPase-DN(-C453S) constructs. The pcDNA5-FLAG3-SHP-1-D419A construct was described before.Citation48 To generate GFP-SH2-domain-FLAG3 expression constructs, first pEGFP-C1 was modified by introducing an in frame fusion of a triple FLAG-epitope (BglII-HindIII-FLAG3-EcoRI-fragment) with the GFP-tag and then cDNAs encoding the N-SH2-domain (amino acids 1-104), C-SH2-domain (amino acids 106–213) or both SH2-domains (amino acids 1–213) were cloned as BglII-HindIII fragments between GFP and FLAG3. pcDNA3.1-Myc3-Pparg2 and pcDNA3-FLAG3-Pparg2 are mammalian expression constructs containing full length mouse Pparg2 cDNA. WZLneo-PPARγ2 plasmid (#34566) was purchased from Addgene. WZLneo-PPARγ2 plasmid was used as a template to generate WZLneo-PPARγ2-Y78F construct using Q5 Site-directed mutagenesis kit as per manufacturer’s instructions (New England Biolabs, cat# E0554S). Lentiviral construct pLKO-shRNA-luciferase (called shControl), pLKO-shScramble, pLX304, pLX304-PTPN6-V5, and pLX304-PTP1B-V5 were kind gifts from Mathieu Laplante. shRNA Ptpn6 (shPtpn6) was purchased from Sigma (shSHP-1.68, TRCN0000028968).
Cell culture, transfection, and treatment
All cell lines were cultured at 37 °C in a humidified atmosphere containing 5% CO2. The cell lines used were human embryonic kidney cells HEK293T, human hepatoma HepG2 cells and NIH3T3 mouse fibroblasts. HEK293T cells and NIH3T3 cells were cultured in DMEM high-glucose (Wisent Bioproducts cat# 319-005-CL) supplemented with 10% fetal bovine serum (FBS). HepG2 cells were cultivated in DMEM low-glucose (Wisent Bioproducts cat# 319-010-CL) supplemented with 10% FBS. 3T3-L1 cells were grown and differentiated into adipocytes as previously described.Citation49 All cell lines were transfected using jetPRIME (Polyplus-transfection, New York, USA) transfection reagent according to the manufacturer’s instructions with cell confluence between 60 and 80%. Depending on the experiments, the day after the transfection, some cells were treated with 100 nM of rosiglitazone (SynFine cat# 010301) before further analysis. Cells were treated with 20 μM (HEK293T and NIH3T3 cells) or 10 µM (HepG2 cells) bpV(HOpic) (Calbiochem, cat# 203701, reconstituted in water) for 30 min before harvesting. In the indicated experiments 100 µM of cycloheximide (Sigma, cat# 01810-1G) and 25 µM of MG-132 (Calbiochem, cat# 474787-10MG) were added to the cell culture medium.
Cell fractionation and immunocytochemistry
Cell fractionations from previously described HepG2-cells expressing WT SHP-1 or CRISPR-KO-SHP-148 and 3T3-L1 cells were performed using commercially available kits (ThermoFisher Scientific, Cayman Chemical) as per the manufacturer’s instructions. Enrichment of SHP-1, PPARγ and marker proteins was determined by immunoblotting. For immunocytochemistry, 3T3-L1 cells were differentiated on poly-L-lysine coated coverslips and fixed with 4% paraformaldehyde for 20 min followed by quenching (50 mM NH4Cl) and blocking (PBS containing 10% goat serum, 0.3% triton X100) for 1 h at RT. Cells were incubated with primary antibodies (anti-SHP-1, 1:50, sc-287, anti-PPARγ(E8), sc-7273; both from Santa Cruz) in antibody buffer (PBS containing 1% milk powder, 0.3% triton X100) at 4 °C overnight followed by incubation with anti-rabbit 647, anti-mouse 488 (both from Jackson Laboratories) and DAPI for 1 h. Confocal images were acquired with a LSM800 (Zeiss) with a 63× oil objective.
Virus preparation and generation of stable cell lines
Retro- and lentiviruses were prepared using HEK293T cells. Retroviruses were prepared by transfecting WZLneo-PPARγ2 or WZLneo-PPARγ2-Y78F plasmid along with Gag-Pol and VSVg constructs. For lentiviral infection, shControl or shPTPN6 constructs were transfected with psPAX2 and pMD2.G plasmids. Transfections were performed using JetPRIME transfection reagent as per the manufacturer’s instructions. Virus containing supernatants were collected 48 h after transfection and filtered using a 0.45 µm filter.Citation50 NIH3T3 cells or HepG2 cells were infected with retroviral supernatants (empty vector or PPARγ2 expressing vector) in the presence of polybrene (8 µg/mL). After 24 h of infection, transduction media was replaced by fresh media. After another 24 h, cells were split and selected using G418 (800 µg/mL). Expression of PPARγ2 protein was determined by Western blot analysis using a PPARγ-specific antibody (Cell signaling # 2443S, (81B8), 1:1000 dilution). Similarly, NIH3T3 cells overexpressing mutant PPARγ2-Y78F were generated.
SHP-1 was knocked down in NIH3T3 and 3T3-L1 cells using lentiviral infection. Briefly, NIH3T3 and 3T3-L1 cells were infected with lentiviral supernatant (shControl or shPTPN6) in the presence of polybrene. Cells were selected using 2 µg/mL of Puromycin (Invivogen, Cat# ant-pr-1). The expression level of SHP-1 protein was determined by western blot analysis using a SHP-1-specific antibody (Thermo Fisher Scientific Cat# MA5-11669 (1SH01), 1:500 dilution).
Immunoprecipitation and Western blot analysis
Cells were washed with PBS followed by lysis in buffer containing 20 mM Tris-HCl pH 7.5, 140 mM NaCl, 1 mM of CaCl2 and MgCl2, 10 mM NaF, 1% NP-40, 10% glycerol, 2 mM Na-vanadate, 1 mM PMSF and protease inhibitor cocktail (Roche). For immunoprecipitation, 1000 µg (for phosphoproteins) or 500 µg of total proteins were incubated with either anti-FLAG M2 affinity gel (Sigma) or protein A/G-agarose beads pre-incubated with PPARγ antibody for 2 h followed by five washes with buffer containing 1× PBS, 1% NP40, 2 mM Na-vanadate and protease inhibitors. Beads were boiled in 1× Laemmli buffer and western blot analysis was performed as described earlier.Citation8,Citation9,Citation12 The dilutions of the antibodies used in the study were as follows: FLAG antibody (Sigma cat# 088K6018, 1:1000 dilution), Myc antibody (Sigma cat# M4439-100UL, 1:2000 dilution), Actin antibody (Millipore, cat# MAB1501, 1:30,000 dilution), SHP-1 antibody (Thermo Fisher Scientific cat# MA5-11669 (1SH01), 1:500 dilution), PPARγ antibody (Cell signaling cat# 2443S, (81B8) 1:1000 dilution), PY20 antibody (Abcam, cat# ab10321, 1:2000) and 4G10 antibody (Millipore, cat #05-321, 1:2000 dilution).
In vitro dephosphorylation assay
HEK293T cells were transfected individually with either pcDNA3.1-Myc3-Pparg2, pcDNA5-FLAG3, pcDNA5-FLAG3-SHP-1, or pcDNA5-FLAG3-SHP-1-C453S (dominant-negative) constructs. Cells transfected with Myc3-Pparg2 construct were treated with 20 µM of bpV(HOpic) for 30 min. Next, cells were washed three times with PBS containing 1× protease inhibitor cocktail (Sigma) and lysed in NP40 buffer containing 1% NP-40, 150 mM NaCl, 50 mM Tris-HCl, pH 8, and PIs. Phosphorylated Myc3-PPARγ2 was pulled down using anti-Myc agarose beads. Similarly, FLAG3, FLAG3-SHP-1, and FLAG3-SHP-1-DN were prepared by immunoprecipitation using anti-FLAG-agarose beads. FLAG-precipitated proteins were released from FLAG-agarose beads by incubating with 15 µg of FLAG peptides for 30 min at 4 °C with rotation (Sigma, cat# F4799-4MG). Phosphorylated Myc3-PPARγ2 bound to Myc-agarose was incubated with either FLAG3, FLAG3-SHP-1-DN or FLAG3-SHP-1-WT in phosphatase buffer (20 mM HEPES pH7.5, 150 mM of NaCl, 0.5 mM DTT, 0.01 β-mercaptoethanol and 1 mM PMSF) at 37 °C for 30 min.Citation51 The reaction was stopped by adding Laemmli buffer and levels of phosphorylated Myc3-PPARγ2 were determined by western blotting using phosphotyrosine specific antibodies (mixture of 4G10 and PY20).
A similar dephosphorylation assay was performed with proteins immunoprecipitated from NIH3T3 cells. Briefly, NIH3T3 cells were transfected individually with either pcDNA3-FLAG3-Pparg2, pLX304, pLX304-PTPN6-V5 and pLX304-PTP1B-V5 constructs. Cells transfected with FLAG3-Pparg2 construct were treated with 20 µM of bpV(HOpic) for 30 minutes. Phosphorylated FLAG3-PPARγ2 was pulled down using anti-FLAG agarose beads and eluted using FLAG peptides. Similarly, pLX304, SHP-1-V5 and PTP1B-V5 were prepared by immuno-precipitation using an anti-V5 antibody coupled to agarose beads. Dephosphorylation assay was performed as described above.
In addition, the nonspecific phosphatase activity of SHP-1-V5 and PTP1B-V5 was determined using the Molecular Probes™ DiFMUP (6,8-Difluoro-4-Methylumbelliferyl Phosphate) substrate as described previously.Citation52 Reaction was performed at 37 °C for 30 min.
Cycloheximide protein stability experiments
NIH3T3 cells stably expressing PPARγ2 in SHP-1-WT- or SHP-1-KD-expressing cells were incubated with 100 µM of cycloheximide (Sigma, cat# 01810-1 G, dissolved in DMSO). PPARγ2 protein was measured by western blot analysis at 0, 1, 3, and 6 h of cycloheximide treatment.
Oil red O staining
To assess the lipid content, NIH3T3 cells stably expressing PPARγ2 or PPARγ2-Y78F in SHP-1-WT or SHP-1-KD cells were cultured to confluency and treated with 100 nM of rosiglitazone for 10 days. On day 10, cells were fixed and stained with oil red O (Sigma O-0625) as described previously.Citation37 Oil red O was dissolved in isopropanol and relative intracellular content was measured by measuring OD at 500 nm.Citation37
RNA isolation and quantitative PCR
Total RNA was isolated using the Direct-zol™ RNA MiniPrep kit (R2072, Zymoresearch, Irvine, USA) as per the manufacturer’s instructions. Two micrograms of total RNA was reverse transcribed using high capacity cDNA reverse transcription kit (Thermo Fisher Scientific, cat# 4368813). cDNA was diluted and the expression of transcripts was determined using Multicell Advanced qPCR master mix (Wisent bioproducts, cat# 800-435-UL). Hprt1 or B2M were included as reference genes (Supplementary material, Table S1). Relative fold change was calculated using 2^(-delta delta Ct) method.Citation53
Statistical analysis
All values presented in graphs are the average value of at least two independent experiments. The error bar shown in the graph is the standard error of the mean. Student’s t test and one-way ANOVA or two-way ANOVA with Tukey’s post hoc test were used to determine the statistical significance using GraphPad Prism software version 8. Western blots were quantified using ImageJ software.
Author contributions
M.S., K.B., M.L.B, A.K., V.H., N.B., M.L., and A.M. conceived and designed the project. A.K., M.S., M.L.B, M.F., B.L.L. and K.B. performed experiments. A.K., M.L.B., M.F., V.H., M.S., K.B., M.L. and A.M. interpreted the results. A.K., M.S., K.B. and A.M. wrote the manuscript with comments from the other authors.
Supplemental Material
Download MS Word (1.4 MB)Data availability statement
The data that support the findings of this study are openly available in figshare: https://figshare.com/articles/figure/Source_Files_Kumar_et_al_MCB_2024/25772886.
Disclosure statement
The authors declare no competing interests.
Additional information
Funding
References
- Plutzky J, Neel BG, Rosenberg RD. Isolation of a src homology 2-containing tyrosine phosphatase. Proc Natl Acad Sci USA. 1992;89:1123–1127. doi:10.1073/pnas.89.3.1123.
- Mizuno K, Katagiri T, Hasegawa K, Ogimoto M, Yakura H. Hematopoietic cell phosphatase, SHP-1, is constitutively associated with the SH2 domain-containing leukocyte protein, SLP-76, in B cells. J Exp Med. 1996;184:457–463. doi:10.1084/jem.184.2.457.
- Paling NRD, Welham MJ. Tyrosine phosphatase SHP-1 acts at different stages of development to regulate hematopoiesis. Blood. 2005;105:4290–4297. doi:10.1182/blood-2004-08-3271.
- Garg M, Wahid M, Khan F. Regulation of peripheral and central immunity: understanding the role of Src homology 2 domain-containing tyrosine phosphatases, SHP-1 & SHP-2. Immunobiology. 2020;225:151847. doi:10.1016/j.imbio.2019.09.006.
- Duchesne C, Charland S, Asselin C, Nahmias C, Rivard N. Negative regulation of beta-catenin signaling by tyrosine phosphatase SHP-1 in intestinal epithelial cells. J Biol Chem. 2003;278:14274–14283. doi:10.1074/jbc.M300425200.
- Bergeron S, Dubois M-J, Bellmann K, Schwab M, Larochelle N, Nalbantoglu J, Marette A. Inhibition of the protein tyrosine phosphatase SHP-1 increases glucose uptake in skeletal muscle cells by augmenting insulin receptor signaling and GLUT4 expression. Endocrinology. 2011;152:4581–4588. doi:10.1210/en.2011-1268.
- Lodeiro M, Alén BO, Mosteiro CS, Beiroa D, Nogueiras R, Theodoropoulou M, Pardo M, Gallego R, Pazos Y, Casanueva FF, et al. The SHP-1 protein tyrosine phosphatase negatively modulates Akt signaling in the ghrelin/GHSR1a system. Mol Biol Cell. 2011;22:4182–4191. doi:10.1091/mbc.E11-04-0373.
- Xu E, Charbonneau A, Rolland Y, Bellmann K, Pao L, Siminovitch KA, Neel BG, Beauchemin N, Marette A. Hepatocyte-specific Ptpn6 deletion protects from obesity-linked hepatic insulin resistance. Diabetes. 2012;61:1949–1958. doi:10.2337/db11-1502.
- Xu E, Forest M-P, Schwab M, Avramoglu RK, St-Amand E, Caron AZ, Bellmann K, Shum M, Voisin G, Paquet M, et al. Hepatocyte-specific Ptpn6 deletion promotes hepatic lipid accretion, but reduces NAFLD in diet-induced obesity: potential role of PPARγ. Hepatology. 2014;59:1803–1815. doi:10.1002/hep.26957.
- Chiang GG, Sefton BM. Specific dephosphorylation of the Lck tyrosine protein kinase at Tyr-394 by the SHP-1 protein-tyrosine phosphatase. J Biol Chem. 2001;276:23173–23178. doi:10.1074/jbc.M101219200.
- Keilhack H, Tenev T, Nyakatura E, Godovac-Zimmermann J, Nielsen L, Seedorf K, Böhmer FD. Phosphotyrosine 1173 mediates binding of the protein-tyrosine phosphatase SHP-1 to the epidermal growth factor receptor and attenuation of receptor signaling. J Biol Chem. 1998;273:24839–24846. doi:10.1074/jbc.273.38.24839.
- Dubois M-J, Bergeron S, Kim H-J, Dombrowski L, Perreault M, Fournès B, Faure R, Olivier M, Beauchemin N, Shulman GI, et al. The SHP-1 protein tyrosine phosphatase negatively modulates glucose homeostasis. Nat Med. 2006;12:549–556. doi:10.1038/nm1397.
- Wang W, Liu L, Song X, Mo Y, Komma C, Bellamy HD, Zhao ZJ, Zhou GW. Crystal structure of human protein tyrosine phosphatase SHP-1 in the open conformation. J Cell Biochem. 2011;112:2062–2071. doi:10.1002/jcb.23125.
- Zhang Z, Shen K, Lu W, Cole PA. The role of C-terminal tyrosine phosphorylation in the regulation of SHP-1 explored via expressed protein ligation. J Biol Chem. 2003;278:4668–4674. doi:10.1074/jbc.M210028200.
- Yang J, Liu L, He D, Song X, Liang X, Zhao ZJ, Zhou GW. Crystal structure of human protein-tyrosine phosphatase SHP-1. J Biol Chem. 2003;278:6516–6520. doi:10.1074/jbc.M210430200.
- Bardot O, Aldridge TC, Latruffe N, Green S. PPAR-RXR heterodimer activates a peroxisome proliferator response element upstream of the bifunctional enzyme gene. Biochem Biophys Res Commun. 1993;192:37–45. doi:10.1006/bbrc.1993.1378.
- Schachtrup C, Emmler T, Bleck B, Sandqvist A, Spener F. Functional analysis of peroxisome-proliferator-responsive element motifs in genes of fatty acid-binding proteins. Biochem J. 2004;382:239–245. doi:10.1042/BJ20031340.
- Nielsen R, Pedersen TA, Hagenbeek D, Moulos P, Siersbaek R, Megens E, Denissov S, Børgesen M, Francoijs K-J, Mandrup S, et al. Genome-wide profiling of PPARγ:RXR and RNA polymerase II occupancy reveals temporal activation of distinct metabolic pathways and changes in RXR dimer composition during adipogenesis. Genes Dev. 2008;22:2953–2967. doi:10.1101/gad.501108.
- Kliewer SA, Sundseth SS, Jones SA, Brown PJ, Wisely GB, Koble CS, Devchand P, Wahli W, Willson TM, Lenhard JM, et al. Fatty acids and eicosanoids regulate gene expression through direct interactions with peroxisome proliferator-activated receptors alpha and gamma. Proc Natl Acad Sci USA. 1997;94:4318–4323. doi:10.1073/pnas.94.9.4318.
- Kliewer SA, Lenhard JM, Willson TM, Patel I, Morris DC, Lehmann JM. 1995 A prostaglandin J2 metabolite binds peroxisome proliferator-activated receptor gamma and promotes adipocyte differentiation. Cell. 1995;83:813–819. doi:10.1016/0092-8674(95)90194-9.
- Lehmann JM, Moore LB, Smith-Oliver TA, Wilkison WO, Willson TM, Kliewer SA. 1 An antidiabetic thiazolidinedione is a high affinity ligand for peroxisome proliferator-activated receptor gamma (PPAR gamma). J Biol Chem. 1995;270:12953–12956. doi:10.1074/jbc.270.22.12953.
- Houseknecht KL, Cole BM, Steele PJ. Peroxisome proliferator-activated receptor gamma (PPARgamma) and its ligands: a review. Domest Anim Endocrinol. 2002;22:1–23. doi:10.1016/s0739-7240(01)00117-5.
- Wu D, Eeda V, Undi RB, Mann S, Stout M, Lim H-Y, Wang W. A novel peroxisome proliferator-activated receptor gamma ligand improves insulin sensitivity and promotes browning of white adipose tissue in obese mice. Mol Metab. 2021;54:101363. doi:10.1016/j.molmet.2021.101363.
- Hu E, Kim JB, Sarraf P, Spiegelman BM. Inhibition of adipogenesis through MAP kinase-mediated phosphorylation of PPARgamma. Science. 1996;274:2100–2103. doi:10.1126/science.274.5295.2100.
- Choi S, Jung J-E, Yang YR, Kim E-S, Jang H-J, Kim E-K, Kim IS, Lee J-Y, Kim JK, Seo JK, et al. Novel phosphorylation of PPARγ ameliorates obesity-induced adipose tissue inflammation and improves insulin sensitivity. Cell Signal. 2015;27:2488–2495. doi:10.1016/j.cellsig.2015.09.009.
- Floyd ZE, Stephens JM. Control of peroxisome proliferator-activated receptor gamma2 stability and activity by SUMOylation. Obes Res. 2004;12:921–928. doi:10.1038/oby.2004.112.
- Ohshima T, Koga H, Shimotohno K. Transcriptional activity of peroxisome proliferator-activated receptor gamma is modulated by SUMO-1 modification. J Biol Chem. 2004;279:29551–29557. doi:10.1074/jbc.M403866200.
- Pascual G, Fong AL, Ogawa S, Gamliel A, Li AC, Perissi V, Rose DW, Willson TM, Rosenfeld MG, Glass CK. A SUMOylation-dependent pathway mediates transrepression of inflammatory response genes by PPAR-gamma. Nature. 2005;437:759–763. doi:10.1038/nature03988.
- Hauser S, Adelmant G, Sarraf P, Wright HM, Mueller E, Spiegelman BM. Degradation of the peroxisome proliferator-activated receptor gamma is linked to ligand-dependent activation. J Biol Chem. 2000;275:18527–18533. doi:10.1074/jbc.M001297200.
- Floyd ZE, Stephens JM. Interferon-gamma-mediated activation and ubiquitin-proteasome-dependent degradation of PPARgamma in adipocytes. J Biol Chem. 2002;277:4062–4068. doi:10.1074/jbc.M108473200.
- Lefterova MI, Haakonsson AK, Lazar MA, Mandrup S. PPARγ and the global map of adipogenesis and beyond. Trends Endocrinol Metab. 2014;25:293–302. doi:10.1016/j.tem.2014.04.001.
- Toobian D, Ghosh P, Katkar GD. Parsing the Role of PPARs in Macrophage Processes. Front Immunol. 2021;12:783780. doi:10.3389/fimmu.2021.783780.
- Lehrke M, Lazar MA. The many faces of PPARgamma. Cell. 2005;123:993–999. doi:10.1016/j.cell.2005.11.026.
- Farmer SR. Transcriptional control of adipocyte formation. Cell Metab. 2006;4:263–273. doi:10.1016/j.cmet.2006.07.001.
- Matsusue K, Kusakabe T, Noguchi T, Takiguchi S, Suzuki T, Yamano S, Gonzalez FJ. Hepatic steatosis in leptin-deficient mice is promoted by the PPARgamma target gene Fsp27. Cell Metab. 2008;7:302–311. doi:10.1016/j.cmet.2008.03.003.
- Yamazaki T, Shiraishi S, Kishimoto K, Miura S, Ezaki O. An increase in liver PPARγ2 is an initial event to induce fatty liver in response to a diet high in butter: PPARγ2 knockdown improves fatty liver induced by high-saturated fat. J Nutr Biochem. 2011;22:543–553. doi:10.1016/j.jnutbio.2010.04.009.
- Keshet R, Bryansker Kraitshtein Z, Shanzer M, Adler J, Reuven N, Shaul Y. c-Abl tyrosine kinase promotes adipocyte differentiation by targeting PPAR-gamma 2. Proc Natl Acad Sci USA. 2014;111:16365–16370. doi:10.1073/pnas.1411086111.
- Zhou X, Gallazzini M, Burg MB, Ferraris JD. Contribution of SHP-1 protein tyrosine phosphatase to osmotic regulation of the transcription factor TonEBP/OREBP. Proc Natl Acad Sci USA. 2010;107:7072–7077. doi:10.1073/pnas.1002795107.
- Simoneau M, Coulombe G, Vandal G, Vézina A, Rivard N. SHP-1 inhibits β-catenin function by inducing its degradation and interfering with its association with TATA-binding protein. Cell Signal. 2011;23:269–279. doi:10.1016/j.cellsig.2010.09.011.
- Nalavadi VC, Muddashetty RS, Gross C, Bassell GJ. Dephosphorylation-induced ubiquitination and degradation of FMRP in dendrites: a role in immediate early mGluR-stimulated translation. J Neurosci. 2012;32:2582–2587. doi:10.1523/JNEUROSCI.5057-11.2012.
- Dimmeler S, Breitschopf K, Haendeler J, Zeiher AM. Dephosphorylation targets Bcl-2 for ubiquitin-dependent degradation: a link between the apoptosome and the proteasome pathway. J Exp Med. 1999;189:1815–1822. doi:10.1084/jem.189.11.1815.
- Burns KA, Vanden Heuvel JP. Modulation of PPAR activity via phosphorylation. Biochim Biophys Acta. 2007;1771:952–960. doi:10.1016/j.bbalip.2007.04.018.
- Blanquart C, Mansouri R, Fruchart J-C, Staels B, Glineur C. Different ways to regulate the PPARalpha stability. Biochem Biophys Res Commun. 2004;319:663–670. doi:10.1016/j.bbrc.2004.05.035.
- Kim J-H, Park KW, Lee E-W, Jang W-S, Seo J, Shin S, Hwang K-A, Song J. Suppression of PPARγ through MKRN1-mediated ubiquitination and degradation prevents adipocyte differentiation. Cell Death Differ. 2014;21:594–603. doi:10.1038/cdd.2013.181.
- Li JJ, Wang R, Lama R, Wang X, Floyd ZE, Park EA, Liao F-F. Ubiquitin ligase NEDD4 regulates PPARγ stability and adipocyte differentiation in 3T3-L1 cells. Sci Rep. 2016;6:38550. doi:10.1038/srep38550.
- Lee JM, Choi SS, Lee YH, Khim KW, Yoon S, Kim B-G, Nam D, Suh P-G, Myung K, Choi JH. The E3 ubiquitin ligase TRIM25 regulates adipocyte differentiation via proteasome-mediated degradation of PPARγ. Exp Mol Med. 2018;50:1–11. doi:10.1038/s12276-018-0162-6.
- Xiao Y, Qiao G, Tang J, Tang R, Guo H, Warwar S, Langdon WY, Tao L, Zhang J. Protein tyrosine phosphatase SHP-1 modulates T cell responses by controlling Cbl-b degradation. J Immunol. 2015;195:4218–4227. doi:10.4049/jimmunol.1501200.
- Kumar A, Schwab M, Laborit Labrada B, Silveira MAD, Goudreault M, Fournier É, Bellmann K, Beauchemin N, Gingras A-C, Bilodeau S, et al. SHP-1 phosphatase acts as a coactivator of PCK1 transcription to control gluconeogenesis. J Biol Chem. 2023;299:105164. doi:10.1016/j.jbc.2023.105164.
- Dallaire P, Bellmann K, Laplante M, Gélinas S, Centeno-Baez C, Penfornis P, Peyot M-L, Latour MG, Lamontagne J, Trujillo ME, et al. Obese mice lacking inducible nitric oxide synthase are sensitized to the metabolic actions of peroxisome proliferator-activated receptor-gamma agonism. Diabetes. 2008;57:1999–2011. doi:10.2337/db08-0540.
- Cribbs AP, Kennedy A, Gregory B, Brennan FM. Simplified production and concentration of lentiviral vectors to achieve high transduction in primary human T cells. BMC Biotechnol. 2013;13:98. doi:10.1186/1472-6750-13-98.
- Frank C, Burkhardt C, Imhof D, Ringel J, Zschörnig O, Wieligmann K, Zacharias M, Böhmer F-D. Effective dephosphorylation of Src substrates by SHP-1. J Biol Chem. 2004;279:11375–11383. doi:10.1074/jbc.M309096200.
- Bossé Y, Lamontagne M, Gaudreault N, Racine C, Levesque M-H, Smith BM, Auger D, Clemenceau A, Paré M-È, Laviolette L, et al. Early-onset emphysema in a large French-Canadian family: a genetic investigation. Lancet Respir Med. 2019;7:427–436. doi:10.1016/S2213-2600(19)30056-6.
- Livak KJ, Schmittgen TD. Analysis of relative gene expression data using real-time quantitative PCR and the 2(-Delta Delta C(T)) method. Methods. 2001;25:402–408. doi:10.1006/meth.2001.1262.