Abstract
Background: Immigrants in general seem to be more vulnerable than the host population to developing nutrition-related chronic conditions. This may in part be related to diverging dietary habits, including intake of different types and amounts of dietary fat.
Objectives: The main aim of this study was to investigate the dietary fatty acid composition and the dietary fat sources among first generation immigrant women from Iran and Turkey compared with women of Swedish ethnicity. The second aim was to relate the reported dietary fatty acid composition to the fatty acid composition in serum cholesterol esters, and the fatty acid composition in serum to metabolic variables.
Design: The study was a cross-sectional health survey of randomly selected foreign-born women (n=107) and native Swedish women (n=50) living in Uppsala. This included 24 h dietary recall repeated four times and administered in the native language.
Results and conclusion: A lower proportion of saturated fatty acids, a higher proportion of linoleic acid and a higher n-6/n-3 ratio were found in the immigrants’ diet than in the diet of the Swedish women. The difference in linoleic acid was also mirrored in serum. Vegetable dishes, together with edible fats, were the major contributors of polyunsaturated fatty acids among the immigrant women. While the fatty acid profile in serum among the immigrant women had both favourable and unfavourable implications, a higher prevalence of obesity and dyslipidaemia was observed in immigrant compared with Swedish-born women.
Introduction
The increasing number of immigrants in Sweden during the past few decades has brought the health of different ethnic groups into focus. In view of the fact that immigrants in Sweden generally seem to be more vulnerable than the host population to developing nutrition-related chronic conditions Citation1, Citation2, studying their food habits is of great importance. Lifestyle factors, especially food habits, degree of physical activity, psychosocial stress and smoking, are well-known factors affecting health and disease. Migrant studies have confirmed that mortality and risk factors for cardiovascular disease (CVD) may increase following immigration Citation3, Citation4. There are, however, still very few studies concerning CVD risk factors and food habits among immigrants in Sweden. The dietary fat content and fatty acid composition, as well as fatty acid composition in serum lipids, have been documented as indicators for coronary heart disease risk and the metabolic syndrome Citation5, Citation6.
Dietary surveys are often imprecise and unreliable because of underreporting and misrecording. A differential underreporting of various food items, especially sugar and fat, in relation to the total food intake makes the analysis of studies of diet and health difficult Citation7, Citation8. One way to confirm the type of fat reported in the diet is to record the fatty acid composition in adipose tissues Citation9, Citation10 or serum Citation11Citation12Citation13. The fatty acid composition in serum, e.g. in the cholesterol esters (CEs), reflects medium-term dietary intake (i.e. intake over weeks to months) Citation14. The relationship is most obvious for polyunsaturated fatty acids (PUFAs) such as linoleic acid (18:2 n-6) and the n-3 fatty acids Citation6Citation15Citation16Citation17.
In a previous study, we found that the present subjects from Iran and Turkey, as well as Swedish women, report a low intake of energy, as well as low intake of all macronutrients, indicating underreporting of food intake, especially among immigrant women (A Daryani et al., unpublished). However, since there were no major differences in macronutrient distribution between very-low-energy underreporters and acceptable-energy reporters, this seems to indicate that the dietary data reflected the qualitative composition rather well, in spite of the underreporting of energy intake.
The main aim of the present study was to investigate further the dietary fatty acid composition and the dietary fat sources among immigrant women from Iran and Turkey compared with women of Swedish ethnicity. The reported dietary fatty acid composition was related to the fatty acid composition in serum CEs. In addition, the fatty acid composition in serum was related to metabolic variables such as body mass index (BMI), sagittal abdominal diameter (SAD), serum lipids and insulin levels.
Materials and methods
Study population
The study included first generation immigrant women born in a Middle Eastern country between 1933 and 1962 (i.e. 35–64 years of age) and residing in the municipality of Uppsala for at least the past 3 years. The fieldwork was carried out during 1997–2000. As of 1 January 1996, a total of 1086 Middle Eastern women aged 35–64 years lived in Uppsala, the majority (80%) of whom had emigrated either from Iran or Turkey. It was therefore decided to focus mainly on women born in these two countries. Collaboration was sought with the National Statistics Office of Sweden (SCB) for drawing a random sample of 90 women from each country who met the above-mentioned criteria. A group of 90 women born in Sweden during the same period and resident in Uppsala was also selected at random.
The sample of 180 immigrant women and the 90 native women were initially contacted by letter through the SCB. The letter contained an invitation to participate in the study and a description of the study. Non-respondents were sent two reminders in writing. Those who agreed to participate were approached by mail and telephone and asked to complete a questionnaire. They were thereafter invited to a free health screening, a clinical examination and participation in a dietary survey. Altogether, 157 women (71 from Iran, 36 from Turkey and 50 Swedish-born women) agreed to participate and completed the screening process. Three subjects, one from each group, were excluded from the dietary assessment because of incomplete 24 h recall.
Health screening and clinical examination
Participants were screened at the Metabolic Research Unit of the Department of Geriatrics of Uppsala University. The focus of the examination was on measuring the prevalence of obesity, diabetes mellitus, hypertension and a clustering of metabolic risk factors indicative of the metabolic syndrome Citation18. The main results of the health screening, i.e. BMI, SAD, total cholesterol, triglycerides (TGs), high-density lipoprotein (HDL) and glucose, as well as insulin in serum, are presented in . The health screening procedure and results are presented in greater detail in Daryani et al. Citation19.
Table 1. Subject characteristicsFootnotea
Serum lipids
Total cholesterol and TG levels in serum were assayed by enzymic techniques using a Monarch apparatus (Instrumentation Laboratories; Lexington, MA, USA). HDL-cholesterol was separated by precipitation with magnesium chloride and phosphotungstate. The fatty acid composition of the serum CEs was determined by gas–liquid chromatography, described in detail in Vessby et al. Citation20. The relative amount of each fatty acid (% of total fatty acids) was quantified by integrating the area under the peak and dividing the result by the total area for all fatty acids. The fatty acid composition (14:0 to 22:6 n-3) was expressed as a percentage of the total fatty acids identified. The sum of n-3 PUFAs (i.e. 18:3 n-3, 20:5 n-3, 22:5 n-3 and 22:6 n-3) and the sum of n-6 PUFAs (18:2 n-6, 18:3 n-6, 20:3 n-6 and 20:4 n-6) were calculated from the primary data. The n-6/n-3 ratio was calculated as the sum of n-6 PUFAs to the sum of n-3 PUFAs. Estimated enzyme activity for Δ6 desaturase was calculated as the ratio between ϒ-linoleic acid (18:3 n-6) and linoleic acid (18:2 n-6), while the enzyme activity for Δ9 desaturase was calculated as the ratio between palmitoleic acid (16:1 n-7) and palmitic acid (16:0).
Dietary assessment
This part of the study was carried out and the analyses were performed in collaboration with the Swedish National Food Administration (NFA) and the Unit for Clinical Nutrition Research of the Department of Public Health and Caring Sciences, Uppsala University. Dietary data from all subjects were collected using a 24 h dietary recall administered four times during one personal visit and three telephone interviews, on three weekdays and one weekend day.
The method was open ended and a standardized protocol was used Citation21. The recalls were carried out within a 1 year sampling period. The usual interval between the 24 h recalls for each subject was about 2 months (range 5–8 weeks). Subjects were asked to report their food consumption for a well-defined 24 h period during the previous day. On average, each recall lasted for 20–25 min and was performed in the subject's native language. Each interviewer, a trained dietitian/nutritionist (one for each language), conducted the recall and gave all instructions to the subjects. Each interview started with the question, “What did you first eat or drink after you woke up yesterday?” If the subject had consumed nothing on waking up, she was asked when she had first consumed something, and so the interview proceeded until complete 24 h coverage was obtained. For each consecutive eating occasion (“meal”, “snack” or “drinks”), the subject gave the name of the consumed food item(s), and then was told to estimate the quantities consumed. Neutral questions of the type, “Did you have anything on your bread?”, “Did you put anything in your coffee or tea?” and “Did you drink anything with your meal?” were used to obtain better information on the use of margarine/butter and additional foods. Food portion size was estimated using the Meal Model “Matmallen” produced by the NFA, which includes photographs (five options for portions of food on a plate and five options for spread on a knife) and 38 pictures at life size Citation22, which were translated into Persian and Turkish for this study.
Calculation of energy and nutrient intake
Because of the different food traditions of the groups, careful efforts were made to describe recipes and cooking styles, including fats used in dishes. Specific ethnic foods were included where necessary. Standard recipes were used for dishes eaten outside the home. After conversion to weight units, the food items were coded, and energy and nutrient intake was calculated using MATs software (Rudans lättdata; Västerås, Sweden), which includes the food composition database (PC-kost) of the NFA Citation23. The database contains about 1800 foods and dishes, with values for energy, and about 50 nutrients. The evaluation of the dietary variables comprised the following quantitative variables: intake of energy (MJ) and nutrients (weight units). The relative quality of the diet was expressed as a percentage of the total energy (E%). Total fat was calculated, as well as the amount and proportions of saturated fatty acids (SFAs), monounsaturated fatty acids (MUFAs) and PUFAs. The fatty acid composition presented in the diet is based on the fatty acids included in PC-kost. The percentage of the total dietary fatty acids was calculated for each individual fatty acid. The data presented cover the same fatty acids as analysed in serum CEs, except for 15:0, 18:3 n-6 and 20:3 n-6. The sum of n-3 PUFAs (18:3 n-3, 20:5 n-3, 22:5 n-3 and 22:6 n-3) and the sum of dietary-derived n-6 PUFAs (18:2 n-6 and 20:4 n-6) were calculated from the primary data. The dietary sources of the different classes of fatty acids and the individual fatty acids were calculated and the contribution from different food groups was expressed as a percentage of the total daily intake.
The grouping of the food items is according to the Swedish Food Composition Database, which represents the majority of fat sources as follows: 1: edible fats, including margarine, butter, oils, dressings and sauces with added fat; 2: dairy products, e.g. milk, fermented milk, yoghurt, cheese, cream and ice-cream; 3: meat dishes, e.g. meat, poultry products, and meat- and poultry-based dishes; 4: cereal-based products and dishes, e.g. pizza, pies, pirogues, crêpes, buns and biscuits; 5: vegetable dishes, e.g. pulses and vegetable products, as well as vegetable-based dishes; 6: starch-based products, e.g. potatoes, rice and pasta, as well as starch-based dishes and breads; 7: sausage-based dishes, e.g. sausages and offal products; and 8: fish and fish-based dishes.
A subject was classified as a very-low-energy reporter if the ratio of the reported energy intake to the estimated basal metabolic rate, i.e. the food intake level (FIL), was less than 1.06, and as an acceptable energy reporter if the FIL was equal to or more than 1.06 Citation24.
Statistical methods
The statistical analyses were performed using the program SAS for Windows (SAS Institute, Cary, NC, USA). The basic statistical analysis included comparisons between the two groups of immigrant women and the group of Swedish-born women. For continuous variables, analysis of variance (ANOVA) was performed. For variables with skewed distributions (Shapiro–Wilks W-test < 0.95), a logarithmic transformation was done before the statistical analysis. Spearman's rank correlation was used for the variables with skewed distributions. Partial correlation was used to eliminate the discrepancy of some of the variables among the three groups. The results are presented as means±standard deviation (SD). All tests were two-sided and a p-value < 0.01 was regarded as statistically significant.
Ethics
The study was approved by the ethics committee of the Faculty of Medicine at Uppsala University and all subjects gave their informed consent before entering the study.
Results
The characteristics of the subjects, including age and results of the clinical examination, are given in . The age was significantly higher among ethnic Swedish women than among the immigrants. Consequently, risk factor levels were adjusted for age when comparing immigrants and Swedish women.
Fatty acid composition in the diets
Dietary fatty acid composition is shown in . In the immigrant groups the proportion of total SFAs as well as of all individual SFAs (4:0–10:0, 12:0, 14:0, 16:0 and 18:0) was lower than in the Swedish group, while the proportion of total PUFAs and particularly 18:2 n-6 was higher in the immigrant women than in the Swedish group. In addition, the sum of n-6 PUFAs (18:2 n-6 and 20:4 n-6) was higher in the immigrant groups than in the Swedish group, resulting in a higher n-6/n-3 ratio in the immigrant groups. Furthermore, in the Turkish group the proportion of the major MUFA, oleic acid (18:1 n-9), was higher than in the other two groups.
Table 2. Energy, dietary fat intake (E%, energy percentage) and dietary fatty acid composition (%) based on four 24 h recalls for each group
Dietary fat sources
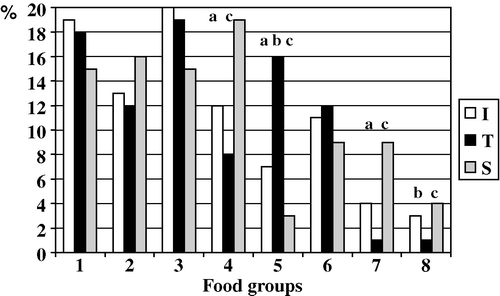
The major dietary sources of total fat and fatty acids are shown in Figs. . Food group categories such as edible fats, dairy products and meat dishes were generally the major contributors of total fat, SFAs and MUFAs among all women. Vegetable dishes contributed a higher percentage of the total fat among the immigrant women than among the Swedish women, while the opposite was true for cereal- and sausage-based products and dishes. A similar pattern was observed for the SFAs. With regard to PUFAs, vegetable dishes, together with edible fats, were major contributors among the immigrant women, while edible fat, cereal-based products and starch-based products were the major contributors among the Swedish women. Vegetable dishes contributed a much larger proportion of MUFAs in the Turkish group than in the two other groups.
Fig. 1 Different food groups and their contribution (%) to total dietary fat in Iranian (I, n=70), Turkish (T, n=35) and Swedish (S, n=49) women. 1: Edible fats; 2: dairy products; 3: meat dishes; 4: cereal-based products; 5: vegetables dishes; 6: starch-based product and breads; 7: sausage-based dishes; 8: fish and fish-based dishes. Pairwise comparisons: a: significant difference (p≤0.01), Iranian versus Swedish women; b: significant difference, Iranian versus Turkish women; c: significant difference, Turkish versus Swedish women; (c): borderline significance, p=0.012).
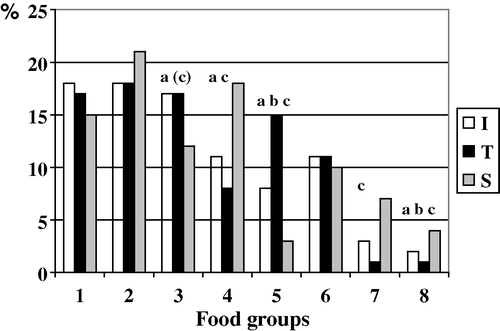
Fig. 2 Different food groups and their contributing part (%) of saturated fatty acids in Iranian (I, n: 70), Turkish (T, n: 35) and Swedish (S, n: 49) women. 1: Edible fats; 2: dairy products; 3: meat dishes; 4: cereal-based products; 5: vegetables dishes; 6: starch-based product and breads; 7: sausage-based dishes; 8: fish and fish-based dishes. Pairwise comparisons: a: significant difference (p≤0.01), Iranian versus Swedish women; b: significant difference, Iranian versus Turkish women; c: significant difference, Turkish versus Swedish women.
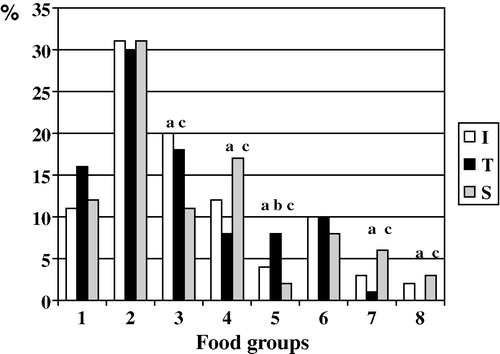
Fig. 3 Different food groups and their contributing part (%) of polyunsaturated fatty acids in Iranian (I, n: 70), Turkish (T, n: 35) and Swedish (S, n: 49) women. 1: Edible fats; 2: dairy products; 3: meat dishes; 4: cereal-based products; 5: vegetables dishes; 6: starch-based product and breads; 7: sausage-based dishes; 8: fish and fish-based dishes. Pairwise comparisons: a: significant difference (p≤0.01), Iranian versus Swedish women; b: significant difference, Iranian versus Turkish women; c: significant difference, Turkish versus Swedish women.
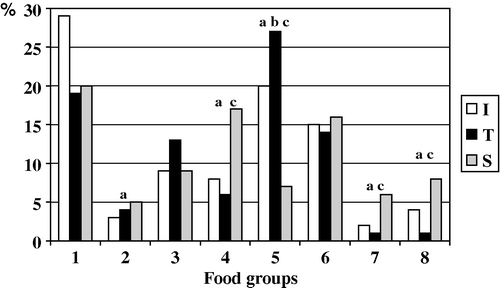
Fig. 4 Different food groups and their contributing part (%) of monounsaturated fatty acids in Iranian (I, n: 70), Turkish (T, n: 35) and Swedish (S, n: 49) women. 1: Edible fats; 2: dairy products; 3: meat dishes; 4: cereal-based products; 5: vegetables dishes; 6: starch-based product and breads; 7: sausage-based dishes; 8: fish and fish-based dishes. Pairwise comparisons: a: significant difference (p≤0.01), Iranian versus Swedish women; b: significant difference, Iranian versus Turkish women; c: significant difference, Turkish versus Swedish women.
Fatty acid composition of the serum cholesterol esters
The fatty acid composition of the serum CEs is shown in . Regarding the proportion of SFAs in serum, there were differences between the Iranian and the Swedish groups, but not between the Turkish and Swedish groups. The proportions of the minor SFAs (14:0, 15:0 and 18:0) in serum were lower in the Iranian group than in the Swedish group, but no difference was observed for 16:0. With regard to the proportions of MUFAs and PUFAs, both immigrant groups differed from the Swedish group. In the immigrant groups the proportions of both MUFAs (16:1 n-7 and 18:1 n-9) were lower than in the Swedish group. Moreover, the immigrant groups showed higher proportions of all individual n-6 PUFAs and of the sum of n-6 PUFAs in serum than seen in the Swedish women, as well as a higher n-6/n-3 ratio. The opposite is shown for the sum of the n-3 PUFAs, where a lower proportion in serum was observed in the immigrant group than in the Swedish group.
Table 3. Fatty acid composition (%) in serum cholesterol esters for each group
Correlation between fatty acid composition in diet and in serum cholesterol esters
Positive relationships between fatty acid composition in diet and serum CEs were found for the proportions of 14:0 (r=0.29, p=0.0003), 18:0 (r=0.32, p<0.0001) and 18:2 n-6 (r=0.25, p=0.002) calculated for all three groups together (n=156). There was a borderline significance for 22:6 n-3 (r=0.20, p=0.015).
Correlation between metabolic variables and fatty acid composition in serum
For those metabolic variables (BMI, SAD and TGs) that differed between the immigrants and the Swedish group (), correlations were observed with some of the fatty acids in serum CEs, calculated for all groups together. SAD and BMI were both positively correlated with the 16:1/16:0 ratio (Δ9 desaturase) (r=0.38, p<0.0001, and r=0.25, p=0.002, respectively) and the 18:3 n-6/18:2 n-6 ratio (Δ6 desaturase) (r=0.30, p=0.0002, and r=0.23, p=0.003, respectively). The SAD tended to be negatively correlated with 18:2 n-6 (r= − 0.20, p=0.015). There was also a positive correlation between serum TGs and the 16:1/16:0 ratio (r=0.29, p=0.0003) and the 18:3 n-6/18:2 n-6 ratio (r=0.31, p<0.0001). In addition, a negative correlation was found between cholesterol in serum and 18:2 n-6 (r= − 0.29, p=0.0003).
Discussion
Divergent response rates among these two immigrant groups reflect to a certain extent the fact that these two populations are very unequal in several aspects, including origin (urban versus rural), education, and cultural and socioeconomic background in the home country. This variation is also evident in the large difference in Swedish language skills between the two immigrant groups. Inability to speak the host society's language is a key factor that complicates integration in the host society. The disadvantages of the exile situation may have been another factor influencing the low attendance rate among Turkish women. Despite this setback, the collected data can be considered fairly reliable because of the random selection procedure using a common database covering all women immigrants from Turkey living in Uppsala. Results from other studies in Sweden also show a low attendance rate for Turkish/Kurdish women Citation25Citation26Citation27.
Dietary fatty acid composition in relation to serum
The results of the present study show differences in the fatty acid composition in the diets as well as in serum CEs between the immigrants and Swedish-born women. A noticeable finding was a higher relative content of 18:2 n-6 in the diet of the immigrant groups compared with the Swedish group. This difference was confirmed in serum, where the proportion of 18:2 n-6 was significantly higher among the immigrants than among the Swedish-born women. In addition, a positive correlation was found particularly for the reported individual intake and the corresponding proportion of 18:2 n-6 in serum CEs. There was also a significant positive correlation between the proportion of both 14:0 and 18:0 in the diet and in the serum CEs. This finding indicates an acceptable quality of reported food intake. It has repeatedly been shown that the relationship between fatty acid composition in the diet and in body tissues is most obvious for particular PUFAs such as 18:2 n-6 Citation15. An acceptable quality of reported intake was confirmed when the macronutrient distribution and the fat quality, i.e. the proportion of SFAs, MUFAs and PUFAs, were analysed in subjects who reported very low energy intake compared with those who reported an acceptable energy intake. Therefore, no significant difference was found between these groups (data not shown).
The higher proportion of n-6 PUFAs in the diets of both immigrant groups compared with the Swedish group resulted in a higher ratio of n-6/n-3 observed in the immigrants’ diet, as well as in their serum. Although no significant difference in the proportion of total n-3 PUFAs in the diet was found, the level of n-3 PUFA in serum CEs was significantly lower among the immigrants than among the Swedish women. This may be explained by the higher proportion of dietary 18:2 n-6 in the immigrant group, since an increase in the n-6/n-3 ratio may result in lower endogenous biosynthesis of long-chain n-3 PUFAs as a consequence of the competition for the same enzyme system for desaturation and elongation Citation6. Probably for the same reason, the proportion of 18:3 n-6, 20:3 n-6 and 20:4 n-6 in serum, all of which are metabolites of 18:2 n-6, was higher in the immigrant groups than in the Swedish group.
Dietary fatty acid composition in relation to food source
The high proportion of 18:2 n-6 in serum and in the diet among the immigrant groups is explained by a high consumption of vegetable oils such as sunflower oil, maize oil and oil blends (mainly rapeseed oil) consumed as edible fats and in vegetable dishes. Among the immigrants these food groups contributed the largest part of PUFAs (edible fat contributing 29% and 19%, and vegetable dishes contributing 20% and 27% of total PUFAs among the Iranian and Turkish women, respectively). Sunflower oil and maize oil are particularly rich in 18:2 n-6 and are natural ingredients of traditional cooking in Iran. This is one explanation for the high proportion of PUFAs in the diet, especially of the Iranian women. In the Turkish group the proportion of the major MUFA, 18:1 n-9, in the diet was higher than in the two other groups. This is explained by the use of olive oil, which is rich in oleic acid, and is a common ingredient in Turkish cooking. Among the Swedish women the edible fat mainly consisted of spreads, liquid margarine (based on rapeseed oil) and rapeseed oil. Data from the food records confirm the use of different fat products characteristic of the different groups of women and indicate that immigrant women in this study continue their traditional cooking and use of traditional fat products even after immigration. In general, the foods that are thought to change most easily in the adaptation process to a country's new food habits are items grouped under “accessory foods” such as fats Citation28. However, in this study of first generation immigrants, the type of fats, one of the main “accessory foods”, seemed to be maintained as used in traditional cooking.
Fatty acid composition in serum and the metabolic syndrome
Several recent studies have underlined the importance of fat quality in the diet for the development of insulin resistance and other diseases related to the metabolic syndrome Citation6, Citation29, Citation30. Insulin resistance and related disorders are often associated with a fatty acid pattern in plasma characterized by a high proportion of 16:0 and a low proportion of 18:2 n-6, with a distribution of the other fatty acids indicating an increased activity of Δ9 (16:1/16:0) and Δ6 (18:3 n-6/18:2 n-6) desaturase Citation6. Laaksonen et al. Citation31 showed that individuals with a high proportion of 18:2 n-6 in plasma fatty acids had a lower risk for developing diabetes. This finding is compatible with earlier findings Citation32 and is also in line with dietary epidemiology Citation33, which indicates that individuals with a low proportion of 18:2 n-6 or vegetable fat in their diet have an increased risk of developing type 2 diabetes.
The serum fatty acid profile of the immigrant women showed both favourable and unfavourable features compared with the Swedish-born women. No difference was seen in the proportion of 16:0 in serum, despite a lower proportion of 16:0 in the diet of immigrant women. In addition, the serum 16:1/16:0 ratio tended to be lower among the immigrant women (p=0.015). Both the proportion of 18:2 n-6 and the 18:3 n-6/18:2 n-6 ratio were higher in the serum of immigrant women than in that of Swedish-born women. In an earlier publication Citation19 the present subjects were compared with regard to the prevalence of certain cardiovascular risk factors, and a higher BMI, an increased prevalence of abdominal obesity and an unfavourable blood lipid profile (increased plasma TGs and reduced HDL-cholesterol concentrations) were found among the immigrant women compared with the Swedish-born women. In spite of a lower 16:1/16:0 ratio and a higher proportion of 18:2 n-6 in serum, the immigrant groups showed a less beneficial metabolic profile. The relationships between the fatty acid composition in plasma, on the one hand, and BMI, SAD and serum lipid concentration, on the other, therefore seemed to differ between the immigrant and the Swedish-born women. This may be related to diverging food patterns and sources of dietary fat, as shown in Figs. , but theoretically it may also be related to a different endogenous metabolism due to genetic differences or early programming. Other factors such as amount of physical activity may also be of importance. In the context of the average Swedish diet a high proportion of 18:2 n-6 seems to be related to a favourable risk situation Citation6. The situation may be quite different in immigrant groups, with a much higher habitual intake of linoleic acid on average, where the high 18:2 n-6 may be associated with an unfavourably high n-6/n-3 ratio in serum lipids. Several studies have shown that a low ratio between n-6 and n-3 fatty acids is more desirable in reducing the risk of many of the chronic conditions (CVD, diabetes, cancer and obesity) that are highly prevalent in Western societies, as well as in developing countries Citation34, Citation35.
In conclusion, clear differences in fatty acid composition in the diet were observed between women from the Middle East and women from Sweden. The differences were generally also reflected in serum CEs. The dietary fatty acid profile reflected the fat products used in the cooking characteristic of each ethnic group of women. For the group of women as a whole, the serum fatty acid profile was related to metabolic risk factors in an expected way. While the fatty acid profile in serum among the immigrant women indicated both favourable and unfavourable features, a higher prevalence of obesity and dyslipidaemia was observed in these women compared with Swedish-born women.
We would like to express our gratitude to Tahire Kocturk and åsa Andersson for performing the 24 h dietary recalls among Turkish and Swedish women, respectively. In addition, we would like to thank Lars Berglund and Rawya Mohsen for performing the statistical analysis and all co-workers at the metabolic ward and laboratories at the unit of Clinical Nutrition Research at the Departments of Public Health and Caring Sciences for their support. This study was financially supported by the Vardal Foundation and the Foundation for Geriatric Research.
References
- Födelselandets betydelse – en rapport om hälsan hos invandrargrupper i Sverige (The importance of country of birth – a report on health among different immigrant groups in Sweden). Stockholm: National Institute of Public Health; 2002. (In Swedish.)
- Kocturk T, Bruceå. The First European Workshop on Human Migration and Nutrition. Scand J Nutr 1996;40 (Suppl 2).
- SundquistJ, JohanssonSE. The influence of country of birth on mortality from all causes and cardiovascular disease in Sweden 1979–1993 Int J Epidemiol 1997 26 279–87
- SalmondCE, PriorIA, WessenAF. Blood pressure patterns and migration: a 14-year cohort study of adult Tokelauans Am J Epidemiol 1989 130 37–52
- SimonJA, HodgkinsML, BrownerWS, NeuhausJM, BernertJT Jr, HulleySB. Serum fatty acids and the risk of coronary heart disease Am J Epidemiol 1995 142 469–76
- VessbyB. Dietary fat, fatty acid composition in plasma and the metabolic syndrome Curr Opin Lipidol 2003 14 15–9
- JohanssonG, WikmanA, AhrenAM, HallmansG, JohanssonI. Underreporting of energy intake in repeated 24-hour recalls related to gender, age, weight status, day of interview, educational level, reported food intake, smoking habits and area of living Public Health Nutr 2001 4 919–27
- RosellMS, HelleniusML, FaireUH, JohanssonGK. Associations between diet and the metabolic syndrome vary with the validity of dietary intake data Am J Clin Nutr 2003 78 84–90
- FieldCJ, AngelA, ClandininMT. Relationship of diet to the fatty acid composition of human adipose tissue structural and stored lipids Am J Clin Nutr 1985 42 1206–20
- Van StaverenWA, DeurenbergP, KatanMB, BuremaJ, De GrootLC, HoffmansMD. Validity of the fatty acid composition of subcutaneous fat tissue microbiopsies as an estimate of the long-term average fatty acid composition of the diet of separate individuals Am J Epidemiol 123 455–63
- GlatzJF, SoffersAE, KatanMB. Fatty acid composition of serum cholesterol esters and erythrocyte membranes as indicators of linoleic acid intake in man Am J Clin Nutr 1989 49 269–76
- MaJ, FolsomAR, ShaharE, EckfeldtJH. Plasma fatty acid composition as an indicator of habitual dietary fat intake in middle-aged adults. The Atherosclerosis Risk in Communities (ARIC) Study Investigators Am J Clin Nutr 1995 62 564–71
- NikkariT, LuukkainenP, PietinenP, PuskaP. Fatty acid composition of serum lipid fractions in relation to gender and quality of dietary fat Ann Med 1995 27 491–8
- RiboliE, RonnholmH, SaracciR. Biological markers of diet Cancer Surv 1987 6 685–718
- SarkkinenES, AgrenJJ, AholaI, OvaskainenML, UusitupaMI. Fatty acid composition of serum cholesterol esters, and erythrocyte and platelet membranes as indicators of long-term adherence to fat-modified diets Am J Clin Nutr 1994 59 364–70
- LondonSJ, SacksFM, CaesarJ, StampferMJ, SiguelE, WillettWC. Fatty acid composition of subcutaneous adipose tissue and diet in postmenopausal US women Am J Clin Nutr 1991 54 340–5
- MaJ, FolsomAR, EckfeldtJH, LewisL, ChamblessLE. Short- and long-term repeatability of fatty acid composition of human plasma phospholipids and cholesterol esters. The Atherosclerosis Risk in Communities (ARIC) Study Investigators Am J Clin Nutr 1995 62 572–8
- National Cholesterol Education Program (NCEP) Expert Panel on Detection, Evaluation, and Treatment of High Blood Cholesterol in Adults (Adult treatment Panel III). Executive Summary of the Third Report. JAMA 2001;2486–97.
- DaryaniA, BerglundL, Anderssonå, KocturkT, BeckerW, VessbyB. Risk factors for coronary heart disease among immigrant women from Iran and Turkey, compared to women of Swedish ethnicity Ethn Dis 2005 15 213–20
- VessbyB, TengbladS, LithellH. Insulin sensitivity is related to the fatty acid composition of serum lipids and skeletal muscle phospholipids in 70-year-old man Diabetologia 1994 37 1044–50
- CallmerE, HagmanU, HaraldsdóttirJ, LokenEB, SeppänenR, TryggK. Proposal for the standardisation of 24-hour recall and similar interview methods Vår Föda 1986 38 Suppl 4 259–68
- Matmallen (Meal Model). Uppsala: Swedish National Food Administration; 1997
- BergströmL,EnghardtH, BeckerW, HagmanU. Vad är det vi äter? Livsmedelstabeller och livsmedelsdatabaser ger klart besked (Food composition tables and databases). Vår Föda 1997;49:23–7. (In Swedish.)
- GoldbergGR, BlackAE, JebbSA, ColeTJ, MurgatroydPR, CowardWA Critical evaluation of energy intake data using fundamental principles of energy physiology: 1. Derivation of cut-off limits to identify under-recording Eur J Clin Nutr 1991 45 569–81
- GaddM, JohanssonSE, SundquistJ, WandellP. Morbidity in cardiovascular diseases in immigrants in Sweden J Intern Med 2003 254 236–43
- WandellPE, PonzerS, JohanssonE, SundquistK, SundquistJ. Country of birth and body mass index: a national study of 2000 immigrants in Sweden Eur J Epidemiol 2004 19 11 1005–10
- WandellPE, Hjorleifsdottir SteinerK, JohanssonSE. Diabetes mellitus in Turkish immigrants in Sweden Diabetes Metab 2003 29 435–9
- KocturkT. Structure and changes in food habits Scand J Nutr/Näringsförskning 1996 2 108–10
- LovejoyJC, ChampagneCM, SmithSR, DeLanyJP, BrayGA, LefevreM Relationship of dietary fat and serum cholesterol ester and phospholipid fatty acids to markers of insulin resistance in men and women with a range of glucose tolerance Metabolism 2001 50 86–92
- PelikanovaT, KazdovaL, ChvojkovaS, BaseJ. Serum phospholipid fatty acid composition and insulin action in type 2 diabetic patients Metabolism 2001 50 1472–8
- LaaksonenDE, LakkaTA, LakkaHM, NyyssonenK, RissanenT, NiskanenLK Serum fatty acid composition predicts development of impaired fasting glycaemia and diabetes in middle-aged men Diabet Med 2002 19 456–64
- VessbyB, AroA, SkarforsE, BerglundL, SalminenI, LithellH. The risk to develop NIDDM is related to the fatty acid composition of the serum cholesterol esters Diabetes 1994 43 1353–7
- FeskensEJ. Can diabetes be prevented by vegetable fat? Diabetes Care 2001 24 1517–8
- SimopoulosAP. The importance of the ratio of omega-6/omega-3 essential fatty acids Biomed Pharmacother 2002 56 365–79
- AilhaudG, GuesnetP. Fatty acid composition of fats is an early determinant of childhood obesity: a short review and an opinion Obes Rev 2004 5 21–6