
 ?Mathematical formulae have been encoded as MathML and are displayed in this HTML version using MathJax in order to improve their display. Uncheck the box to turn MathJax off. This feature requires Javascript. Click on a formula to zoom.
ABSTRACT
Waning annual seasonality is documented in an up to one-month advance in spring onset since the 1980’s in northern latitudes, perturbing ecosystems and socio-economic performance. Summer temperatures, in contrast, have been rising only recently, indicating an offset in seasonal warming. The limited time span of this observational data makes the asynchronous pattern difficult to quantify, hindering projections of intra-annual dynamics. We explore temporal phase relations of seasonal warming over the Late Pleniglacial/Bølling and the Younger Dryas/Holocene climate transitions that preceded present anthropogenic warming. We determine past spring onset and thermal properties from dwarf birch paleo-phenology. Reconstructed spring warming led maximum summer warming by about a century during both transitions. Long-term reconstruction of intra-annual temperature regimes provides the perspective required for seasonal response analysis. Our results document that multi-decadal spring season warming precedes sudden summer temperature rise also during natural climate change. The rapidity of present seasonality changes, however, is unprecedented.
Introduction
Annual seasonality is diminishing in northern latitudes through rapid winter warming, opposed to more moderate summer warming (NASA GISS data Citation2019). Northern vegetation has responded with a significant advance in spring onset (defined by bud-burst and vegetation greening) exceeding a month in some regions since the 1980’s (Menzel et al. Citation2006; Xu et al. Citation2013; Wang et al. Citation2015). Prolonged vegetation greening contributes to climate change through altered albedo and hydrological pathways; exemplified starkly by the Arctic amplification phenomenon (Parmesan et al. Citation2012; Chae et al. Citation2015; Overland et al. Citation2016). In addition, earlier spring onset causes various phenological asynchronicities between plants and insects, with cascading idosynchratic effects through terrestrial trophic ecosystems (Primack et al. Citation2009; Richardson et al. Citation2013; Thackeray et al. Citation2016; Kharouba et al. Citation2018). Recently, higher summer temperatures have been observed globally, particularly in mid to high latitudes (Hansen & Sato Citation2016), suggesting a temporal offset between warmer springs and warmer summers in the ongoing climate change ().
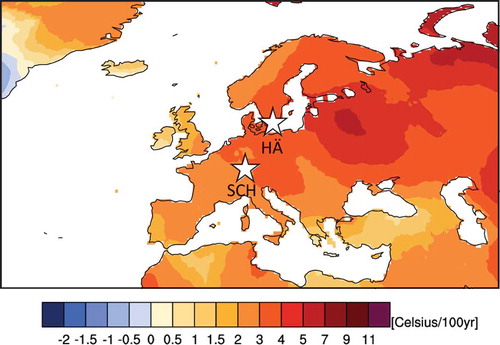
Figure 1. Localities of fossil sites plotted against spatial spring (March-April-May) temperature change during modern time period 1951–2015.
Legend: Temperature changes expressed as degree Celsius/100 year trends based on observational data using the CRU TS 4.00 data-set via the KNMI explorer (climexp.knmi.nl). White stars indicate locations of the sites Hässeldala (HÄ), Sweden and the Schleinsee (SCH), Germany.
Hotter summers are forecasted to further exacerbate negative effects on ecosystems and human societies, including extreme weather events and wildfires, loss of habitat, decreased food security, spread of pests and disease, as well as sharp increase in mortality by exceeding human thermoregulatory capacity (Sherwood & Huber Citation2010; Polgar & Primack Citation2011; Hansen et al. Citation2012; IPCC Citation2014; Mora et al. Citation2017). These rising summer temperatures are a robust trend – a “new normal” – and not a mere product of weather variability inherent to the climate system (Coumou & Rahmstorf Citation2012; Trenberth et al. Citation2015; Hansen & Sato Citation2016; Lewis et al. Citation2017). The ecological and socio-economic consequences of this intimate phenology-climate link are far-reaching, but extremely difficult to quantify or predict due to the severely limited time span of observational data. To place these emerging asynchronous spatial and temporal patterning of seasonality changes into a sufficiently broad climatological context, the analysis of long-term climate proxy records is essential.
Here we investigate two late-glacial natural warming episodes that each occurred within a few decades, thus resembling the ongoing global warming in rapidity and spatial expression (Steffensen et al. Citation2008; Heiri et al. Citation2014). These are the transitions from the Younger Dryas to the Holocene (YD/H: ~ 11.800 years before present = 11.8kyr BP) and the Late Pleniglacial to the Bølling (LP/B: ~ 14.8kyr BP). For these previous, fully completed, warming episodes we present high-resolution paleo-phenological records derived from image-analysis of sub-fossil leaves of the arctic shrub Betula nana (dwarf birch). The leaf cuticle morphology records growing season thermal conditions expressed as Growing Degree Days (GDD5: the cumulative seasonal sum of degree Celsius (°C) above a threshold value of 5°C for subarctic biomes) during the growth period and correlates to bud-burst dates indicative for spring onset (Wagner-Cremer et al. Citation2010). In combination with independently reconstructed summer temperatures, seasonal warming patterns are quantified, their phase relations deciphered and compared to the ongoing climate development. So far, winter vs summer season-resolved paleo-temperature data from single-source material are available only from Greenland ice-core records (Vinther et al. Citation2010) and from rare palynological studies (Veski et al. Citation2014). Such records, however, reconstruct the individual temperature dynamics without synthesising intra-annual seasonal dynamics. Increasingly applied, data-constrained spatio-temporal paleoclimate models stress the importance of diverging seasonal warming during the last deglaciation (Buziert et al. Citation2014, Citation2018). Model comparisons to temperature reconstructions based on proxy-data often implement summer temperatures only, and suffer from inconsistencies in regional analysis of seasonal temperature changes (Zhang et al. Citation2016, Citation2017; Schenk et al. Citation2018). We here present long-term data such as required for full-extent seasonal response analyses in the terrestrial realm. These data include morphological measurements of plant leaf cells, compared with new and previously published pollen and chironomid reords. Importantly, our seasonal reconstructions are based on multi-proxy analysis from single sediment sections, overcoming numerous error sources relating to age determination, chronology and between-site variability. By explicitly quantifying spring-onset related phenological traits such as bud-burst date, we directly compare past and present vegetation response to seasonal climate change and capture the early season dynamics.
Materials and methods
Localities and leaf databases
The first Betula nana image databases used in this study derives from a Late Glacial paleo-lake sedimentary sequence of the Hässeldala Port (HÄ) locality located in southern Sweden (). Previous studies have reconstructed the stratigraphy and chronology through pollen, tephra and 14C data analyses, as well as the paleo-climate and environment with multiple biogeochemical proxies including a chironomid-based temperature record and climate model simulations (Steinthorsdottir et al. Citation2013, Citation2014; Muschitiello et al. Citation2015; Wohlfarth et al. Citation2017). The HÄ database encompasses the period 12.5–11.75kyr BP and thus includes the abrupt warming at the end of the Younger Dryas.
The second Betula nana database derives from leaves preserved in 15.2–14.4kyr BP old sediments from Schleinsee (SCH) in southern Germany (), spanning the termination of the last glacial and the onset of the interstadial (i.e. the Bølling-Allerød warm phase). The chronology for the SCH sediment section was obtained by 14C data analyses and a bulk carbonate stable oxygen isotope (δ18O) record that is tied to the Greenland NGRIP δ18O record (Wagner-Cremer & Lotter Citation2011). The July temperature record has been reconstructed based on pollen from the same sediment section (Fig. S2).
Micromorphological analysis of fossil Betula nana leaf samples
Microscopic analysis of micromorphological epidermal cell parameters has been performed on all available leaf remains ranging from a total number of 2–12 subfossil leaf fragments in each sampled horizon of 1 cm core section at both sites totalling 101 leaf fragments deriving from HÄ and 53 from SCH. Sample availability strongly depends on abundance and cuticle preservation in the sediments. Analysis of the leaf-area margin was avoided to minimize errors induced by the intrinsic variability of the leaves; species determination is based on species-specific stomatal size (Wagner et al. Citation2000). Micromorphological epidermal cell characteristics are subsequently converted to GDD5 and bud-burst dates using transfer functions deduced from modern training sets as described below.
Undulation index (UI)
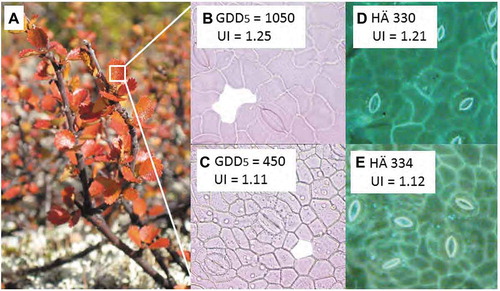
Ultimate leaf size is a function of initial epidermal cell division and successive lateral epidermal cell expansion leading to the final leaf size at the end of the growing season (Wagner-Cremer et al. Citation2010). The waxy cuticles of leaves reflect epidermal cell properties as size and shape and are resistant to decomposition and diagenetic processes during burial in sediments. Epidermal cell areas (CA [μm2]) and epidermal cell circumferences (CC [μm]) of minimal 30 cells per leaf fragment, after which standard deviations become constant, were analyzed using computer aided image analysis of microscopic photographs taken from modern and fossil leaf material using either transmitted light or fluorescence microscopy ().
Figure 2. Betula nana epidermal cell properties in modern and fossil leaves.
A. annually collected Betula nana leaf samples from Kevo are used to calibrate UI against high B. to low C. GDD5 values measured over the time period from 1996 and 2015. Well-preserved fossil Betula nana cuticles enable the quantification of the UI which shows the same range of D. high UI and, E. low UI values here from representative fossil cuticles in the Hässeldala (HÄ) section at core depth 330 cm and 334 cm.
From CA and CC values, the epidermal cell–wall undulation index:
was calculated for each leaf fragment, following Kürschner (Citation1997). The UI measures the deviation between the circumference of a cell (CC) with a given cell area (CA) and the circumference of a circle with the same area.
GDD5 and bud-burst date inference models
Routinely applied leaf cuticle morphology analysis of the (sub-)arctic canopy species Betula nana from the phenological station at Kevo, Finland, has shown that the thermal properties of the growing season (April–September, AMJJAS), expressed as GDD5, produce a quantifiable imprint in leaf morphology (Wagner-Cremer et al. Citation2010). The UI of Betula nana in the modern training set is linearly correlated to the range of 450–1050°C GDD5 that occurred during the past 20 years of continuous monitoring (Wagner-Cremer et al. Citation2010) (; Fig. S1). Moreover, a significant correlation between UI and the date of bud-burst allows also for concomitant estimates of the timing of phenological spring onset (Wagner-Cremer et al. Citation2010) (Fig. S1).
The mean UI values subsequently determined from fossil leaves are used to infer GDD5 and bud-burst dates by applying the species-specific prediction models based on modern training sets (Wagner-Cremer & Lotter Citation2011) ().
Table 1. GDD5 and bud-burst inference models. Inference models for GDD5 and bud-burst dates based on double log transformation of modern training sets of Betula nana UI values from Kevo and climate station data as well as phenological records from the same site.
Results
Reconstruction of spring onset and seasonal temperature dynamics
The HÄ reconstruction (; Fig. S2), beginning at 12.5kyr BP, records GDD5 of 650–680°C and reaches minimum values of 640°C between 12.2kyr BP and 12.1kyr BP, after which GDD5 increase to maximum values of 800°C at 11.8kyr BP. The chironomid-inferred July temperature over the record at HÄ shows minor temperature fluctuations centred around 9.2°C for the interval from 12.4kyr BP to 11.95kyr BP, where a rapid increase in July temperature cumulates in maximum summer temperatures of 11.4°C at 11.75kyr BP (from Muschitiello et al. Citation2015). Summer temperature reconstructions are commonly provided as July temperatures, but here we present a direct comparison between our spring onset data and maximum summer temperatures by providing bud-burst data as days before mid-July (as maximum temperature tie-point, which we refer to from here on as maximum summer warmth: MSW), to avoid potential differences in season timing between the Late Quaternary and today. From 12.5kyr BP to 12.25kyr BP spring onset occurs ~43 days before MSW, then retreats to a minimum of 39 days before MSW until 12.1kyr BP, after which spring onset advances to a maximum of 53 days before MSW at 11.8kyr BP. Besides the clear dynamics of the growing season length, we determine a distinct 130 year offset between spring onset and MSW towards the end of the Younger Dryas – that is, it takes MSW ~130 years to catch up to the early spring onset (see ).
Figure 3. Proxy-derived growing season thermal properties and maximum summer warmth (MSW = July temperature) over the Younger Dryas – Holocene and Late Pleniglacial – Bølling transitions.
A. Green line – GDD5 reconstruction based on fossil Betula nana leaf fragments from the Hässeldala site (Sweden) with RMSE as grey envelope. Red line: MSW (July temperature (°C) reconstructed by chironomid analysis from the same sediment core, 3-point average of data (Muschitiello et al. Citation2015). Green shaded area is the onset of vegetation greening deduced from reconstructed Betula nana bud-burst dates as number of days before MSW for comparison to proxy-based summer temperature. Betula nana leaf pictures visualise the relative size changes in foliage under varying thermal conditions. Stippled lines delineate onset of GDD5 increase and initial increase in July temperatures in the proxy records. B. GDD5 reconstruction based on fossil Betula nana leaf fragments from the Schleinsee site (Germany) with RMSE as grey envelope. Red line: MSW (July temperature (°C) reconstructed by pollen analysis) from the same sediment core. Green shaded area and stippled lines show onset of greening and offset between GDD5 accumulation and July temperature (°C) for the Late Pleniglacial – Bølling transition quantified as in panel A.
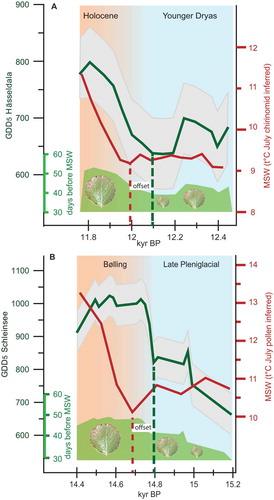
The SCH dataset (; Fig. S2) begins at 15.12kyr BP where Late Pleniglacial low GDD5 values of 665°C are recorded, followed by a successive increase to ~850°C prevailing from 15kyr BP to 14.75kyr BP. A sudden jump to maximum GDD5 of 1000°C is completed within less than a century where high GDD5 prevail until 13.2kyr BP. SCH summer temperatures are estimated from pollen analysis revealing relatively constant low MSW values of ~10.5°C between 15.2kyr BP to 14.7kyr BP, from where a continues increase leads up to MSW of 13.3°C at 14.4kyr BP. Spring onset at SCH occurs 33 days before MSW at 15.2kyr BP, and a two-step advance to ~40 days before MSW between 15kyr BP and 14.8kyr BP from where a rapid increase leads up to a maximal spring advance to 50 days before MSW at 14.75kyr BP, prevailing for the remaining record. Importantly, also here we detect a distinct 110 year offset between spring onset and MSW towards the end of the Late Pleniglacial, with MSW reaching a maximum ~110 years later than early spring onset. Note that the overall much higher GDD5 for SCH compared to HÄ reflects the latitudinal temperature gradient between the two sites.
Discussion
For both studied sections, a spring advance of 1–1.5 days/decade is calculated for the intervals of most rapidly changing bud-burst dates. At SCH the advance seems to be slightly more rapid than at HÄ, however, a more detailed analysis requires a higher temporal resolution than is available for our sections. This 1–1.5 days/decade spring advance is significantly slower than the modern spring greening advance, shown by remote sensing data-based calculations to be between 3 to more than 12 days/decade since the 1980’s, in the Eurasian arctic to boreal realm (Menzel et al. Citation2006; Xu et al. Citation2013). Betula nana, however, has been shown to emerge late in the modern plant community bud-burst succession (Post et al. Citation2016), which can explain the discrepancy with satellite monitoring of the entire vegetation in an area. Our results thus either pick up a potentially weakened signal, or illustrate the unprecedented pace of the Anthropogenic climate change in the northern latitudes.
Our paleo-records indicate an offset between spring and summer warming during natural phases of climate change, where rapid spring warming leads by approximately a century. This divergence in seasonal response to climatic triggers constrains modelled asynchronous responses determined for the warming episodes during the last deglaciation (Buizert Citation2015). Such temporal and spatial response estimates suggest that over Greenland, intensive winter warming exceeds the ultimate summer and, thus, mean annual temperature shifts (Buziert et al. Citation2018; Salonen et al. Citation2018). Asynchronous warming over Greenland is attributed to reorganization of Atlantic meridional overturning circulation, freshwater forcing and atmospheric CO2 dynamics (Buizert Citation2015; Buziert et al. Citation2018). Data-constrained simulations of July temperatures over the B–YD time interval show that relatively high summer temperatures prevail during the YD over large parts of the northern hemisphere, where the main temperature change is explained by intensification of continentality and, thus winter to spring cooling (Schenk et al. Citation2018). Our seasonally resolved temperature reconstructions underpin the relevance of winter and successive spring warming in annual temperature dynamics also during rapid warming phases. Uniquely, we are able to quantify the extremely dynamic seasonal warming outside of Greenland, where ice-core based modelling efforts may exceed their prediction limits. Such records from the terrestrial realm are thus a prerequisite to document the spatio-temporal phase relations of seasonal temperature over the large geographical realm undergoing rapid climate change, after oceanic and/or atmospheric reorganizations. Decoupling of seasonal temperatures during other geological periods which may serve as potential analogues for present climate change, such as the Eemian interglacial, has recently been highlighted by proxy-based temperature reconstructions, where the mixed imprints of insolation and oceanic forcing regulates seasonality expression in the high northern Latitudes (Salonen et al. Citation2018). The link to potential CO2 forcing during the Eemian, however is low. For the more recent climate episodes studied here, CO2 forcing needs to be considered (Steinthorsdottir et al. Citation2013, Citation2014). The CO2 dynamics during past rapid climate change as well as warmer-than-present episodes are related, however, to natural feedback mechanisms whereas ongoing warming is clearly related to the anthropogenic CO2 increase (IPCC Citation2014) and potentially develops alternative feedbacks. In the context of the ongoing climate change, where close to 40 years of spring warming has already occurred, assuming that the Arctic behaves similarly during the current warming to the two warming transitions we have shown for the late glacial, then we can expect that the rise in summer temperature will occur within 60 years. Given the pace of the present warming however, with at least twice the rate of spring onset advance measured in days/decade, as well as recent documented shifts in mid–low latitudes towards hotter summer temperatures (Hansen & Sato Citation2016), it is well possible that this threshold will be reached much sooner.
Author contributions
MS produced the HÄ cuticle morphology record. FWC produced the SCH cuticle morphology record. FWC and MS co-designed the study and wrote the manuscript.
Data and materials availability
All data generated and analysed during this study are included in this published article (and its Supplementary Information files) or available from the Bolin Centre for Climate Research online database (url here).
Supplementary_Dataset.xlsx
Download MS Excel (1.3 MB)Supplementary_Materials.pdf
Download PDF (483.8 KB)Acknowledgments
We thank B. Wohlfarth, F. Schenck, and W.M. Kürschner for useful discussions. M.S. acknowledges funding from the Swedish Research Council (Starting Grant NT7-2016 04905) and additional support from the Bolin Centre for Climate Research, Stockholm University. Kevos Subarctic Research Station staff is acknowledged for help with leaf sampling and phenological observations. T. Donders, F. Bunnik, J.H.H. Bos and A.F. Lotter are acknowledged for the SCH pollenanalysis and July temperature reconstruction.
Disclosure statement
No potential conflict of interest was reported by the authors.
Supplementary material
Supplementary data for this article can be accessed online here: https://doi.org/10.1080/11035897.2019.1655791
Additional information
Funding
Related Research Data
References
- Buizert, C., WAIS Divide Project Members, 2015: Precise interpolar phasing of abrupt climate change during the last ice age. Nature 520, 661–665. doi: 10.1038/nature14401.
- Buziert, C., Gkinis, V., Severinghaus, J.P., He, F., Lecavalier, B.S., Kindler, P., Leuenberger, M., Carlson, A.E., Vinther, B., Masson-Delmotte, V., White, J.W.C., Liu, Z., Otto-Bliesner, B. & Brook, E.J., 2014: Greenland temperature response to climate forcing during the last deglaciation. Science 345, 1177–1180. doi: 10.1126/science.1254961.
- Buziert, C., Keisling, B.A., Box, J.E., He, F., Carlson, A.E., Sinclair, G. & DeConto, R.M., 2018: Greenland-wide seasonal temperatures during the last deglaciation. Geophysical Research Letters 45, 1905–1914. doi: 10.1002/2017GL075601.
- Chae, Y., Kang, S.M., Jeong, S.-J., Kim, B. & Frierson, D.M.W., 2015: Arctic greening can cause earlier seasonality of Arctic amplification. Geophysical Research Letters 42, 536–541. doi: 10.1002/2014GL061841.
- Coumou, D. & Rahmstorf, S., 2012: A decade of weather extremes. Nature Climate Change 2, 491–496. doi: 10.1038/nclimate1452.
- Hansen, J. & Sato, M., 2016: Regional climate change and national responsibilities. Environmental Research Letters 11, 034009. doi: 10.1088/1748-9326/11/3/034009.
- Hansen, J., Sato, M. & Ruedy, R., 2012: Perception of climate change. Proceedings of the National Academy of Sciences of the United States of America 109, 14726–14727. doi: 10.1073/pnas.1205276109.
- Heiri, O., Brooks, S.J., Renssen, H., Bedford, A., Hazekamp, M., Ilyashuk, B., Jeffers, E.S., Lang, B., Kirilova, E., Kuiper, S., Millet, L., Samartin, S., Toth, M., Verbruggen, F., Watson, J.E., van Asch, N., Lammertsma, E., Amon, L., Birks, H.H., Mortensen, M.F., Hoek, W.Z., Magyari, E., Munoz Sobrino, C., Seppä, H., Tinner, W., Tonkov, S., Veski, S. & Lotter, A.F., 2014: Validation of climate model-inferred regional temperature change for late-glacial Europe. Nature Communications 5, 1–7. doi: 10.1038/ncomms5972.
- IPCC. 2014. Climate change 2014: impacts, adaptation, and vulnerability. Part A: global and sectoral aspects. Contribution of Working Group II to the Fifth Assessment Report of the Intergovernmental Panel on Climate Change 1132 (Cambridge Univ. Press, 2014).
- Kharouba, H.M., Ehrlén, J., Gelman, A., Bolmgren, K., Allen, J.M., Travers, S.E. & Wolkovich, E.M., 2018: Global shifts in the phenological synchrony of species interactions. Proceedings of the National Academy of Sciences of the United States of America 20, 5211–5216. doi: 10.1073/pnas.1714511115.
- Kürschner, W.M., 1997: The anatomical diversity of recent and fossil leaves of the durmast oak (Quercus petrea Lieblein/Q. pseudocastanea Goeppert) – implications for their use as biosensors of palaeoatmospheric CO2 levels. Review of Paleobotany and Palynology 96, 1–30. doi: 10.1016/S0034-6667(96)00051-6.
- Lewis, S.C., King, A.D. & Perkins-Kirkpatrick, S.E., 2017: Defining a new normal for extremes in a warming world. Bulletin of the American Meteorological Society Published online doi: 10.1175/BAMS-D-16-0183.1.
- Menzel, A., Sparks, T.H., Estrella, N., Koch, E., Aasa, A., Ahas, R., Alm-Kübler, K., Bissolli, P., Braslavská, O., Briede, A., Chmielewski, F.M., Crepinsek, Z., Dahl, C.Y., Defila, Å., Donnelly, C., Filella, A., Jatczak, Y., Måge, K., Mestre, F., Nordli, A., Penuelas, Ø., Pirinen, J., Remisová, P., Scheifinger, V., Striz, H., Susnik, M., van Vliet, A., Wielgolask, A.J.H., Zach, F.-E. & Zust, A., 2006: European phenological response to climate change matches the warming pattern. Global Change Biology 12, 1969–1976. doi: 10.1111/j.1365-2486.2006.01193.x.
- Mora, C., Dousset, B., Caldwell, I.R., Powell, F.E., Geronimo, R.C., Bielecki, C.R., Counsell, C.W.W., Dietrich, B.S., Johnston, E.T., Louis, L.V., Lucas, M.P., McKenzie, M.M., Shea, A.G., Tseng, H., Giambelluca, T.W., Leon, L.R., Hawkins, E. & Trauernicht, C., 2017: Global risk of deadly heat. Nature Climate Change 7, 501–506. doi: 10.1038/nclimate3322.
- Muschitiello, F., Pausata, F.S.R., Watson, J.E., Smittenberg, R.H., Salih, A.A.M., Brooks, S.J., Whitehouse, N.J., Karlatou-Charalampopolou, A. & Wohlfarth, B., 2015: Fennoscandian freshwater control on Greenland hydroclimate shifts at the onset of the Younger Dryas. Nature Communications 6, 8939. doi: 10.1038/ncomms9939.
- NASA GISS data, 2019: https://data.giss.nasa.gov/gistemp/
- Overland, J.E., Dethloff, K., Francis, J.A., Hall, R.J., Hanna, E., Kim, S.-J., Screen, J.A., Shepherd, T.G. & Vihma, T., 2016: Nonlinear response of mid-latitude weather to the changing Arctic. Nature Climate Change 6, 992–999. doi: 10.1038/nclimate3121.
- Parmesan, C., Burrows, M.T., Duarte, C.M., Poloczanska, E.S., Richardson, A.J., Schoeman, D.S. & Singer, M.C., 2012: Beyond climate change attribution in conservation and ecological research. Ecology Letters 16, 58–71. doi: 10.1111/ele.12098.
- Polgar, C.A. & Primack, R.B., 2011: Leaf-out phenology of temperate woody plants: from trees to ecosystems. New Phytologist 191, 926–941. doi: 10.1111/nph.2011.191.issue-4.
- Post, E., Kerby, J., Pedersen, C. & Steltzer, H., 2016: Highly individualistic rates of plant phenological advance associated with arctic sea ice dynamics. Biology Letters 12, 20160332. doi: 10.1098/rsbl.2016.0332.
- Primack, R.B., Ibánez, I., Higuchi, H., Lee, S.D., Miller-Rushing, A.J., Wilson, A.M. & Silander, J.A., Jr., 2009: Spatial and interspecific variability in phonological responses to warming temperatures. Biology Conservation 142, 2569–2577. doi: 10.1016/j.biocon.2009.06.003.
- Richardson, A.D., Keenan, T.F., Migliavacca, M., Ryu, Y., Sonnentag, O. & Toomey, M., 2013: Climate change, phenology, and phenological control of vegetation feedbacks to the climate system. Agricultural and Forest Meteorology 169, 156–173. doi: 10.1016/j.agrformet.2012.09.012.
- Salonen, J.S., Helmens, K.F., Brendryen, J., Kuosmanen, N., Väliranta, M., Goring, S., Korpela, M., Kylander, M., Philip, A., Plikk, A., Renssen, H. & Luoto, M., 2018: Abrupt high-latitude climate events and decoupled seasonal trends during the Eemian. Nature Communications 9, 2851. doi: 10.1038/s41467-018-05314-1.
- Schenk, F., Väliranta, M., Muschitiello, F., Tarasov, L., Heikkilä, M., Björck, S., Brandefelt, J., Johansson, A.V., Näslund, J.-O. & Wohlfarth, B., 2018: Warm summers during the Younger Dryas cold reversal. Nature Communications 9, 1634. doi: 10.1038/s41467-018-04071-5.
- Sherwood, S.C. & Huber, M., 2010: An adaptability limit to climate change due to heat stress. Proceedings of the National Academy of Sciences of the United States of America 107, 9552–9555. doi: 10.1073/pnas.0910097107.
- Steffensen, J.P., Andersen, K.K., Bigler, M., Clausen, H.B., Dahl-Jensen, D., Fischer, H., Goto-Azuma, K., Hansson, M., Johnsen, S.J., Jouzel, J., Masson-Delmotte, V., Popp, T., Rasmussen, S.O., Röthlisberger, R., Ruth, U., Stauffer, B., Siggaard-Andersen, M.-L., Sveinbjörnsdóttir, Á.E., Svensson, A. & White, J.W.C., 2008: High-resolution Greenland ice core data show abrupt climate change happens in few years. Science 321, 680–684. doi: 10.1126/science.1157707.
- Steinthorsdottir, M., de Boer, A.M., Oliver, K.I.C., Muschitiello, F., Blaauw, M., Reimer, P.J. & Wohlfarth, B., 2014: Synchronous records of pCO2 and ∆14C suggest rapid, ocean-derived pCO2 fluctuations at the onset of Younger Dryas. Quaternary Science Reviews 99, 84–96. doi: 10.1016/j.quascirev.2014.06.021.
- Steinthorsdottir, M., Wohlfarth, B., Kylander, M.E., Blaauw, M. & Reimer, P.J., 2013: Stomatal proxy record of CO2 concentrations from the last termination suggests an important role for CO2 at climate change transitions. Quaternary Science Reviews 68, 43–58. doi: 10.1016/j.quascirev.2013.02.003.
- Thackeray, S.J., Henrys, P.A., Hemming, D., Bell, J.R., Botham, M.S., Burthe, S., Helaouet, P., Johns, D.G., Jones, I.D., Leech, D.I., Mackay, E.B., Massimino, D., Atkinson, S., Bacon, P.J., Brereton, T.M., Carvalho, L., Clutton-Brock, T.H., Duck, C., Edwards, M., Elliott, J.M., Hall, S.J.G., Harrington, R., Pearce-Higgins, J.W., Høye, T.T., Kruuk, L.E.B., Pemberton, J.M., Sparks, T.H., Thompson, P.M., White, I., Winfield, I.J. & Wanless, S., 2016: Phenological sensitivity to climate across taxa and trophic levels. Nature 535, 241–245. doi: 10.1038/nature18608.
- Trenberth, K.E., Fasullo, J.T. & Shepherd, T.G., 2015: Attribution of climate extreme events. Nature Climate Change 5, 725–730. doi: 10.1038/nclimate2657.
- Veski, S., Seppä, H., Stancikaíté, M., Zernitskaya, V., Reitalu, T., Gryguc, G., Heinsalu, A., Stivrins, N., Amon, L., Vassiljev, J. & Heiri, O., 2014: Quantitative summer and winter temperature reconstructions from pollen and chironomid data between 15 and 8 ka BP in the Baltic-Belarus area. Quaternary International 388, 4–11. doi: 10.1016/j.quaint.2014.10.059.
- Vinther, B.M., Jones, P.D., Briffa, K.R., Clausen, H.B., Andersen, K.K., Dahl-Jensen, D. & Johnsen, S.J., 2010: Climatic signals in multiple highly resolved stable isotope records from Greenland. Quaternary Science Reviews 29, 522–538. doi: 10.1016/j.quascirev.2009.11.002.
- Wagner, F., Kürschner, W.M., Neuvonen, S. & Visscher, H., 2000: The influence of hybridization on epidermal properties of birch species and the consequences for palaeoclimatic interpretations. Plant Ecology 148, 61–69. doi: 10.1023/A:1009801614786.
- Wagner-Cremer, F., Finsinger, W. & Moberg, A., 2010: Tracing growing degree-day changes in the cuticle morphology of Betula nana leaves: a new micro-phenological palaeo-proxy. Journal of Quaternary Science 25, 1008–1017. doi: 10.1002/jqs.1388.
- Wagner-Cremer, F. & Lotter, A.F., 2011: Spring-season changes during the late pleniglacial and Bølling/Allerød interstadial. Quaternary Science Reviews 30, 1825–1828. doi: 10.1016/j.quascirev.2011.05.003.
- Wang, C., Cao, R., Chen, J., Rao, Y. & Tang, Y., 2015: Temperature sensitivity of spring vegetation phenology correlates to within-spring warming speed over the Northern Hemisphere. Ecological Indicators 50, 62–68. doi: 10.1016/j.ecolind.2014.11.004.
- Wohlfarth, B., Muschitiello, F., Greenwood, S.L., Andersson, A., Kylander, M., Smittenberg, R.H., Steinthorsdottir, M., Watson, J. & Whitehouse, N.J., 2017: Hässeldala – a key site for last termination climate events in northern Europe. Boreas 46, 143–161. doi: 10.1111/bor.12207.
- Xu, L., Myneni, R.B., Chapin III, F.S., Callaghan, T.V., Pinzon, J.E., Tucker, C.J., Zhu, Z., Bi, J., Ciais, P., Tømmervik, H., Euskirchen, E.S., Forbes, B.C., Piao, S.L., Anderson, B.T., Ganguly, S., Nemani, R.R., Goetz, S.J., Beck, P.S.A., Bunn, A.G., Cao, C. & Stroeven, J.C., 2013: Temperature and vegetation seasonality diminishment over northern lands. Nature Climate Change 3, 581–586. doi: 10.1038/nclimate1836.
- Zhang, P., Linderholm, H.W., Gunnarson, B.E., Björklund, J. & Chen, D., 2016: 1200 years of warm-season temperature variability in central Scandinavia inferred from tree-ring density. Climate of the Past 12, 1297–1312. doi: 10.5194/cp-12-1297-2016.
- Zhang, Y., Renssen, H., Seppä, H. & Valdes, P.J., 2017: Holocene temperature evolution in the Northern Hemisphere high latitudes – model-data comparisons. Quaternary Science Reviews 173, 101–113. doi: 10.1016/j.quascirev.2017.07.018.