
Abstract
Background: Occupational balance is fundamental to occupational therapy and occupational science. Therefore, the Occupational Balance Questionnaire (OBQ) was developed and has previously been found psychometrically valid according to classical test theory.
Aim: To investigate the internal construct validity of the OBQ using Rasch measurement theory.
Material and methods: Data from two general population samples were used to investigate the psychometric properties of the OBQ according to Rasch measurement theory.
Results: The analyses identified problems with the current response scale and multidimensionality of two items. As a result, a revised version, the OBQ11, was suggested and exhibited response categories that worked properly, good reliability (0.92), model fit and measurement invariance across age and gender groups. The hierarchical item ordering was in agreement with previous research.
Conclusion: The new OBQ11 satisfies the measurement criteria defined by the Rasch model. However, further studies of additional samples are needed to validate its generic properties.
Significance: The purpose of the OBQ11 is to measure occupational balance of individuals or groups, and to identify aspects of occupational balance in need of improvement. Our observations suggest that the OBQ11 is a valid and promising complement to other instruments.
Introduction
Occupational balance has been fundamental to occupational therapy theory and practice ever since the birth of the profession [Citation1]. Occupational balance is not focusing on balancing different occupations into equal proportions or equilibrium. Rather it is a complex concept and it is conceptualized and measured in different ways, focusing on various aspects such as need satisfaction [Citation2–3], levels of meaningfulness [Citation4], and types of occupation [Citation5], as described below.
Matuska [Citation2] developed the Life Balance Inventory (LBI) conceptualizing life balance, based on the life balance model [Citation3] and defines it as ‘a satisfying pattern of daily activity that is healthful, meaningful and sustainable to an individual within the context of his or her current situation’ (p. 11). LBI consists of 53 predefined activities and people rate how satisfied they are with how much time they spent doing the activity in the last month. Furthermore, balance is assessed as congruence and equivalence, where congruence means a match between actual and desired activity configuration, and equivalence means approximately equal apportioning of time use across the four needs dimensions. Eakman [Citation4] developed the Meaningful Activity Wants and Needs Assessment (MAWNA), and he defined life balance as high levels of meaningful activity concurrently with low needs for additional meaningful activity experiences [Citation4]. MAWNA assesses the balance between actual and desired engagement in meaningful occupations. Dür et al. [Citation5] developed the Occupational Balance Questionnaire (OB-Quest) among people with autoimmune diseases and healthy people. They found that occupational balance includes the following components: balance between different types of occupations, between abilities and resources, and between one’s own and others’ needs. Based on these components 10 items were developed.
However, another important aspect of occupational balance, not yet addressed in a measurement is ‘the experience of having the right amount of occupations and the right variation between occupations in the occupational pattern’ [Citation6, p. 326] (regardless of what the occupations are). Therefore, we developed the Occupational Balance Questionnaire (OBQ) [Citation7]. It intends to be a generic instrument to evaluate occupational balance of individuals and groups. In occupational therapy a valid and reliable instrument to measure this conceptualization of occupational balance is needed. The conceptual framework for the OBQ is based on results from previous research on the experience of occupational balance in different groups [Citation8–10], and a concept analysis of occupational balance [Citation6]. Types of indicators that are useful for eliciting occupational balance were developed based on these studies (potential item format). The 13 OBQ items () have six ordered response categories with verbal descriptions and the participant rates his/her level of agreement with different aspects of amount of and variation between occupations in the occupational pattern (0 = completely disagree, 1 = disagree a lot, 2 = tend to disagree, 3 = tend to agree, 4 = agree a lot, and 5 = completely agree). Item scores are summed into a total score that can range from 0 to 65. A higher score means a higher occupational balance. The OBQ focuses on the variation in the occupational pattern (between different types of occupations, between doing things for oneself and for others, between doing things alone and together with others), the amount of each occupation and the total amount of occupations (amount of, time for, number of), and the perceived meaningfulness in the occupations. All these aspects are considered necessary for the experience of occupational balance.
Table 1. The OBQ items (short form).
The OBQ was piloted using classical test theory (CTT) to evaluate its psychometric properties [Citation7]. Results showed good total score internal consistency (Cronbach alpha, 0.94) and test-retest reliability (Spearman’s Rho, 0.93) without any floor or ceiling effects. Test-retest reliability of individual items varied between 0.61–0.83.
However, CTT approaches to assessing the measurement properties of scales have limitations [Citation11–13]. For example, it rests on assumptions that cannot be readily tested and is largely based on correlation analyses, which has limited relevance to the concept of measurement as understood in physical sciences as well as in common language (e.g. in terms of common ruler) [Citation12,Citation13]. Additionally, CTT does not readily allow for assessment of fundamental aspects of the measurement process, such as whether response categories work as expected and whether the instrument works in the same manner across different subsets of respondents. To this end, the Rasch measurement model [Citation14] provides a powerful alternative by determining the extent to which observed data confirm with the model [Citation11–15]. The Rasch model is a general unidimensional measurement model for latent variables that is based on the same principles as measurements in physical sciences; the model states that the probability of a certain item response depends on the level of the measured construct represented by the item and the person, respectively [Citation16,Citation17]. As such, it provides a detailed account for the extent to which item responses are productive in producing objective measures at an interval level, as well as a powerful diagnostic tool regarding any anomalies that contradict objective measurement (e.g. whether response categories work as intended and if items are working the same way across respondent subgroups). Furthermore, the Rasch model determines empirically how items (and persons) are ordered on a latent continuum from less to more of the target variable, which allows for an investigation of the coherence between the instrument and its underpinning theory [Citation18,Citation19]. As such, Rasch measurement theory (RMT) provides a valuable and theoretically as well as clinically appropriate tool in assessing the measurement properties of rating scale based instruments [Citation11–15,Citation18].
Aim
The aim of the present study was to investigate the internal construct validity of the OBQ in a general population using Rasch measurement theory. Specifically, item fit, reliability, response categories, differential item functioning and logical hierarchical ordering of the items were assessed.
Material and methods
Participants
As this article reports a process, data collection was conducted in two phases and included two samples (Samples 1 and 2) from general populations in Southern Sweden. They were selected through purposive sampling. The authors and their students used their network to identify presumptive participants, and they received an information letter that invited them to the study, detailing the aim and study design. It also explained that it was voluntary to take part in the study and that the participants could withdraw from the study at any time without giving any explanation. Finally, the letter explained that the participants answered the OBQ anonymously and that no unauthorized person would have access to the data. An addressed return enveloped was also added. The inclusion criteria were persons 20 years old and older (as they are no longer in school) and the ability to understand Swedish. A heterogeneous sample regarding age and gender was the goal.
Data analyses
In this study, the OBQ was tested according to RMT (12, 14, 15). Specifically, reliability, Rasch model fit, rating scale response category functioning, uniform and non-uniform Differential Item Functioning (DIF) by gender and age (younger vs. older persons, as defined by the median), targeting, and the logic of the hierarchical item ordering were addressed. Reliability was estimated using the Pearson Separation Index (PSI), which is conceptually analogous to coefficient alpha [Citation20], and should preferably be at least 0.8 [Citation12]. Fit between empirical data and the unidimensional Rasch measurement model was examined from several perspectives. Individual item fit residuals represent discrepancies between empirical responses and model expectations and should range between about −2.5 and 2.5, with the ideal being 0 [Citation21]. Overall, the mean standardized item and person fit residuals should be close to 0 with a standard deviation close to 1. Chi-square statistics test whether the difference between the observed and expected values for each item is statistically significant or not. In general, non-significant Chi-square statistic supports fit to the model. In addition, accordance between item response data and model expectations was examined graphically by inspection of item characteristic curves (ICC). Taken together, these analyses provide evidence of potential anomalies between any particular item which may over- or under discriminate relative to the summary discrimination of all items [Citation22]. Anomalies may arise due to measurement problems such as local response dependence, multidimensionality or poor item quality, which may threaten validity [Citation19]. Large negative standardized fit residuals suggest over-discriminating items and local response dependence, whereas large positive residual values indicate under-discriminating items and are typically due to local trait dependence (i.e. multidimensionality) [Citation12]. To examine local dependency in greater detail, the relative correlations between standardized item residuals were examined. In general, these correlations should not exceed 0.2–0.25 [Citation23,Citation24].
The OBQ has response categories ranging from low agreement to high agreement with the statements in the questionnaire. Whether the OBQ response categories work as assumed was assessed by examining response category thresholds [Citation22]. A threshold is the point where the probability of a response is the same between two adjacent response categories. In the event of disordered thresholds, response categories do not work as intended.
DIF is an additional aspect of fit that concerns whether items work the same way for different subgroups, for example different age groups or men and women. Age was dichotomized into older (50–89 years old) vs. younger (20–49 years old) according to the median. Here we addressed uniform (subgroup main effect) and non-uniformed (subgroup × location interaction effect) DIF by 2-way ANOVAs of residuals [Citation25]. Items exhibiting DIF were adjusted by splitting the item into two subgroup-specific items followed by examination of the impact of DIF on the total score.
Targeting refers to the correspondence between item and person locations, where person locations along the measurement continuum preferably should be mirrored by item locations, and vice versa, in order to maximize precision in estimated person and item measures as well as the conditions for scale evaluation. Detecting differences between people is an important function of measurement, which is linked to measurement precision and, therefore, also to targeting and reliability.
According to RMT, people with low occupational balance are expected to have low probabilities to endorse items expressing high levels of occupational balance. As this is the basis of locating items (and persons) on the latent logit continuum, it provides the foundations for examining the nature of how the construct varies as one moves from lower to higher levels of occupational balance, and the extent to which this is in accord with clinical and theoretical experiences. The logic of the hierarchical ordering of item locations was, therefore, considered as means to assess internal content and construct validity.
Data were analyzed according to the unrestricted polytomous (‘partial credit’) Rasch model using RUMM2030 [Citation26], and the program divided the samples into four class intervals (subgroups of people with similar levels of occupational balance according to total OBQ scores). Bonferroni adjustments for multiple null hypothesis testing were applied, with the alpha level of significance set at 0.05 [Citation27,Citation28].
Results
Sample 1, (who responded to the original 13-item version of the OBQ), consisted of 168 persons aged 21–64. The mean (SD) age was 53 (12) and 68 per cent were women. The reliability of the OBQ was good, and the overall fit to the model was reasonable (). However, the response category thresholds were disordered in four items (items 2, 4, 6 and 7). A similar pattern (albeit marginally ordered) was also observed for a majority of the remaining items. This suggests that respondents had difficulties distinguishing between response categories, threatens both the user-friendliness of the scale and the interpretability of responses, and was likely related to too many response categories. Other reasons may also include multidimensionality [Citation19], which appeared to be the case for three items, or local response dependence [Citation23,Citation29], which was indicated for four items (). Based on these observations, we explored the effects of step-wise collapsing response categories. First, we collapsed the first and second response categories and after that also the third and fourth response categories. Following this, the rating scale worked as intended (data not shown). Thus, the response categories were reduced from six to four (0 = completely disagree, 1 = tend to disagree, 2 = tend to agree, and 3 = completely agree).
Table 2. Overall Rasch model fit statistics and reliability.
Table 3. Rasch item and fit statistics.
New data were then collected with this revised version of the OBQ (Sample 2). Sample 2 consisted of 207 persons aged 20–89. The mean (SD) age was 50 (13) and 64 per cent were women. As suggested by our observations with the experimentally collapsed response categories in sample 1, there were no disordered thresholds in sample 2 (). The revised OBQ with four response categories showed good reliability and improved overall fit (). shows individual item fit statistics for the OBQ with 13 items following reduction to four response categories. Three items showed signs of misfit. In two of these (items 3 and 6) fit residuals outside the range (4.034 and 2.902, respectively) suggest multidimensionality. These items were, therefore, reviewed relative to the definition of occupational balance, i.e. ‘the experience of having the right amount of occupations and the right variation between occupations in the occupational pattern’ [Citation6, p. 326]. In view of this, item 3 (Perceiving one’s occupations as meaningful) and item 6 (Balance between doing things alone and with others) have nothing to do with the amount or variation of occupations but instead they have something to do with personal or environmental aspects that of course influence occupational balance, but the purpose of the OBQ is not to measure these aspects but rather the experience of the amount of and variation between different occupations in the occupational pattern. Therefore, first item 3 was removed but item 6 was still misfitting. When both items were removed all residuals were nonsignificant and within the acceptable range of −2.5 to 2.5 (). Relative correlations between standardized item residuals did not exceed 0.2, which supports the absence of meaningful local dependence and further strengthens validity. We refer to this revised version, with 11 items and four response categories, as the OBQ11.
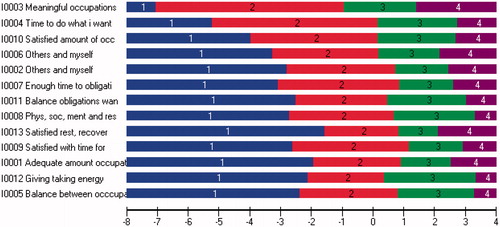
Figure 1. Response category thresholds for each item (in location order from easiest to hardest to achieve) on the Occupational Balance Questionnaire with four response categories and 13 items.
However, item 4 (Time for doing things wanted) exhibited uniform DIF by gender, with women scoring systematically higher than men. Item 7 (Have sufficient time for doing obligatory occupations) exhibited uniform DIF by age, with older people scoring systematically higher than younger people. This indicates that these items do not work the same way in different groups. The observed DIF was adjusted for by splitting item 4 into one female- and one male-specific item, and item 7 into one for older and one for younger people. The intraclass correlations between person locations from the original and DIF-adjusted person estimations were 0.99 (item 4) and 1.0 (item 7). Furthermore, when comparing the differences between mean person locations based on the original and the DIF-adjusted items, effect sizes of 0.03 (item 4) and 0.009 (item 7) suggest that the observed DIF do not appear to cause any obvious bias to the OBQ as a measure of occupational balance. Therefore, both items were retained in their original format.
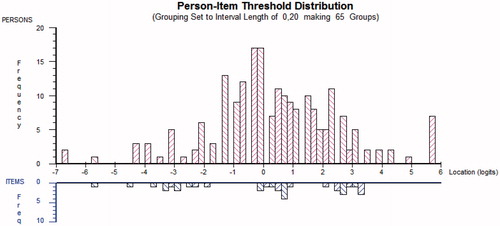
The OBQ11 did not exhibit any floor effects, and a 3% (n = 6) ceiling effect. shows the distribution of persons and item response category thresholds along the common logit metric of the new OBQ11. Good distribution means that the scale represents the levels of occupational balance reported by the sample. A mean person location of < ±0.5 logits has been suggested to indicate good targeting [Citation30]. In the mean (SD) person location is 0.3 (1.83) logits. Furthermore, it is evident that the scale is able to separate persons (, upper panel; PSI, 0.92) and that it maps out a quantitative continuum from more to less (, lower panel). Item locations are covered by the persons, meaning that the basic premises for evaluating the scale are good. However, the range of person locations is not optimally represented by item locations, as illustrated by a relatively large gap between approximately −0.2 and −1.8 logits, a somewhat smaller gap between about 1 and 2 logits, and non-coverage of persons at the extreme levels of occupational balance (, lower panel). This means that the OBQ11 measures with less precision at these intervals.
Figure 2. Distribution of locations of persons (upper panel) and response category thresholds (lower panel) in sample 2 (OBQ11, 11 item and 4 response categories).
As illustrated in , there was support for the logic of the hierarchical item ordering relative to previous research [Citation31,Citation32]. That is, being able to do what one wants is relatively easy to achieve (i.e. does not require very high levels of occupational balance), while experiencing balance between different types of occupations may be more difficult to achieve. For example, item 4 (Time for doing things wanted) represents the lower end of the OBQ11 continuum (−1.022 logits) and item 5 (Balance between work, home, family, leisure, rest, and sleep) represents the highest level of occupational balance (0.378 logits). When taking measurement uncertainties (±2 SEs) into account, one item (number 11) exhibited different locations in the new OBQ11 compared to the original OBQ.
Discussion
The present study investigated the validity of the OBQ using RMT resulting in a new version of the instrument, the OBQ11. As opposed to previous CTT based analyses [Citation7], several important features were revealed. First, the original response scale did not work as intended and reduction from six to four response categories improved the questionnaire without loss of reliability. Second, two items signaled misfit due to multidimensionality, which could be understood theoretically, thus resulting in a conceptually clearer and reliable 11-item questionnaire, with four functioning response categories, acceptable model fit, measurement invariance across age and genders, and probably a logical hierarchical item ordering. The evaluation of the logical hierarchical item ordering is based on two previous studies [Citation31,Citation32] but more research is needed to be sure.
In the analysis of the OBQ, data suggested that item 3 (Perceiving one’s occupations as meaningful) and item 6 (Balance between doing things alone and with others) may represent a construct other than occupational balance. As with all other items, these items were derived from empirical studies. In a qualitative study [Citation8], women with stress-related disorders emphasized the importance of meaningful occupations to experience occupational balance. Furthermore, in a previous literature review [Citation33] one of four identified perspectives of occupational balance was congruence between values and occupations. According to another definition [Citation34, p. 231] occupational balance is ‘the extent to which a pattern of occupation is perceived as harmonious, fulfilling, and compatible with one’s values’. When developing item 3, we, therefore, considered occupations perceived as meaningful to be an indicator of occupational balance. Very likely meaningfulness is affected by the environment and meaning affects occupational balance but is not an indicator of occupational balance. Regarding item 6, women with stress-related disorders have emphasized the importance of balance between doing occupations alone and together with others [Citation8]. However, we have not found any other support for this. Other people are part of the environment and thus not an indicator of occupational balance. As the OBQ11 is a short instrument, focusing on measuring occupational balance from the perspective of people’s experience of their amount and variation of occupations regardless of which these are, it is suitable to combine OBQ11 with measurements of other aspects of occupational balance such as the LBI [Citation2]. Also, combining the OBQ11 with measures of occupational meaning or value, such as the Occupational Value Assessment with predefined items (OVal-pd) [Citation35], and measures of the social environment [Citation36] is likely a feasible approach to capture a wider array of important aspects that affect occupational balance.
The results further show a slight but general tendency for the items to represent less occupational balance than that experienced by the persons, and we found gaps along the occupational balance continuum that are not represented by the OBQ11. This may have practical implications, such as the OBQ11 being less suitable for detecting differences between people with higher occupational balance or to follow changes over time in such samples. However, this is not considered a major problem because precision is of less concern at the highest levels of occupational balance, as those with high occupational balance do not need to improve their occupational balance. Of somewhat more concern are the two gaps in the item coverage, which comprise measurement precision at levels of occupational balance represented by a majority of people. One obvious way to improve precision and targeting would be to increase the number of items and/or response categories to enhance the representation of the latent occupational balance continuum. Given the evidence that a four-category response scale is preferable to six response categories, it seems reasonable to suggest that future efforts should attempt to identify additional items rather than expanding the number of response categories.
A limitation of the present study was that mean age was around 50 and that two thirds were women. This may have affected the results as previous studies have shown that occupational balance differs between men and women [Citation31] between people with and without children [Citation37] and probably between people with disabilities and without them. Therefore, the OBQ11 needs to be tested in additional samples of other ages and a more even gender distribution. Furthermore, it also has to be tested in various patient groups as well as across countries and cultures.
It may also be argued that the sizes of our samples were somewhat limited, particularly regarding sample 1. However, the primary purpose of sample 1 was to get an initial indicator of any major issues related to the OBQ. As such, a sample size of about 150 can be considered as acceptable [Citation38]. As for sample 2, it has been found that samples of about this size represent a fair balance with regard to assessment of fit to the Rasch model using the RUMM2030 software [Citation28].
Practical implications
Since occupational balance is an essential aspect of occupational therapy it is vital to be able to measure it. This study suggests that the OBQ11 may serve to fill this gap by providing a valid and reliable measure of occupational balance. The OBQ11 may have practical relevance as a tool to identify occupational balance in general populations. The OBQ11 can be used as a screening tool to prioritize clients for occupational therapists and for intervention planning in health promoting occupational therapy. In the present study a general population was selected, but the OBQ11 needs to be tested in clinical samples too.
Conclusions
The new version of the Occupational Balance Questionnaire with 11 item and four response categories, the OBQ11, satisfies the measurement criteria defined by RMT and may provide a useful means to assess experienced occupational balance both in groups and individuals. However, further studies are needed to validate the OBQ11 across a wider range of applications.
Acknowledgements
The authors want to thank all participating respondents, and the occupational therapy students for their valuable help with data gathering.
Disclosure statement
The authors report no conflict of interest.
References
- Meyer A. The philosophy of occupation therapy. Am J Occup Ther. 1977;31(10):639–642. (Reprinted from Arch Occup Ther 1922;1:1-10).
- Matuska K. Description and development of the life balance inventory. Occup Ther J Res. 2012;32:220–228.
- Matuska KM, Christiansen CH. A proposed model of lifestyle balance. J Occup Sci. 2008;15(1):9–19.
- Eakman A. The meaningful activity wants and needs assessment: a perspective on life balance. J Occup Sci. 2015;22(2):210–227.
- Dür M, Steiner G, Fialka-Moser V, et al. Development of a new occupational balance-questionnaire: incorporating the perspectives of patients and healthy people in the design of a self-reported occupational balance instrument. Health Qual Life Outcomes. 2014;12(1):45.
- Wagman P, Håkansson C, Björklund A. Occupational balance as used in occupational therapy. A concept analysis. Scand J Occup Ther. 2012;19(4):322–327.
- Wagman P, Håkansson C. Introducing the Occupational Balance Questionnaire (OBQ). Scand J Occup Ther. 2014;21(3):227–231.
- Håkansson C, Dahlin-Ivanoff S, Sonn U. Achieving balance in everyday life. J Occup Sci. 2006;13(1):74–82.
- Wagman P, Björklund A, Håkansson C, et al. Perceptions of life balance among a working population in Sweden. Qual Health Res. 2011;21(3):410–418.
- Wagman P, Håkansson C, Jacobsson C, et al. What is considered important for life balance? Similarities and differences among some working adults. Scand J Occup Ther. 2012;19(4):377–384.
- Hobart JC, Cano SJ, Zajicek JP, et al. Rating scales as outcome measures for clinical trials in neurology: problems, solutions, and recommendations. Lancet Neurol. 2007;6(12):1094–1105.
- Hobart J, Cano S. Improving the evaluation of therapeutic interventions in multiple sclerosis: the role of new psychometric methods. Health Technol Assess. 2009;13(12):1–200.
- Hagell P. Measuring activities of daily living in Parkinson’s disease: on a road to nowhere and back again? Measurement. 2019;132:109–124.
- Rasch G. Probabilistic models for some intelligence and attainment tests. Copenhagen: Danish Institute for Educational Research; 1960.
- Andrich D. Rasch models for measurement. Newbury Park, [Calif.]; London: SAGE, Cop. 1988.
- Mari L, Wilson M. An introduction to the Rasch measurement approach for metrologists. Measurement. 2014;51:315–327.
- Pendrill L. Man as a measurement instrument. NCSLI Meas. 2014;9(4):24–35.
- Wilson M. Constructing measures: An item response modelling approach. Mahwah, NJ: Lawrence Erlbaum Associates Inc; 2005.
- Wolfe EW, Smith EV. Instrument development tools and activities for measure validation using Rasch models: part II – validation activities. J Appl Meas. 2007;8(2):204–234.
- Andrich D. An index of person separation in latent trait theory, the traditional KR-20 index, and the Guttman scale response pattern. Educ Psychol Res. 1982;9:95–104.
- Andrich D, Luo G, Sheridan B. Interpreting RUMM 2030. Perth: WA: RUMM Laboratory, 2013.
- Andrich D. Rating scales and Rasch measurement. Expert Rev Pharmacoecon Outcomes Res. 2011;11(5):571–585.
- Marais I. Local dependence. In KB Christensen, S Kreiner, M Mesbah (Eds.). Rasch models in health. Croydon, Surrey, UK: John Wiley & Sons, 2013. pp. 111–130.
- Christensen KB, Makransky G, Horton M. Critical values for Yen’s Q 3: identification of local dependence in the Rasch Model using residual correlations. Appl Psychol Meas. 2017;41(3):178–194.
- Hagquist C, Andrich D. Recent advances in analysis of differential item functioning in health research using the Rasch model. Health Qual Life Outcomes. 2017;15(1):181.
- Andrich D, Sheridan B, Luo G. RUMM2030: Rasch unidimensional models for measurement. Perth, Australia: RUMM Laboratory; 1997.
- Bland JM, Altman DG. Multiple significance tests: the Bonferroni method. BMJ. . 1995;310(6973):170.
- Hagell P, Westergren A. Sample size and statistical conclusions from tests of fit to the Rasch Model according to the Rasch unidimensional measurement model (RUMM) program in health outcome measurement. J Appl Meas. 2016;17(4):416–431.
- Hagqvist C. Evaluating composite health measures using Rasch modelling: an illustrative example. Soz Praventivmed. 2001;46:369–378.
- Hudgens S, Dieneen K, Webster K, et al. Assessing statistically and clinically meaningful construct deficiency/saturation: recommended criteria for content coverage and item writing. Rasch Meas Trans. 2004;17:954–955.
- Håkansson C, Ahlborg G. Perceptions of employment, domestic work, and leisure as predictors of health among women and men. J Occup Sci. 2010;17(3):150–157.
- Håkansson C, Björkelund C, Eklund M. Associations between women’s subjective perceptions of daily occupations and life satisfaction, and the role of control. Aust Occup Ther J. 2011;58(6):397–404.
- Wada M, Backman CL, Forwell SJ. Theoretical perspectives of balance and the influence of gender ideologies. J Occup Sci. 2010;17(2):92–103.
- Backman C. Occupational balance and well-being. In CH Christiansen, EA Townsend. Introduction to occupation. The arts and science of living. Upper Saddle River, NJ; Pearson Education Inc. 2010.
- Eklund M, Erlandsson L-K, Persson D, et al. Rasch analysis of an instrument for measuring occupational value: Implications for theory and practice. Scand J Occup Ther. 2009;16(2):118–128.
- Kjellberg A, Haglund L. Utilization of the Swedish version of the assessment of communication and interaction skills. Br J Occup Ther. 2016;79(4):228–234.
- Wagman P, Håkansson C. Exploring occupational balance in adults in Sweden. Scand J Occup Ther. 2014;21(6):415–420.
- Regnault A. A mixed methods framework for the development of patient-centered outcome measures. Paper presented at the 7th International Conference on Probabilistic Models for Measurements. Perth, Australia 17-19 January, 2017.