
 ?Mathematical formulae have been encoded as MathML and are displayed in this HTML version using MathJax in order to improve their display. Uncheck the box to turn MathJax off. This feature requires Javascript. Click on a formula to zoom.
ABSTRACT
Background: Peripheral perfusion index (PPI) reflects changes in the vasomotor tone. The aim of this observational study is to explore the potentials of the PPI as a predictor of the response to nitroglycerin-induced hypotensive anesthesia in patients undergoing functional endoscopic sinus surgery (FESS).
Methods: Forty-seven patients undergoing FESS were included. Deliberate hypotension was achieved using nitroglycerin infusion titrated to a mean arterial blood pressure (MAP) of 60–65 mmHg. PPI was recorded before induction of anesthesia (baseline), at: 1 minute after induction, 1 minute after endotracheal intubation and just before the initiation of nitroglycerin infusion. The correlation between PPI measured at different time points and the time and the dose requirements of nitroglycerin to achieve the target MAP were evaluated.
Results: There was a significant positive correlation between the baseline PPI and the time to reach target MAP (r = 0.68, p < 0.0001), the infusion rate of nitroglycerin (r = 0.67, p < 0.0001) and the total intraoperative nitroglycerin consumption (r = 0.65, p < 0.0001). The baseline PPI was the only predictor of nitroglycerin requirement with a cut-off value of 2.8 and an area under the curve 0.85 (95%CI 0.71–0.94, P < 0.0001). The expected individualized dose requirements of nitroglycerin could be derived from the regression equation based on the baseline PPI value.
Conclusion: Baseline PPI is a good predictor for the patients’ response to nitroglycerin-induced hypotensive anesthesia. Lower baseline PPI values are associated with a reduction in the time and the dose of nitroglycerin required to achieve and maintain the target MAP.
Clinical trials.gov Identifier No: NCT03007355 Registered on 2 January 2017.
1. Introduction
Deliberate hypotensive anesthesia (DH) is frequently required to reduce bleeding and improve the surgical field in functional endoscopic sinus surgery (FESS) [Citation1]. Nitroglycerin is a direct vasodilator that is commonly used for deliberate hypotension [Citation2]. It has a wide dose range from 0.5 to 10 µg/kg/min [Citation3]. In clinical practice, nitroglycerin dose is gradually titrated to achieve the target mean arterial pressure (MAP) [Citation4]. However, no previous studies have tried to predict nitroglycerin dose requirements in different patients during deliberate hypotensive anesthesia.
Peripheral Perfusion Index (PPI) is a numerical value derived from the pulse oximeter plethysmographic wave [Citation5]. It is calculated by expressing the pulsatile signal during arterial inflow as a percentage of the non-pulsatile signal, both of which are derived from the absorbed amount of infrared light (940 nm) [Citation6]. PPI can reflect the peripheral perfusion dynamics due to changes in the peripheral vasomotor tone [Citation7]. Peripheral vasoconstriction [Citation7] and hypovolemia [Citation8] are associated with low PPI. In contrast, high PPI indicates vasodilation [Citation7]. The normal value of PPI has a skewed distribution with a wide range of 0.3–10, median 1.4 [Citation7]. A baseline cutoff value of PPI of >3.5 was found to predict higher incidence of hypotension in parturients undergoing cesarean section under spinal anesthesia [Citation9].
Despite a large number of clinical studies assessing the use of PPI in different anesthetic situations, no previous study assessed its value as a monitor during deliberate hypotensive anesthesia. This observational study was designed to explore the potentials of PPI as a predictor of the response of adult patients to nitroglycerin-induced hypotensive anesthesia during FESS. The primary outcome was the correlation between the time to achieve target MAP and the baseline PPI. Secondary outcomes included: the correlation between intraoperative nitroglycerin consumption and the PPI at: baseline, one minute after induction of anesthesia, one minute after endotracheal intubation and just before initiation of nitroglycerin infusion
2. Martials and methods
This study was approved by the Kasr-Alainy Faculty of Medicine Ethics Committee, Cairo University (email: [email protected]) with (ID: N-6-2017) and written informed consent was obtained from all subjects participating in the trial. The trial was registered prior to patient enrollment at Clinical trials.gov ((ID: NCT03007355, Principal investigator: Abeer Ahmed, Date of registration: 2 January 2017
The study was conducted at the Ear Nose and Throat Surgery Unit, Cairo University Hospitals during the period from January to December 2017. Patients aged 18–50 years, ASA physical status I or II, undergoing FESS under deliberate hypotensive anesthesia were included. Patients with cardiovascular disease, cerebrovascular insufficiency, coagulation abnormities, renal or hepatic insufficiency, and hypersensitivity to the study medications were excluded. Patients receiving vasoactive drugs or beta blockers were also excluded.
The day before surgery, all patients were instructed to fast for 6–8 hours. On arrival to the operating room, a peripheral intravenous line was secured and a fixed volume of lactated Ringer’s solution was infused at a rate of 4 ml/kg/hr. Patients were premedicated with intravenous midazolam of 0.02–0.03mg/kg. All patients were monitored with, electrocardiography, pulse oximeter (SpO2), and the Masimo pulse oximeter probe (Masimo Radical 7; Masimo Corp., Irvine, CA, USA) for measuring PPI before induction of general anesthesia. Normothermia was maintained using warm intravenous fluids and a forced air warm blanket (Model 750-Bair Hugger Temperature Management Unit, SMA MISR, Arizant Healthcare Inc, Minnesota, USA).
The radial artery was cannulated for direct arterial blood pressure measurements using local infiltration anesthesia. Monitoring of the end-tidal CO2, neuromuscular block and depth of anesthesia using Bispectral index (BIS) monitor (Aspect Medical Systems, Newton, Massachusetts, USA) was initiated after induction of anesthesia. The Masimo oximeter probe was applied to the index finger of the contralateral hand to intravenous fluid infusion and direct blood pressure measurement. The baseline value of PPI (T0) was the average of three readings measured after midazolam premedication and before induction of general anesthesia.
General anesthesia was induced with fentanyl 2µg/kg, propofol 2mg/kg and atracurium besylate 0.5 mg/kg was used to facilitate endotracheal intubation. The lungs were ventilated to maintain normocapnia (end-tidal CO2 35–38 mm Hg). Isoflurane 1–1.5% end-tidal concentration was used to maintain a BIS value of 40–60. top-up doses of atracurium besylate 0.1mg/kg were given based on the response to train-of-four ulnar nerve stimulation. An additional dose of fentanyl 1µg/kg was given before surgical manipulation. Patients were positioned supine with 15-degree reverse Trendelenburg’s position.
The attending anesthesiologist was blinded to the value of PPI. The Masimo pulse oximeter was connected to the patients while the screen was kept hidden beside the patient and away from the main monitoring screen and from the attending anesthesiologists. An assistant anesthesia resident was requested to fill a data sheet of the PPI values only at the required time intervals while the responsible investigator was responsible of collecting the rest of the data. Deliberate hypotension was achieved using titrated nitroglycerin infusion starting at 0.5 µg/kg/min and increased gradually (0.5 µg/kg/min) every 3 minutes till a target mean arterial blood pressure (MAP) of 60–65 mmHg is reached. Nitroglycerin infusion was stopped 15 minutes before termination of surgery to resume the baseline blood pressure values. At the conclusion of surgery, isoflurane was discontinued and residual atracurium block was antagonized with neostigmine 0.05 mg/kg and atropine 0.02 mg/kg. After extubation, patients were transferred to the post anesthesia care unit (PACU).
During the intraoperative period, heart rate, systolic, diastolic, mean arterial blood pressure, SpO2, were continuously measured. PPI was recorded at: 1 minute after induction of anesthesia (T1), 1 minute after endotracheal intubation (T2), just before the initiation of nitroglycerin infusion (T3), and every 10 minutes till recovery from anesthesia. PPI recording continued every 10 minutes during the PACU stay. The time to achieve the target MAP and the infusion rate of nitroglycerin at which the target MAP was achieved were recorded. The total intraoperative nitroglycerin consumption was recorded.
Our primary outcome was the correlation between the time to achieve target MAP and the baseline PPI. Secondary outcomes included: the correlation between intraoperative nitroglycerin consumption and the PPI at: baseline, one minute after induction of anesthesia, one minute after endotracheal intubation and just before initiation of nitroglycerin infusion.
3. Statistical analysis
The Power Analysis and Sample Size software (PASS 13 software; NCSS, LLC, Kaysville, UT, USA) was used for sample size calculation before patient enrollment. No previous clinical trials have studied the correlation between PPI and the patient response to deliberate hypotensive anesthesia. The sample size was based on assuming a moderate correlation (r = 0.4) between the baseline PPI and the time to achieve target MAP [Citation10]. With a power of 0.8 and two-tailed α of 0.05, a sample size of 46 patients was required. The number was increased to 50 patients to compensate for possible dropouts.
Continuous quantitative normally distributed data are expressed as means and standard deviations (SD). Continuous skewed data are expressed as median (range). Categorical data are expressed as percentage. The correlation between PPI, the time to achieve the target MAP, and nitroglycerin consumption were evaluated using the Spearman’s correlation coefficient. Multiple linear regression analysis was performed to assess the relationships between baseline PPI, patient characteristics (age and gender) and mean nitroglycerin infusion rate. The receiver operating characteristic (ROC) curves were constructed and the area under the curve (AUC) was calculated to compare the performance of PPI in predicting nitroglycerin infusion rate. The best cut-off value of the PPI in predicting the mean nitroglycerin infusion rate was calculated using the Youden index (MedCalc version 12.1.4.0, Mariakerke, Belgium). Based on the best cut off value of PPI in predicting the response to nitroglycerin infusion, data were dichotomized and analysed using unpaired student t-test. Mixed design ANOVA using (within-between subjects) factors with post-hoc Tuckey test was used to analyze intraoperative and postoperative PPI changes. The Statistical Package of Social Science software program (SPSS), version 21 (Chicago, IL, USA) was used for all statistical comparisons.
4. Results
A total of 50 patients were enrolled and 47 completed the study. One patient was excluded due to the development of bronchospasm after endotracheal intubation that necessitated termination of the procedure. Two patients were excluded due to change of the planned surgical procedure. The patients and surgery characteristics are shown in ().
Table 1. Patients and surgery characteristics. Values are means (SD), median (range) or number.
There was a significant positive correlation between the baseline PPI and the time to achieve the target MAP with an r-value of 0.68 and a p-value < 0.0001.The mean infusion rate of nitroglycerin and the mean total intraoperative nitroglycerin consumption required to maintain the target MAP correlated with the baseline PPI (r = 0.67 and p < 0.0001) and (r = 0.65 and p < 0.0001), respectively.
The median total intraoperative consumption of nitroglycerin was 5.1 mg. This threshold was chosen to discriminate between the high and low total nitroglycerin consumption and to construct the ROC curves. The cut-off value, sensitivity, specificity, area under the curve (AUC), positive and negative predictive values of the PPI at different time intervals to predict the total nitroglycerin requirements are shown in ( and ).
Table 2. Comparison of the area under the curve (AUC) of peripheral perfusion index (PPI) at different time interval to predict the nitroglycerin dose requirement to reach the target mean arterial blood pressure.
Figure 1. Receiver operating characteristic curve comparing the predictive ability of peripheral perfusion index (PPI) at different time interval to the patients’ response to nitroglycerin-induced hypotension. PPI (T0) = baseline PPI, PPI (T1) = PPI at one minute after induction, PPI (T2) = PPI at one minute after intubation, PPI (T3) = PPI just before initiation of nitroglycerin infusion.
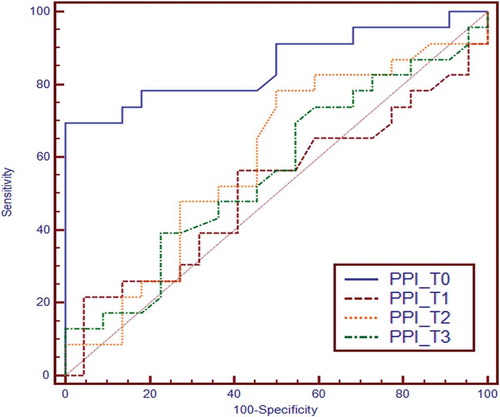
The baseline PPI was the only predictor of nitroglycerin requirement with a cut-off value of 2.8 according to the maximum Youden index. This cut-off value had a sensitivity of 69.5% and a specificity of 100%. The AUC was 0.85 (95% confidence interval (CI) 0.71–0.94, P < 0.0001). The positive predictive value was 100 and the negative predictive value was 75. Patients were then divided according to the baseline PPI cut-off value into two subgroups, patients with low baseline PPI, ≤ 2.8 (n = 27) and patients with high baseline PPI, > 2.8 (n = 20). The time to reach the target MAP, the mean nitroglycerin infusion rate required to maintain the target MAP and the total nitroglycerin consumption were lower in patients with low baseline PPI ().
Table 3. Comparison between patient with low and high baseline peripheral perfusion index (PPI). Values are means (SD).
Multiple linear regression analysis model including age, gender and baseline PPI confirmed that the only predictor of the patient’s response to nitroglycerin-induced hypotension was the baseline PPI. The expected mean nitroglycerin infusion rate can be derived by the following equation;
(0.2907 is a constant, 0.58 is the correlation coefficient, and PPI is the baseline PPI)
The intraoperative and postoperative PPI trend was analyzed in patients with low PPI (≤ 2.8) and patients with high PPI (> 2.8). The PPI value increased after induction of anesthesia and gradually decreased thereafter and was maintained higher than the baseline values all through the intraoperative period (). In the PACU, the PPI gradually decreased to approach the baseline value.
Figure 2. Intraoperative changes of perfusion index. T0; baseline, T1: after induction, T2: before endotracheal intubation, T3: before nitroglycerin infusion, Intraoperative PPI values (10–60 min): Values are means and error bars represent the standard deviation. * Denotes significant difference between the two subgroups. † Denotes significance relative to the baseline value.
5. Discussion
The results of the present study indicated that the baseline PPI is a good predictor to the patients’ response to nitroglycerin-induced hypotensive anesthesia. Lower baseline PPI values were associated with a reduction in the time and the dose of nitroglycerin required to achieve and maintain the target MAP. The expected individualized dose requirements of nitroglycerin could be derived from the regression equation based on the baseline PPI value.
Physiologically, the sympathetic activation and deactivation are responsible for the baseline vascular tone [Citation11]. Nitric oxide plays an important role in the maintenance of the basal vascular tone [Citation12]. Nitroglycerin produces its potent vasodilator action by releasing NO [Citation13]. Fok and colleagues investigated the effect of nitroglycerin on the basal vascular tone of the radial artery in normotensive volunteers. The vasodilator effect of nitroglycerin was directly proportional to the basal vascular tone [Citation14].
PPI is an expression of the ratio between the pulsatile signal and the non-pulsatile signal and is influenced by variations in the basal vascular tone of the arterial and venous walls [Citation15]. This could explain our main findings that patients with lower baseline PPI (high basal vascular tone) were more responsive to the vasodilator effect of nitroglycerin with a shorter time and a lower dose requirements to achieve the target MAP compared to those who had a higher PPI (low basal vascular tone).
There is an evidence that lower PPI in critically-ill patients may reflect a high baseline sympathetic tone. Rasmy and colleagues [Citation16] evaluated the ability of PPI to predict vasopressor requirements during early resuscitation in 36 patients with severe sepsis. They found that a low baseline PPI <0.3 had a sensitivity of 100% and a specificity of 93% for predicting vasopressor requirement.
We have evaluated the potentials of PPI for prediction of the patients’ response to nitroglycerin infusion at different intraoperative time intervals. The sensitivity and specificity of PPI at all time intervals was lower when compared to the baseline PPI. This may be due to the presence of other contributing factors in anesthetized patients that might influence the basal vascular tone and systemic vascular resistance e.g. the use of propofol for induction [Citation17], the pressor response to endotracheal intubation [Citation18], and the use of isoflurane for maintenance of anesthesia [Citation19]. These contributing factors could probably explain why PPI did not further increase after infusion of nitroglycerin.
In line with our findings, Mehandale and Rajasekhar [Citation20] tested the ability of baseline PPI to predict hypotension following propofol induction of general anesthesia in 50 adult healthy patients. The study revealed a significant correlation between the baseline PPI and propofol-induced hypotension. The authors reported that the lower PPI values (<1.05) were associated with greater hypotension at 5 minutes after induction of anesthesia. This was attributed to the vasodilator effect of the propofol [Citation17]. In another study, Tsuchiya and colleagues [Citation21] confirmed the ability of baseline plethysmographic variability index “a software program that measures the dynamic changes of the PPI that occurs during complete respiratory cycle” to predict hypotension during induction of general anesthesia with bolus administration of propofol. The administration of propofol unmasked the increased vascular resistance with a consequent greater decrease in MAP [Citation17].
Linear regression analysis confirmed that baseline PPI contributed to the patient’s response to nitroglycerin-induced hypotensive anesthesia. In line with our findings, Toyama and colleagues [Citation9] using multiple linear regression analysis confirmed that the baseline PPI significantly contributed to the incidence of hypotension with the use of spinal anesthesia.
In our study, a target of MAP 60–65 mmHg was maintained all through the surgical procedure, depending on a previous study conducted by Yoshikawa et al. [Citation22] who denoted that hypotensive anesthesia induced by using sodium nitroprusside or nitroglycerin during mandibular osteotomy with MAP of 60–70 mmHg is safe and associated with no significant increase in pyruvate, lactate or glucose levels
This study has some limitations: first; we have only evaluated the use of PPI for the prediction of the patients’ response to nitroglycerin-induced hypotensive anesthesia. Our findings cannot be extrapolated to other commonly utilized hypotensive agents e.g. nitroprusside or esmolol. Second; we did not assess other factors that may influence PPI e.g. volume status. However, we have standardized preoperative fasting duration and intraoperative fluid management.
6. Conclusion
The baseline PPI is a good predictor for the patients’ response to nitroglycerin-induced hypotensive anesthesia. Lower baseline PPI values are associated with a reduction in the time and the nitroglycerin dose required to reach the target MAP. The expected individualized dose requirements of nitroglycerin could be derived from the regression equation based on the baseline PPI value.
List of abbreviations
| PPI | = | Peripheral perfusion index |
| FESS | = | Functional endoscopic sinus surgery |
| MAP | = | Mean arterial pressure |
| SpO2 | = | Oxygen saturation |
| BIS | = | Bispectral index |
| PACU | = | Post anesthesia care unit |
Authors contributions
Mohamed Abdulatif: Conceptualization of the study question, design of the study, writing of the manuscript and final approval of the version to be published.
Abeer Ahmed: Clinical work, writing the manuscript and final approval of the version to be published.
Sherif Abdullah: Clinical work, writing the manuscript and final approval of the version to be published.
Neamat Abdel Rahman: Clinical work, writing the manuscript and final approval of the version to be published.
Ahmed Mukhtar: Study design, statistical analysis, writing of the manuscript and final approval of the version to be published.
Disclosure statement
No potential conflict of interest was reported by the authors.
Additional information
Funding
References
- Zhao YC, Psaltis AJ. Hemostasis in sinus surgery. Curr Opin Otolaryngol Head Neck Surg. 2016;24:26–30.
- Testa LD, Tobias JD. Pharmacologic drugs for controlled hypotension. J Clin Anesth. 1995;7:326–337.
- Degoute CS. Controlled hypotension: a guide to drug choice. Drugs. 2007;67:1053–1076.
- Bajwa SJ, Kaur J, Kulshrestha A, et al. Nitroglycerin, esmolol and dexmedetomidine for induced hypotension during functional endoscopic sinus surgery: A comparative evaluation. J Anaesthesiol Clin Pharmacol. 2016;32:192–197.
- Goldman JM, Petterson MT, Kopotic RJ, et al. Masimo signal extraction pulse oximetry. J Clin Monit Comput. 2000;16:475–483.
- Lima AP, Beelen P, Bakker J. Use of a peripheral perfusion index derived from the pulse oximetry signal as a non-invasive indicator of perfusion. Crit Care Med. 2002;30:1210–1213.
- Cannesson M, Talke P. Recent advances in pulse oximetry. F1000 Med Rep. 2009;1:66.
- Van Genderen ME, Bartels SA, Lima A, et al. Peripheral perfusion index as an early predictor for central hypovolemia in awake healthy volunteers. Anesth Analg. 2013;116:351–356.
- Toyama S, Kakumoto M, Morioka M, et al. Perfusion index derived from a pulse oximeter can predict the incidence of hypotension during spinal anaesthesia for Caesarean delivery. Br J Anaesth. 2013;111:235–241.
- Schober P, Boer C, Schwarte LA. Correlation coefficient: appropriate use and interpretation. Anesth Analg. 2018;126:1763–1768.
- Pugsley MK, Tabrizchi R. The vascular system: an overview of structure and function. J Pharmacol Toxicol Methods. 2000;44:333–340.
- Divakaran S, Loscalzo J. The role of nitroglycerin and other nitrogen oxides in cardiovascular therapeutics. J Am Coll Cardiol. 2017;70:2393–2410.
- Büssemaker E, Pistrosch F, Förster S, et al. Rho kinase contributes to basal vascular tone in humans: role of endothelium-derived nitric oxide. Am J Physiol Heart Circ Physiol. 2007;293:H541–47.
- Fok H, Jiang B, Clapp B, et al. Regulation of vascular tone and pulse wave velocity in human muscular conduit arteries: selective effects of nitric oxide donors to dilate muscular arteries relative to resistance vessels. Hypertension. 2012;60:1220–1225.
- Hales JR, Stephens FR, Fawcett AA, et al. Observations on a new non-invasive monitor of skin blood flow. Clin Exp Pharmacol Physiol. 1989;16:403–415.
- Rasmy I, Mohamed H, Nabil N, et al. Evaluation of perfusion index as a predictor of vasopressor requirement in patients with severe sepsis. Shock. 2015;44:554–559.
- De Wit F, van Vliet AL, de Wilde RB, et al. The effect of propofol on haemodynamics: cardiac output, venous return, mean systemic filling pressure, and vascular resistances. Br J Anaesth. 2016;116:784–789.
- Atef HM, Fattah SA, Gaffer ME, et al. Perfusion index versus non-invasive hemodynamic parameters during insertion of i-gel, classic laryngeal mask airway and endotracheal tube. Indian J Anaesth. 2015;57:156–162.
- Torri G. Inhalation anesthetics: a review. Minerva Anestesiol. 2010;76:215–228.
- Mehandale SG, Rajasekhar P. Perfusion index as a predictor of hypotension following propofol induction: a prospective observational study. Indian J Anaesth. 2017;61:990–995.
- Tsuchiya M, Yamada T, Asada A. Pleth variability index predicts hypotension during anaesthesia induction. Acta Anaesthesiol Scand. 2010;54:596–602.
- Yoshikawa F, Kohase H, Umino M, et al. Blood loss and endocrine responses in hypotensive anaesthesia with sodium nitroprusside and nitroglycerin for mandibular osteotomy. Int J Oral Maxillofac Surg. 2009;38:1159–1164.