
ABSTRACT
Background: Sepsis is one of the most serious conditions where early diagnosis is important to decrease mortality. We assessed the use of corrected QT (QTc) interval, and procalcitonin level (PCT) as markers in septicemia to predict the patients’ short-term outcome and to get the cut off value of higher diagnostic characteristics.
Material and methods: 120 ICU patients with an established diagnosis of septicemia were included. Sequential Organ Failure Assessment (SOFA) score and Acute Physiology and Chronic Health Evaluation (APACHE II) score were evaluated for all patients. Patients’ co-morbidities, risk factors, laboratory, and hemodynamic records were recorded. QTc was recorded. Also, the PCT level was measured once within the first 24 hours after the diagnosis of sepsis before antibiotic therapy. The patients under study were followed up for the short-term outcome for 14 days to be either survivors or non-survivors.
Results: The mean age of our patients was 56.5 ± 6.2 years. The incidence of mortality was 36.7%. SOFA score, APACHE score, PCT level, and prolonged QTc were the parameters that showed a significant difference between the survivor and non-survivor groups. The prolonged QTc showed 70.5% sensitivity and 81.6% specificity to predict mortality. The best cut value of QTc to predict mortality was ≥ 469 ms while for PCT level was 8.4 ng/dl with 75%, 97.7% sensitivity and 81.6%, 57.9% specificity respectively.
Conclusion: Prolonged QTc and procalcitonin are easy and available parameters that can be used as markers to predict the ICU patients’ mortality with reasonable accuracy.
1. Introduction
Sepsis is one of the most serious intensive care unit (ICU) conditions with high mortality rates. Sepsis is recently defined as life-threatening organ dysfunction caused by a dyregulated host response to infection [Citation1].
Severe sepsis causes insufficient organ blood flow with subsequent system failure in response to infection, which is manifested with hypotension, increased serum lactate, and/or low urine output. Septic shock is a state of acute circulatory failure and abnormalities in cellular metabolism which may lead to death [Citation2].
Early diagnosis and adequate management of septicemia are crucial for a better prognosis. Multiple biomarkers can be used on admission or during follow up of patients to assess the patients’ progress and predict their risk outcome with no specific superiority over each other [Citation3,Citation4]. Simple, available and rapid tools are needed to determine septicemic patients with high-risk mortality [Citation5].
Multiple scoring systems are well established to be used in the assessment of ICU patients predicting their outcome more commonly used are the Acute Physiological and Chronic Health Evaluation (APACHE II) scoring as well as Simplified Acute Physiology Score and Sequential Organ Failure Assessment (SOFA) score [Citation6–Citation8].
The QT and corrected QT intervals (QTc) measured by electrocardiograph (ECG) are correlated to the left ventricular function. The prolonged interval is associated with poor ICU outcomes [Citation9]. It can be used as a mortality predictor in patients with moderate to severe left ventricular (LV) dysfunction and patients with acute pulmonary embolism (PE) [Citation10]. The QTc interval is influenced by multiple metabolic factors during the sepsis course leading to shortening or prolongation of the QTc segment. So, it can be used as a predictor for patients’ short-term outcomes [Citation10,Citation11].
Procalcitonin (PCT) is one of the most commonly used biomarkers in cases with septicemia. Normally, the serum level of PCT is almost nil yet in septicemia, it increases very rapidly within 3 hours after bacterial infection reaching to the peak within 20 hours. Several studies revealed that the higher the level of PCT the more association with severe sepsis [Citation12]. PCT level is found to be strongly correlated with the patients’ outcome and mortality risk [Citation13].
In this study, we aimed to check if the combined use of QTc interval and PCT level is more accurate to predict sepsis related mortality in ICU patients than either of QTc or PCT alone
2. Material and methods
After approval of the ethical committee in charge, 120 adult ICU patients with a diagnosis of septicemia were consented to participate in this prospective, blinded, observational work at Ain Shams university hospital. The study was done along the period from October 2018 to September 2019.
The patients who were included in the study were all above 18 years old with ICU admission and evidence of sepsis diagnosed according to the American College of Chest Physicians/Society of Critical Care Medicine criteria [Citation14]. We excluded children below the age of 18, patients with a previous episode of cardiopulmonary resuscitation, arrhythmogenic drug therapy such as aminophylline, dopamine >5 mg/kg per min, or adrenaline, and drugs that may prolong QT interval e.g.: clarithromycin, Sotalol, Amiodarone.
All patients were subjected to full history taking including personal data, special habits as smoking, co-morbidities as diabetes, hypertension, renal impairment or cardiac disease. Also, the cause of admission, infection date, site and the incidence of acute kidney injury were recorded. The recorded hemodynamic parameters included arterial blood pressure, heart rate, respiratory rate, temperature, urine output, oxygen saturation, ETCO2, and CVP measurement. Glasgow coma scale was also assessed and recorded.
SOFA score was evaluated with characteristic features included respiratory, cardiac, coagulation, hepato-renal and neurological variables [Citation15]. Also, we calculated the APACHE II score utilizing 12 different variables [Citation6]. This is followed by the calculation of SOFA score mortality risk and APACHE II score mortality risk.
2.1. QTc assessment
The selected patients were monitored with a 12 leads Electrocardiography daily with a special interest for QTc interval at a speed of 50 mm/sec till either discharge or mortality within a short-term period (2 weeks). QT interval was measured from the onset of Q-wave to the end of the T-wave. Our decision was to use automated measurement as the basis of 2007 AHA/ACC/HRS recommendations. QTc calculation was performed using Bazzet’s formula (Bazett’s formula: QTC = QT/√ RR) when the heart rate was below 100/min and the Framingham formula for values above 100/min [Citation16]. Prolonged QTc was defined as a QTc of ≥ 450 ms in men and ≥460 ms in women based on recommendations from the American Heart Association and the American College of Cardiology Foundation [Citation17]. Markedly prolonged QTc interval in either sex was considered a QTc interval of above 500 ms as this had been associated with a significantly higher risk of torsade de points [Citation18].
A full laboratory profile was routinely taken. PCT level was measured once within the first 24 hours after sepsis diagnosis. No more PCT measurement was required because its level is supposed to show a decline in response to antibiotic therapy initiation and this was not our aim.
The patients were followed up for the short-term outcome with the mortality rate, ICU stays, and discharge recorded for all patients within 2 weeks follow up.
2.1.1. Sample size justification
Depending on the previous study George et al., 2015 [Citation19] who found that frequency of adverse outcome was (58/174, 33.3%), while the frequency of prolonged QTc among cases with favorable prognosis (25/116, 46.6%) and cases with adverse prognosis (27/58, 21.6%). Moreover, depending on Ashour et al., 2017 [Citation20] who found that frequency of mortality (18/42, 42.9%), while procalcitonin among non-survivors and survivors 8.20 ± 2.17 and 4.54 ± 1.91 respectively. Assuming the power = 0.80 and α = 0.05, and by using PASS 11th release the minimal sample size for s single group cohort is 120 cases [Citation21].
2.1.2. The statistical analysis
The collected data were coded, tabulated, and statistically analyzed using IBM SPSS statistics (Statistical Package for Social Sciences) software version 18.0, IBM Corp., Chicago, USA, 2009.
Descriptive statistics were done for quantitative data as mean ± SD (standard deviation) for quantitative data, while it was done for qualitative data as number and percentage.
Inferential analyses were done for quantitative variables using the Shapiro-Wilk test for normality testing, independent t-test in cases of two independent groups. In qualitative data, inferential analyses for independent variables were done using Chi-square test for differences between proportions and Fisher’s Exact test for variables with small expected numbers. While correlations were done using Pearson correlation. ROC curve was used to evaluate the performance of different tests differentiate death. The level of significance was taken at P value < 0.050 is significant, otherwise, it is non-significant.
3. Results
This study was conducted on 120 patients fulfilling the inclusion criteria and was admitted to the ICU in Ain Shams University hospitals with a diagnosis of sepsis.
On short-term follow up within 2 weeks, 44 patients (36.7%) died representing the non-survivor group while the rest (76 patients, 63.3%) either discharged or completed their stay in the ICU representing the survivor group ().
Figure 1. CONSORT flow diagram
The patients’ characteristics including age, sex, risk factors, co-morbidities, and laboratory results showed that these parameters were almost similar in both the survivor and non-survivor groups (p > 0.05). Although hypertension and DM were the highest risk factors between our study group, yet they showed no statistically significant difference between the survivors and non-survivors. The same was noticed regarding the co-morbidities with ischemic heart diseases (ISHD) and COPD/chest diseases were the highest incidence between our study population (38.4% and 25% respectively) yet with no significant difference between the survivor and non-survivor groups.
SOFA score mortality risk, APACHE II score mortality risk, PCT and QTc were significantly higher among died cases showing a significant difference between the two groups with P-value < 0.001. The prolonged QTc was recorded among 45 patients, 31 non-survivors and 14 survivors with a sensitivity of 70.5% and specificity of 81.6% to predict mortality () (). The mean QTc between the survivors was 433.9 ms while it was 493.1 ms between the non-survivors. The mean PCT level between the survivors was 8.6 ng/dl while between the non-survivors was 13.4 ng/dl.
Figure 2. Comparison between the procalcitonin level (left) and the QTc (right) between the survivors and the non-survivor group
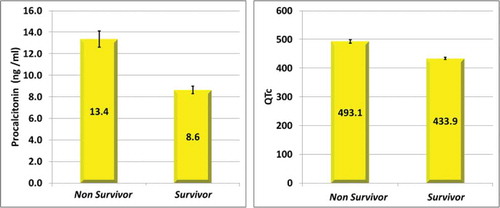
Table 1. Comparison according to ICU mortality
We found a significant negative correlation between mortality day, PCT, SOFA mortality, APACHE II mortality and QTc ().
Table 2. Correlations of mortality day among died cases
PCT and QTc had significant moderate diagnostic performance in predicting death, while the SOFA score mortality risk and APACHE II score mortality risk had significant low diagnostic performance in predicting death () (). The best cut off value for the QTc was found to be ≥ 469 ms and the best cut off value for the PCT was found to be ≥ 8.4 ng/dl ().
Figure 3. ROC curve for different variables at day-1 in predicting death
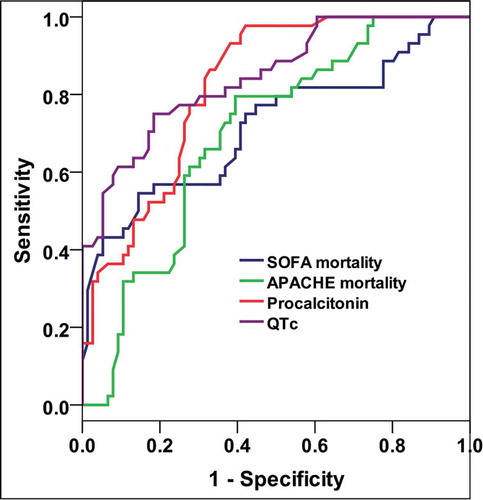
Table 3. Diagnostic performance of different variables at day-1 in predicting death
PCT level ≥ 8.4 (ng/mL) and QTc ≥469 ms had the highest diagnostic characteristics in predicting death. Procalcitonin ≥ 8.4 (ng/mL) had higher sensitivity, but lower specificity than QTc ≥469 ms ().
Table 4. Diagnostic characteristics of suggested cutoff points in predicting death
Finally, when we combined the cut off value of both prolonged QTc and PCT level we found that 38 patients showed prolonged QTc ≥ 469 ms and high PCT ≥ 8.4 ng/dl. 33 of them were found between the non-survivor group and 5 of them were found between the survivor group. So, the combined use of both cut off value led to a sensitivity = 75% and specificity = 93.4%. The positive and negative predictive values were 86.8% and 86.6% respectively.
4. Discussion
In the present study, we aimed to assess the validity of the use of prolonged QTc interval as well as the PCT level as markers for short-term mortality prediction in ICU patients diagnosed with septicemia. Prolonged QTc interval (QTc interval ≥ 469 ms) showed high diagnostic characteristics with the patients’ short-term mortality. PCT level also showed higher sensitivity, yet lower specificity compared to prolonged QTc. Prolonged QTc interval and high PCT can be used as ECG and laboratory markers for poor prognosis and mortality prediction in ICU patients with septicemia.
In our study, SOFA and APACHE II scoring and the calculated mortality risk at admission showed a significant correlation with the patient’s mortality which of course consistent with the fact of being the commonest scoring systems used to assess the patient outcome in ICU [Citation6,Citation7,Citation15,Citation22]. This is also in agreement with Raith et al. who found that the prognostic accuracy of the SOFA score was better than q SOFA in-hospital mortality among adults admitted to the ICU with suspected infection [Citation23].
Although being the most common scoring systems used in mortality prediction yet our study revealed that PCT and prolonged QTc showed higher diagnostic characteristics and performance to predict mortality.
The QT interval is known to be affected by multiple metabolic factors and its prolongation is usually associated with systolic, diastolic or even left ventricular failure [Citation24,Citation25]. In septicemia, prolonged QT interval and subsequent myocardial dysfunction occur due to myocardial infiltration with immune cells, subendocardial hemorrhage, myocardial edema, cellular necrosis, fibrin deposition, and interstitial fibrosis [Citation26].
We found a statistically significant difference between the prolonged QTc interval and the incidence of mortality with a sensitivity reaching 70%. The best cut off value for the QTc with the best diagnostic characteristics was ≥ 469 ms. These results are almost similar to the results of Wasserstrum Y and his colleagues who studied 257 patients with septicemia and found that fourteen-day mortality rates were higher between patients with longer QTc interval [Citation5]. Also, George et al. reported that prognosis was worse in patients with a prolonged QTc interval for adverse outcomes from the Intensive Care Unit [Citation19]. Also, Pickham et al and Gibbs C et al who found three times and two times increase in mortality respectively between patients with prolonged QT > 500 ms [Citation27,Citation28].
Our findings were not in agreement with Seftchick et al. who considered prolonged QTc > 500 ms and concluded in their study that there was no poor outcome in terms of increased mortality in the patients with prolonged QTc interval [Citation29].
PCT is a precursor of calcitonin hormone and it is well known to increase with sepsis with multiple studies demonstrating the value of its use for prognostic prediction in patients with sepsis [Citation30]. We measured the PCT level within the first 24 hours after the diagnosis of sepsis and this was consistent with multiple studies [Citation31,Citation32].
Concerning the PCT level, we found a statistically significant difference between the PCT level and the incidence of mortality with mean PCT level in the non-survivor group 13.4 ± 4.9 ng/dl which was significantly higher than the survivor group. Li et al. in their meta-analysis study concerning the prognostic value of PCT in septic patients, showed that initial high PCT level was associated with increased risk of mortality, with mean PCT level on day 1bewteen the non-survivor = 11.95 ng/dl which is closer to our study [Citation33].
Higher PCT level was found between the non-survivor group with cut off value 8.4 ng/dl with 97.7% sensitivity and 57.9% specificity.
This was close to Meng et al. who found PCT cut off value to be 10 ng/dl with 75% sensitivity and 66.7% specificity [Citation31]. Also, Li et al, Feng et al and to lesser extent Masson et al. who found the PCT cut off value to be 10.65, 8.5 and 14.2 ng/dl respectively, yet with different sensitivity and specificity levels which may be explained by the different sample volume and different mortality incidence between these different studies [Citation33–Citation35].
The combined use of both prolonged QTc ≥ 469 ms and PCT level ≥ 8.4 ng/dl showed 75% sensitivity and 93.4% specificity. So, the combined use of both values gave us higher specificity than each value separately. To our knowledge, no previous studies discussed the issue of combined use of these values together to improve their diagnostic performance.
5. Conclusion
Early diagnosis of septicemia and prediction of mortality risk affects the management strategy for patients inside the ICU which may reflect upon the mortality rates and improve the management outcome. Prolonged QTc interval is an easy, available marker that can be used effectively as a predictor for mortality and is available 24 hours via ECG reading. Also, the PCT level within the first 24 hours after the diagnosis of septicemia shows adequate diagnostic characteristics in mortality prediction.
6. Limitations and recommendations
Our study is a single-center experience, so multi-center research is suspected to give us more accurate results. We were unable to follow up the PCT level due to its high cost.
Competing interests
The authors declare that they have no competing interests and no conflict of interest.
Disclosure statement
We agree that all copyright ownership is transferable to the Egyptian Journal of Anesthesia when the manuscript is accepted for publication in EJA. We certify that the submitted article will not constitute “Redundant Publication”. This study is not previously published nor submitted elsewhere and the methods employed respect the Helsinki Declaration of 1975, as revised in 1983.
Additional information
Funding
References
- Singer M, Deutschman CS, Seymour CW, et al. The third international consenuses definitions for sepsis and septic shock (sepsis-3). JAMA. 2016;315(8):801–810.
- Deutschman CS, Tracey KJ. Sepsis: current dogma and new perspectives. Immunity. 2014;40(4):463–475.
- Prucha M, Bellingan G, Zazula R. Sepsis by markers. Clin Chim Acta. 2015;440:97–103.
- Suberviola B, Castellanos-Ortega A, Ruiz RA, et al. Hospital mortality prognostication in sepsis using the new biomarkers suPAR and proADM in a single determination on ICU admission. Intensive Care Med. 2013;39:1945–1952.
- Wasserstrum Y, Lotan D, Itelman E, et al. Corrected QT interval anomalies are associated with worse prognosis among patients suffering from sepsis. Intern Med J. 2016 Oct;46(10):1204–1211.
- Knaus WA, Draper EA, Wagner DP, et al. APACHE II: A severity of disease classification system. Crit Care Med. 1985;13:818–829.
- Ferreira FL, Bota DP, Bross A, et al. Serial evaluation of the SOFA score to predict outcome in critically ill patients. JAMA. 2001;286:1754–1758.
- Le Gall JR, Lemeshow S, Saulnier F. A new simplified acute physiology score (SAPS II) based on a European/North American multicenter study. JAMA. 1993;270:2957–2963.
- Haugaa KH, Bos JM, Tarrell RF, et al. Institution-wide QT alert system identifies patients with a high risk of mortality. Mayo Clin Proc. 2013;88:315–325.
- Straus SM, Kors JA, De Bruin ML, et al. Prolonged QTc interval and risk of sudden cardiac death in a population of older adults. J Am Coll Cardiol. 2006;47:362–367.
- Buppajarntham S, Seetha Rammohan HR, Junpaparp P, et al. Prognostic value of QTc interval in patients with acute pulmonary embolism. Acta Cardiol. 2014;69:550–555.
- Lopez O, Daniel J, Branski L, et al. Predicting and managing sepsis in burn patients: current perspectives. Ther Clin Risk Manage. 2017;13:1107–1117.
- Deng S, Zhu H, Wang K, et al. Procalcitonin as a marker of sepsis and outcome in patients with neurofibroma: an observation study. BMC Anesthesiol. 2013;13:48.
- Levy MM, Fink MP, Marshall JC, et al. 2001 SCCM/ESICM/ACCP/ATS/SIS international sepsis definitions conference. Crit Care Med. 2003;31:1250–1256.
- Vincent JL, Moreno R, Takala J, et al. The SOFA (Sepsis-related Organ Failure Assessment) score to describe organ dysfunction/failure. On behalf of the working group on sepsis-related problems of the european society of intensive care medicine. Intensive Care Med. 1996;22:707–710.
- Rautaharju PM, Surawicz B, Gettes LS, et al. AHA/ACCF/HRS recommendations for the standardization and interpretation of the electrocardiogram: part IV: the ST segment, T and U waves, and the QT interval: a scientific statement from the American heart association electrocardiography and arrhythmias committee, council on clinical cardiology; the American college of cardiology foundation; and the heart rhythm society. endorsed by the international society for computerized electrocardiology. J Am Coll Cardio. 2009;53:982–991.
- Nelson S, Leung J. QTc prolongation in the intensive care unit: a review of offending agents. AACN Adv Crit Care. 2011;22(4):289–295.
- Drew BJ, Ackerman MJ, Funk M, et al. Prevention of tarsade de pointes in hospital setting: a scientific statement from the American heart association and the American college of cardiology foundation. Circulation. 2010;121:1047–1060.
- George TK, Chase D, Peter JV, et al. Association between a prolonged corrected QT interval and outcomes in patients in a medical intensive care unit. Indian J Crit Care Med. 2015;19:326–332.
- Ashour FH, Maghraby HM, Hassan AS. Procalcitonin as A Diagnostic and Prognostic Marker of Sepsis in Critically Ill Patients in Intensive Care Unit. Egypt J Hosp Med. 2017;68:2.
- Hintze J. Power analysis and sample size software PASS 11. NCSS, LLC. Kaysville, Utah:USA; 2011. Available from: www.ncss.com.
- Naved SA, Siddiqui S, Khan FH. APACHE II score correlation with mortality and length of stay in an intensive care unit. J Coll Physicians Surg Pak. 2011;21(1):4–8.
- Raith EP, Udy AA, Bailey M, et al. Prognostic accuracy of the SOFA score, SIRS criteria, and qSOFA score for in-hospital mortality among adults with suspected infection admitted to the intensive care unit. JAMA. 2017;317(3):290–300.
- Kallergis EM, Goudis CA, Simantirakis EN, et al. Mechanisms, risk factors, and management of acquired long QT syndrome: A comprehensive review. Scientific World J. 2012;2012:212178.
- Namdar M, Biaggi P, Stahli B, et al. A novel electrocardiographic index for the diagnosis of diastolic dysfunction. PLoS One. 2013;8:e7915.2.
- Antonucci E, Fiaccadori E, Donadello K, et al. Myocardial depression in sepsis: from pathogenesis to clinical manifestations and treatment. J Crit Care. 2014;29:500–511.
- Pickham D, Helfenbein E, Shinn JA, et al. High prevalence of corrected QT interval prolongation in acutely ill patients is associated with mortality: results of the QT in Practice (QTIP) Study. Crit Care Med. 2012;40:394–399.
- Gibbs C, Thalamus J, Tove KD, et al. QT prolongation predicts short term mortality independent of comorbidity. EP Europace. 2019;21(8):1254–1260.
- Seftchick MW, Adler PH, Hsieh M, et al. The prevalence and factors associated with QTc prolongation among emergency department patients. Ann Emerg Med. 2009;54:763‑8.
- Liu D, Su L, Han G, et al. Prognostic value of procalcitonin in adult patients with sepsis: a systematic review and meta-analysis. PLoS ONE. 2015;10(6):0129450.
- Meng FS, Su L, Tang YQ, et al. Serum procalcitonin at the time of admission to the ICU as a predictor of short-term mortality. Clin Biochem. 2009;42:1025–1031.
- Jain S, Sinha S, Sharma SK, et al. Procalcitonin as a prognostic marker for sepsis: a prospective observational study. BMC Res Notes. 2014;7:458.
- Li Z, Wang H, Liu J, et al. Serum soluble triggering receptor expressed on myeloid cells-1 and procalcitonin can reflect sepsis severity and predict prognosis: a prospective cohort study. Mediators Inflamm. 2014;2014:641039.
- Feng L, Zhou X, Su LX, et al. Clinical significance of soluble hemoglobin scavenger receptor CD163 (sCD163) in sepsis, a prospective study. PLoS One. 2012;7:e38400.
- Masson S, Caironi P, Spanuth E, et al. Presepsin (soluble CD14 subtype) and procalcitonin levels for mortality prediction in sepsis: data from the albumin italian outcome sepsis trial. Crit Care. 2014;18(1): R6.