
ABSTRACT
Background: Impairment of gas exchange is a common problem during one lung ventilation (OLV) with a hazardous effect on morbidity and mortality. The current study compares the effect of volume-controlled ventilation (VCV) versus pressure-controlled ventilation volume guaranteed (PCV-VG) on gas exchange during OLV.
Settings and Design: This study was a prospective randomized study.
Methods: The study was carried out on 30 adult patients who were randomly assigned to two groups. Group VCV: VCV was performed throughout the operation. Group PCV-VG: PCV-VG was performed throughout the operation. Haemodynamic parameters ((HR), MAP), and (CVP)), blood gas analysis, and PaO2/FiO2 were recorded: before induction of anaesthesia (T0); during TLV (T1); ½ an hour after OLV (T2); 1 h after OLV (T3); 20 minutes after resuming TLV (T4); 6, 12, and 24 hours after surgery (T5, 6, and T7). (Ppeak), (Pmean) and (Cdyn) were recorded during (T1, 2, 3, and T4) time intervals. TNFα level was measured in venous Samples in the following times: (1) before induction of anaesthesia (T0); (2) Directly after surgery (T1); (3) 5th postoperative day (T2). The patients were followed for 5 days for recording of PPCs.
Results: PCV-VG ventilation leads to a significant decrease in Ppeak and Pmean and significant increase in Cdyn (P ≤ 0.05). However, it had no effect on intra- and postoperative oxygenation values.
Conclusion: PCV-VG is superior to VCV as regard respiratory dynamics during one lung ventilation (OLV), while it does not differ as regard items of gas exchange, inflammatory response and PPCs.
Abbreviations: OLV: one lung ventilation; TLV: two lung ventilation; VCV: volume-controlled ventilation; PCV-VG: pressure-controlled ventilation volume guaranteed; PaO2: arterial oxygen tension; FiO2: fraction of inspired oxygen; Ppeak: Peak inspiratory pressure; Pmean: mean inspiratory pressure; Cdyn: dynamic compliance TNFα: Tumour necrosis factor α; PPCs: postoperative pulmonary complications.
1. Introduction
Anaesthesia for thoracic surgery usually involves one-lung ventilation (OLV) to provide ideal surgical operating conditions and to separate and protect the lungs during the surgery. Unfortunately, OLV may be associated with impairment in gas exchange [Citation1]. During OLV, non-ventilated lung, which is perfused, develops an intrapulmonary shunt resulting in arterial hypoxaemia. However, arterial hypoxaemia is considered a critical intraoperative problem, prevention of lung injury has become the major concern in OLV [Citation2].
One-lung ventilation (OLV) may also be injurious in terms of increased mechanical stress characterized by over-distension, alveolar cell stretch, compression of alveolar vessels and increased pulmonary alveolar resistance. Consequently, a variety of inflammatory cytokines may be released, triggering local or systemic inflammatory responses [Citation3]. Based on several experimental studies, the pro-inflammatory cytokine, TNF-α, is an important early mediator of ALI [Citation4].
Postoperative pulmonary complication (PPC) include any complication affecting the respiratory system after anaesthesia and surgery. These complications have major adverse effects on patients, and their prediction is difficult [Citation5].
There is an argument about which ventilation mode is better for arterial oxygenation during OLV. The VCV mode can ensure stabilization of minute volume; however, the higher peak inspiratory pressures may increase the incidence of lung injury and the non-uniform gas distribution [Citation6].
Pressure controlled ventilation volume guaranteed (PCV-VG) mode delivers the preset tidal volume with the lowest possible pressure using a decelerating flow, which has the efficiency and clinical benefits of PCV, yet still compensate for the changes in patient’s lung compliance. In the PCV-VG mode, the anaesthetic machine delivers the first breath to the patient using a VCV setting to test for the patient’s lung compliance, and then the inspiratory pressure level is calculated and determined for the subsequent breaths [Citation7].
The primary outcome in this study was to compare between VCV and PCV-VG as regard intra and postoperative gas exchange. While the secondary outcomes were to compare the effect of these two ventilator modes as regard derived ventilatory parameters, postoperative pulmonary complications, and Tumour necrosis factor- α level as a biomarker of lung injury.
2. Patients and methods
After approval of the Local Ethics Committee and with written informed consent from all patients, this study was conducted in Alexandria Main University hospital between February and August 2019 on 30 adult patients with age 20–50 years and body mass index ≤ (30 kg/m2) admitted for elective thoracic surgeries under general anaesthesia with expected total anaesthesia time of 2 hours or less.
Exclusion criteria were neuromuscular illness, smoking, patients with evidence of pulmonary or systemic infections (clinically defined or elevated C-reactive protein levels, leucocytosis, or body temperature ˃370 C), congestive heart failure, predicted forced expiratory volume in 1 s (FEV1%) below 70%, and pre-operative oxygen saturation in supine position <96%. Every patient was subjected to a careful pre-anaesthetic assessment including the following: proper history taking as regard current or previous medical illness and drug therapy; thorough clinical examination; routine laboratory investigations; pulmonary function tests; chest X-ray; and CT chest. Patients received 0.1 mg/kg intramuscular midazolam with maximum 5 mg half an hour before anaesthesia. Standard monitoring was established using multichannel monitor (GE Healthcare, Carescape Monitor B650, Finland) as follows: Electrocardiogram (ECG) for heart rate (Beats/min) and rhythm (leads II and V5); Non-invasive measurement of arterial blood pressure; Oxygen saturation (SpO2%); and End tidal CO2 (ETCO2). Once patient arrived at operating room, (18 G) peripheral venous cannula was inserted and intravenous fluid infusion was started. After performing modified Allen’s test and after sterilization and local infiltration of skin by xylocaine 2%, radial artery was cannulated on the contralateral side arm of the operation for continous invasive blood pressure monitoring and sampling. After sterilization and local infiltration of skin by xylocaine 2%, central venous catheter was inserted through internal jugular vein on ipsilateral side of the operation for measuring central venous pressure and venous sampling. General anaesthesia was induced with propofol 1.5–2 mg/kg, fentanyl 2 µg/kg and tracheal intubation was facilitated by administration of cis-atracurium 0.15 mg/kg. Anaesthesia was maintained with isoflurane 1–2% in 100% O2 and cis-atracurium increments. A left sided double-lumen endobronchial tube (DLT) was inserted and the correct position confirmed using a fibreoptic bronchoscope. Datex-Ohmeda Ventilator (Avance CS2) will be used in all patients. Initially, two-lung ventilation with VCV in (group VCV) or PCV-VG in (group PCV-VG) was performed using 1.0 fraction of inspired oxygen concentration (FiO2), a tidal volume (TV) of 8 ml/kg of ideal body weight; respiratory rate was adjusted to maintain ETCO2 of 35–40 mmHg and inspiratory-to-expiratory ratio (I:E), 1:2. After changing the patient to a lateral decubitus position, the location of the DLT was reassessed with a fiberoptic bronchoscope. OLV will be performed as the following:
Volume-controlled ventilation group (group VCV): VCV was set to deliver a TV of 6 ml/kg of ideal body weight with no positive end expiratory pressure (PEEP), and the respiration rate was adjusted to maintain an ETCO2 of 35–40 mmHg using 1.0 FiO2.The maximum airway pressure (Pmax), at which the ventilator was alarmed and end inspiration, was adjusted to 40cmH2O. An I:E of 1: 2 was used, and no inspiratory time pause was used.
Pressure-controlled ventilation volume guaranteed (group PCV-VG): PCV-VG was performed using 1.0 FiO2, a TV of 6 ml/kg of ideal body weight with no PEEP, (Pmax) 40 cmH2O, and an I:E of 1:2; the respiration rate was adjusted to maintain an ETCO2 of 35–40 mmHg. The rise rate, which indicates how quickly the ventilator reaches the targeted airway pressure, was adjusted to 5 seconds.
Before closure of thoracotomy and after resuming two-lung ventilation, lung recruitment manoeuver (RM) was done in all patients by applying continous positive airway pressure (CPAP) of 30 cmH2O for 30 seconds. At the end of surgery, neuromuscular blockade was reversed with injection of neostigmine (40 mcg/kg) with atropine (20 mcg/kg). Then, the patients were transferred to post-anaesthesia care unit (PACU). In (PACU), patients received I.V nalbuphine 0.10 mg/kg every 4 hours and I.V paracetamol 15 mg/kg every 8 hours. If visual analogue scale (VAS) became more than three, pain was treated by (5 mg) nalbuphine I.V. The patients were followed for 5 days for recording of postoperative pulmonary complications. Venous Samples were collected, centrifuged at 1500 to 2000 rpm for 15 min to obtain serum, and the supernatant was stored at – 80°C. Serum tumour necrosis factor α (TNFα) was measured by enzyme-linked immunosorbent assay (ELISA) using Assay Max Human TNF-a kit (Assaypro, St Charles, MO, USA) according to the manufacturer’s protocols.
The following parameters were measured: 1-Demographic Data; Age (years); sex; and body mass index (BMI (kg/m2)). 2-Type and duration of surgery. 3-Haemodynamic parameters: heart rate (beat/minute); mean arterial blood pressures (mmHg); and central venous pressure (CVP). 4-Arterial blood gases: pH; PaO2; PaCO2; SaO2; and PaO2/FiO2. The previous parameters were recorded: before induction of anaesthesia (T0); during two lung ventilation TLV (T1); ½ an hour after OLV (T2); 1 hour after OLV (T3); 20 minutes after resuming TLV (T4); 6, 12 and 24 hours after surgery (T5, T6 and T7). 5-Derived ventilatory parameters: Expired tidal volume (TVe) in ml; Peak inspiratory pressure (Ppeak) in cmH2O; Mean inspiratory pressure (Pmean) in cmH2O; and Lung dynamic compliance (Cdyn). The previous parameter recorded at: (T1, T2, T3, and T4). 6-Tumour necrosis factor α (TNFα) level was measured in venous Samples in the following times: Before induction of anaesthesia (T0); directly after surgery (T1); and Fifth postoperative day (T2). 7-All patients were followed for 5 days and any of (PPCs) was reported.
3. Statistical analysis
Sample size was statistically approved by the Biostatistics Department, Medical Research Institute; Alexandria University by using NCSS & PASS program for sample size calculation and according to data obtained from previous study [Citation8]. A sample size of 30 patients was estimated to achieve an 80% power with level of significance 5%.
Data were fed to the computer and analyzed using IBM SPSS software package version 20.0. (Armonk, NY: IBM Corp) Qualitative data were described using number and percentage. The Kolmogorov–Smirnov test was used to verify the normality of distribution. Quantitative data were described using range (minimum and maximum), mean, standard deviation, median and interquartile range (IQR). Significance of the obtained results was judged at the 5% level.
The used tests were: Chi-square test (for categorical variables, to compare between different groups), Fisher’s Exact or Monte-Carlo correction (correction for chi-square when more than 20% of the cells have expected count less than 5), Student t-test (for normally distributed quantitative variables, to compare between two studied groups), and ANOVA with repeated measures (For normally distributed quantitative variables, to compare between more than two periods or stages, and Post Hoc test (Bonferroni adjusted) for pairwise comparisons). Pearson coefficient to correlate between two normally distributed quantitative variables.
4. Results
Forty patients were screened for eligibility to participate in this study and 30 patients subsequently were enrolled in the study, with no patient drop-outs (). There was no statistically significant difference between two groups as regard demographic data (). There were nine males and six females in group VCV, eight males and seven females in group PCV-VG; (p = 0.713) the mean BMI 23.86 kg/m2 ± 1.27 in group VCV while it was 23.70 kg/m2 ± 1.04. as regard age (mean: 34.73 years ± 9.76 in group VCV, 34.33 years ±8.61 in group PCV-VG); (p = 0.906). There were no statistical difference between the two groups as regard the duration of surgery (p = 0.698) nor the type of surgery (p = 0.896) (). There was notable haemodynamic stability in both groups. Despite the increase in heart rate, mean arterial blood pressure and central venous pressure, these haemodynamic values were within the normal range during intra and postoperative periods (). As regard heart rate, the mean heart rate before induction of anaesthesia (T0) was 73.07 beats/min ±6.51 in group VCV and was 74.67 beats/min ± 7.14 in group PCV-VG. After that in both groups, it showed significant increase after induction of anaesthesia (T1), then it was significantly higher in comparison to baseline from T2-T7, and then it began to return near baseline at T8 and T9. As regard mean arterial blood pressure (MAP), the mean value of MAP before induction of anaesthesia (T0) was 85.87 mmHg ±4.93 in group VCV and was 86.07 mmHg ± 4.85 in group PCV-VG. After that in both groups, it showed significant increase after induction and during one lung ventilation (T1, T2 and T3) and throughout the remaining time intervals there was no statistically significant difference from the baseline.as regard CVP, there was statistically significant rise from the baseline (T0) throughout the study. In the current study, there was no statistically significant difference between the two groups as regard pH, PaO2, PaCO2, and gas exchange parameters (). As regard pH, the mean pH before induction of anaesthesia (T0) was 7.40 ± 0.02 in group VCV and was 7.39 ± 0.01 in group PCV-VG. There was no statistically significant difference from the baseline throughout the study in both groups (p ≥ 0.05). As regard PaO2, the mean PaO2 before induction of anaesthesia (T0) was 86.07 mmHg ± 2.19 in group VCV and was 86.93 mmHg ±1.94 in group PCV-VG. After that in both groups, it became significantly higher than the baseline during (T1) then during OLV (T2 and T3) it became significantly lower than (T1) but still significantly higher than the baseline. It continued to be significantly higher than baseline during (T4). As regard PaCO2, the mean PaCO2 before induction of anaesthesia (T0) was 40.20 mm Hg ±1.82 in group VCV and was 41.20 mm Hg ±2.21 in group PCV-VG. After that in both groups, it became significantly lower than the baseline during (T1 and T2) then it became insignificantly different from baseline in most of the remaining time intervals. As regard PaO2/FIO2, in group VCV, the mean value of PaO2/FIO2 before induction of anaesthesia (T0) was 409.5 ± 10.31. Then, it became significantly lower than the baseline throughout the remaining time intervals. In group PCV-VG, the mean value of PaO2/FIO2 before induction of anaesthesia (T0) was 413.8 ± 9.30. Then, it became significantly lower than the baseline during (T1, T2, T3, T4, and T6). While during (T5 and T7) the mean was insignificantly different from the baseline 405.3 ± 10.67 and 404.9 ± 11.09, respectively. PCV-VG ventilation leads to a significant decrease in peak and mean airway pressures (Ppeak and Pmean) and significant increase in dynamic lung compliance (P ≤ 0.05) ( respectively). As regard expired tidal volume, there was no statistically significant difference in expired tidal volume (TVe) between two groups (p ≥ 0.05). During OLV the peak and mean airway pressures increased in both groups but they were significantly lower in PCV-VG than VCV (p ≤ 0.05). The mean of Ppeak in VCV group during OLV (T1 and T2) was 25.60 cmH2O ±2.67 and 26.80 cmH2O ±2.78, respectively, while the mean of Pmean in VCV group during OLV (T1 and T2) was 8.33 cmH2O ±0.49 and 8.67 cmH2O ±0.62, respectively. Dynamic compliance had decreased in both groups during OLV, but it was significantly higher in PCV-VG than VCV (p ≤ 0.05). during OLV (T1 and T2) in PCV-VG group, the mean was 29.80 ml/cmH2O ±4.57 and 28.93 ml/cmH2O ±5.54, respectively, while in VCV group it was 20.53 ml/cmH2O ±2.61 and 19.67 ml/cmH2O ±2.79, respectively. In the present study, tumour necrosis factor α (TNFα) level was significantly higher in group VCV than in group PCV-VG immediately after surgery (T1) (p ≤ 0.05). Its level returned to near baseline in both groups after five days (T2). During (T1), the mean of (TNFα) in group VCV was 174.50 pg/ml ±35.1, while it was 152.80 pg/ml ±15.8 in group PCV-VG (). The present study shows that increased TNFα level immediately after surgery is directly correlated with increased peak airway pressure (Pearson correlation coefficient is 0.400) (). and inversely correlated with dynamic compliance (Pearson correlation coefficient is −0.433) (). As regard the (PPCs), there was no statistically significant difference between two groups (p ≥ 0.05). Three patients in group VCV developed PPCs in form of atelectasis, pneumothorax and pneumonia while only one patient in group PCV-VG developed bronchospasm.
Table 1. Demographic data
Table 2. Oxygenation parameters and haemodynamic data in both groups. Data are expressed as mean ± SD.Time points: before induction of anaesthesia as a baseline (T0); during two lung ventilation (T1); 30 min after one lung ventilation (T2); one hour after OLV (T3); 20 min after resuming TLV (T4); 6; 12; and 24 hours after surgery (T5, T6, and T7). PCV-VG, pressure-controlled ventilation volume guaranteed; VCV, volume-controlled ventilation; PaO2, arterial blood oxygen tension; PaCO2, arterial blood carbon dioxide tension; FiO2, fraction of inspired oxygen; SaO2, arterial oxygen saturation; HR, heart rate; MAP, mean arterial pressure; CVP, central venous pressure. $ P < 0.05 within the PCV-VG group; # P < 0.05 within the VCV group
Figure 1. Flow chart of patients
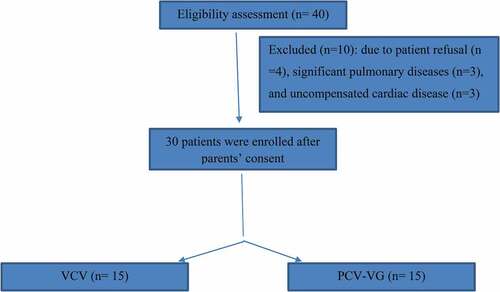
Figure 2. Comparison between the two studied groups
Figure 3. Comparison between the two studied groups according to according to Ppeak(cm/H2O) according to Pmean(cm/H2O)
Figure 4. Comparison between the two studied groups
Figure 5. Comparison between the two studied according to Cdyn (ml/cm H2O) groups according to TNFα (pg/ml)
Figure 6. Correlation between TNFα (pg/ml) and P peak (cm/H2O)
Figure 7. Correlation between TNFα (pg/ml) and Cdyn (ml/cmH2o)
5. Discussion
In the current study, there was no statistically significant difference between the two groups as regard haemodynamic parameters.
In agreement with the current study, Mahmoud et al., compared VCV with PRVC during thoracic surgery with the same TV of 6 ml kg-1 and reported that there were no significant differences as regard haemodynamic parameters. As regard heart rate, the mean heart rate 20 min after TLV as a baseline (T0) was 78 beats/min ±9 in group VCV and was 76 beats/min ± 10 in group pressure regulated volume control (PRVC). As regard mean arterial blood pressure (MAP), the mean value of MAP 20 min after TLV as a baseline (T0) was 85 mm Hg ±10 in group VCV and was 84 mm Hg ± 10 in group PRVC [Citation9].
There was no statistically significant difference between the two groups as regard pH, PaO2, PaCO2, and gas exchange parameters between both groups.
In accordance with findings of the present study, Cengiz et al studied the effect of PCV-VG on airway pressure, oxygenation, and postoperative complications in one-lung ventilation in 80 patients who underwent lobectomies. They reported that PaO2 values were significantly higher only in PCV-VG modes with two-lung ventilation (P = 0.033). However, remaining values including pH, PaCO2, PaO2, PaO2/FIO2, and lactate were similar (P > 0.05). They concluded that there were no significant differences in oxygenation values between the groups and explained that the increase in PaO2 during TLV was attributed to the moderate increase in Pmean [Citation10].
In agreement with the current study, Zhu et al., compared between Pressure-controlled versus volume-controlled ventilation during one-lung ventilation for video-assisted thoracoscopic lobectomy and reported that there were no differences with arterial blood gas analysis results (i.e., pH, PaO2, PaCO2) between these two groups. As regard oxygenation index, they did not find any difference between these two groups not only during operation but also in postoperative period. They followed up arterial blood gas for two days after operations and no difference was shown [Citation11].
In agreement with the current study, Song et al., compared PCVG and VCV in their study of 27 patients. In their study, PCV-VG increased oxygenation in 63% of patients and decreased oxygenation in 33% of patients. However, there was no difference between the two modes in terms of oxygenation [Citation12].
In agreement with the current study, another study reported that PRVC and PC were superior to VC ventilation in providing ventilation with the least Ppeak in young adult patients during laparoscopic bariatric surgery; however, there was no difference in oxygenation parameters or hemodynamic data between the three ventilation modes [Citation13].
In contradiction with findings of the current study, Mahmoud et al., reported that compared with VCV, the use of PRVC mode with the same TV of 6 ml kg-1 had better effect on arterial oxygenation during OLV or postoperative oxygenation. This finding may be attributed to using positive end-expiratory pressure (PEEP) throughout surgery. Also, the use of epidural analgesia is proved to improve respiratory mechanics, and this is reflected on postoperative oxygenation [Citation9].
In contradiction with findings of the current study, another recent trial has made comparison between VC, PC and PRVC modes during OLV in elderly patients and concluded that both PC and PRVC modes were superior over VC in respect to intraoperative oxygenation parameters and airway pressures. Furthermore, PaO2 in PRVC group was significantly higher than in PC group. This finding may be attributed to younger age group in the present study [Citation14].
PCV-VG ventilation leads to a significant decrease in peak and mean airway pressures (Ppeak and Pmean) and significant increase in dynamic lung compliance (P ≤ 0.05). As regard expired tidal volume, there was no statistically significant difference in expired tidal volume (TVe) between two groups (p ≥ 0.05).
In accordance with findings of the current study, Boules et al., studied Efficiency of pressure controlled ventilation-volume guaranteed in thoracic surgery with one lung ventilation and reported that the peak and mean inspiratory pressures were significantly lower in PCV-VG group compared with VCV group in all stages of the study [Citation15].
Similarly, Toker et al., compared between PCV-VG and VCV in obese patient during gynecologic laparoscopic surgery in the Trendelenburg position and reported that the PCV-VG group had significantly decreased peak inspiratory pressure, mean inspiratory pressure, and increased dynamic compliance compared to the VCV group [Citation16].
In accordance with findings of the current study, Pu et al. equally assigned 20 participants w into two groups in a controlled, randomized, crossover design. Group A: VCV was performed initially and changed into PCV-VG after 30 min; Group B: In the reverse order. Blood gas analysis, peak inspiratory pressure (Ppeak), and mean inspiratory pressure (Pmean), were measured at four different time points. They concluded that that applications of PRVC during OLV in thoracic surgery resulted in lowering peak and mean inspiratory pressures than VCV [Citation8].
Similarly, Gad et al., compared between PCV-VG and VCV with ERV in Obese Patients Undergoing Laparoscopic Hysterectomy and reported that the PCV-VG group had significantly decreased peak inspiratory pressure, mean inspiratory pressure, and increased dynamic compliance compared to the VCV with ERV group [Citation17].
On the contrary, Li et al., compared between four groups using PCV-VG and VCV with either open lung approach or standard lung ventilation approach and found no statistically significant difference between PCV-VG and VCV in standard lung ventilation approach as regard respiratory dynamics. This finding may be attributed to using of high PEEP [Citation18].
As regard the (PPCs), there was no statistically significant difference between two groups (p ≥ 0.05). Three patients in group VCV developed atelectasis, pneumothorax and pneumonia while only one patient in group PCV-VG developed bronchospasm.
In accordance with the current study, Hassan et al. compared between VCV and PCV-VG in postoperative lung atelectasis using lung ultrasound following upper abdominal laparotomies and reported that there was no significant difference between the two groups both showed atelectasis immediate, 2 h and 6 h postoperatively [Citation19].
Also, Cengiz et al. concluded that there were no significant differences in postoperative complication rates between PCV-VG and VCV groups (P > 0.05) [Citation10].
Fernandez et al. reported in multicenter study by the perioperative research network investigators that there was no significant difference between PCV-VG and VCV as regard PPCs [Citation20].
Similarly, Zhu et al. compared between Pressure-controlled versus volume-controlled ventilation during one-lung ventilation for video-assisted thoracoscopic lobectomy and reported that there were no differences in the incidence of PPCs between two groups [Citation11].
On the contrary, Mahmoud et al., reported that compared with VCV, the use of PRVC mode with the same TV of 6 ml kg-1 resulted in significant lower PPCs. This finding may be attributed to longer operative time and differs in patient’s characteristics [Citation9].
In the present study, tumour necrosis factor α (TNFα) level was significantly higher in group VCV than in group PCV-VG immediately after surgery (T1) (p ≤ 0.05). Its level returned to near baseline in both groups after five days (T2). In accordance with the present study, Mahmoud et al., reported significant higher levels of TNFα in VCV throughout OLV, after resuming TLV and at end of surgery (T1, T2, and T3). In VCV group, the mean values of (TNFα) during were 100 pg/ml ±26, 288 pg/ml ±96, and 282 pg/ml ±90, respectively, [Citation9]. On the contrary, Yao et al. studied 60 patients undergoing thoracoscopic lobectomy who were randomly assigned to a VCV group or a PCV-VG group. Inflammatory factors were monitored to assess lung function. They reported that There was no significant difference in TNF-α, and IL-8 between two groups (P = 0.76, P = 0.35). But compared with T1, concentration of TNF-α, and IL-8 other time points in each group were statistically different (P = 0.01) [Citation21].
The present study shows that increased TNFα level immediately after surgery is directly correlated with increased peak airway pressure (Pearson correlation coefficient is 0.400) and inversely correlated with dynamic compliance (Pearson correlation coefficient is −0.433). Many experimental studies have reported the effect of peak inspiratory flow on ventilator-induced lung injury (VILI). For our current knowledge, this is the first human study reporting correlation between peak airway pressure and lung injury. In an experimental study on rabbits, Yoshiko Maeda et al. studied injurious effects of high peak airway pressure on development of ventilator-induced lung injury and concluded that when an injurious TV delivered at a higher peak flow, the deterioration in lung histology appears to be more marked than when it is delivered at a lower peak flow in an animal model [Citation22].
6. Conclusion
We conclude that PCV-VG mode during OLV in thoracic surgery caused favourable effect on intraoperative respiratory mechanics, but it offered no advantage over VCV as regard occurrence of postoperative pulmonary complications and gas exchange. The risk of lung injury with the use of PCV-VG during OLV was lower than with VCV as judged by lower levels of TNFα in immediate postoperative period.
7. Limitations
Limitations in the present study include being a small sized and single center study.
Acknowledgments
We wish to thank staff of clinical pathology department, faculty of medicine, Alexandria university for helping us in measuring inflammatory marker levels.
Disclosure statement
No potential conflict of interest was reported by the author(s).
References
- Lin F, Pan L, Huang B, et al. Pressure-controlled versus volume-controlled ventilation during one-lung ventilation in elderly patients with poor pulmonary function. Ann Thorac Med. 2014;9(4):203.
- Kim K, Kim D, Jeong M, et al. Comparison of pressure-controlled ventilation with volume-controlled ventilation during one-lung ventilation: a systematic review and meta-analysis. BMC Anesthesiol. 2015;16(1). DOI:10.1186/s12871-016-0238-6
- Kozian A, Schilling T. Protective ventilatory approaches to one-lung ventilation: more than reduction of tidal volume. Curr Anesthesiology Rep. 2014;4(2):150–159.
- Parsons P. Elevated plasma levels of soluble TNF receptors are associated with morbidity and mortality in patients with acute lung injury. AJP: Lung Cell Mol Physiol. 2005;288(3):426–431.
- Miskovic A, Lumb AB. Postoperative pulmonary complications. Br J Anaesth. 2017;118(3):317–334.
- Liu Z, Liu X, Huang Y, et al. Intraoperative mechanical ventilation strategies in patients undergoing one-lung ventilation: a meta-analysis. SpringerPlus. 2016;5(1):1251.
- Kothari A, Baskaran D. Pressure-controlled volume guaranteed mode improves respiratory dynamics during laparoscopic cholecystectomy: a comparison with conventional modes. Anesth Essays Res. 2018;12(1):206–212.
- Pu J, Liu Z, Yang L, et al. Applications of pressure control ventilation volume guaranteed during one-lung ventilation in thoracic surgery. Int J Clin Exp Med. 2014;7(4):1094–1098.
- Mahmoud K, Ammar A, Kasemy Z. Comparison between pressure-regulated volume-controlled and volume-controlled ventilation on oxygenation parameters, airway pressures, and immune modulation during thoracic surgery. J Cardiothorac Vasc Anesth. 2017;31(5):1760–1766.
- Sahutoglu C, Kocabas S, Askar FZ. Effects of pressure-controlled ventilation-volume guaranteed on airway pressure, oxygenation, and postoperative complications in one-lung ventilation: a prospective randomized-controlled study. Int J Clin Exp Med. 2018;11(12):13681–13688.
- Zhu Y, Fang F, Ling X, et al. Pressure-controlled versus volume-controlled ventilation during one-lung ventilation for video-assisted thoracoscopic lobectomy. J Thorac Dis. 2017;9(5):1303–1309.
- Song S, Jung J, Cho M, et al. Volume-controlled versus pressure-controlled ventilation-volume guaranteed mode during one-lung ventilation. Korean J Anesthesiol. 2014;67(4):258.
- Dion JM, McKee C, Tobias JD, et al. Ventilation during laparoscopic-assisted bariatric surgery: volume-controlled, pressure-controlled or volume-guaranteed pressure-regulated modes. Int J Clin Exp Med. 2014;7(8):2242–2247.
- Lin F, Pan L, Qian W, et al. Comparison of three ventilatory modes during one-lung ventilation in elderly patients. Int J Clin Exp Med. 2015;8(6):9955–9960.
- Boules N, Ghobrial H. Efficiency of the newly introduced ventilatory mode “pressure-controlled ventilation-volume guaranteed” in thoracic surgery with one lung ventilation. Egypt J Anaesth. 2011;27(2):113–119.
- Toker M, Altıparmak B, Uysal A, et al. Comparison of pressure-controlled volume-guaranteed ventilation and volume-controlled ventilation in obese patients during gynecologic laparoscopic surgery in the Trendelenburg position. Braz J Anesth (English Edition). 2019;69(6):553–560.
- Gad M, Gaballa K, Abdallah A, et al. Pressure-controlled ventilation with volume guarantee compared to volume-controlled ventilation with equal ratio in obese patients undergoing laparoscopic hysterectomy. Anesthesia. 2019;13(2):347.
- Li J, Cai B, Yu D, et al. Pressure-controlled ventilation-volume guaranteed mode combined with an open-lung approach improves lung mechanics, oxygenation parameters, and the inflammatory response during one-lung ventilation: a randomized controlled trial. Biomed Res Int. 2020;2020:1–11.
- Hassan B, El-Shaer A, Elbeialy M, et al. Comparison between volume-controlled ventilation and pressure-controlled volume-guaranteed ventilation in postoperative lung atelectasis using lung ultrasound following upper abdominal laparotomies: a prospective randomized study. Ain-Shams J Anesthesiol. 2020;12(1). DOI:10.1186/s42077-020-00076-9
- Fernandez-Bustamante A, Frendl G, Sprung J, et al. Postoperative pulmonary complications, early mortality, and hospital stay following noncardiothoracic surgery. JAMA Surg. 2017;152(2):157.
- Yao W, Yang M, Cheng Q, et al. Effect of pressure-controlled ventilation-volume guaranteed on one-lung ventilation in elderly patients undergoing thoracotomy. Med Sci Monit. 2020;26.
- Maeda Y, Fujino Y, Uchiyama A, et al. Effects of peak inspiratory flow on development of ventilator-induced lung injury in rabbits. Anesthesiology. 2004;101:722–728.