
 ?Mathematical formulae have been encoded as MathML and are displayed in this HTML version using MathJax in order to improve their display. Uncheck the box to turn MathJax off. This feature requires Javascript. Click on a formula to zoom.
ABSTRACT
The present investigation was conducted during the period 2017–2018 on Ganga riverbed mining-affected areas of district Haridwar for the assessment of seasonal dynamics of surface quality using the Overall Index of Pollution (OIP). OIP analysis was helpful in determining surface water quality. For the analysis, five sampling sites were selected with triplicate analysis of collected water sample were done to represent the effective impact of riverbed mining on selected physicochemical parameters. OIP value of surface water quality were found in winter (excellent: 1.13) > summer (acceptable: 3.37) > monsoon (slightly polluted: 7.94). As compared to site where mining was not carried out, the spatial analysis showed that the selected riverbed mining sites had high OIP score. Therefore, it was concluded that the riverbed mining practice had a negative influence on the surface water quality of the Ganga River in the selected region, and hence should be given special attention to maintaining ecological sustainability.
Introduction
Rivers are one of the major sources of freshwater for human beings for providing water for irrigation, industrial, and daily needs (Meybeck, Citation1976; Ridoutt & Pfister, Citation2010; Sunil, Somashekar, & Nagaraja, Citation2010). The transfer of sediments, pollutants, debris, and other substances from one place to another place is also carried out by the current of a river systems (Lal, Citation1977; Padmalal & Maya, Citation2014). Rivers are also responsible for maintaining or recharging the groundwater aquifers (Ghalib & Sogut, Citation2014). However, water chemistry of the riverine ecosystem depends upon various lithological characteristics, evaporation process, habitat ecological parameters, and weathering of rocks from place to place (Ghalib, Citation2017). Nowadays, rivers are under enormous load due to anthropogenic activities like sewage waste discharged, industrial activity, riverbed mining activity, water quality of the river has deteriorated appreciably which has affected the aquatic life as well as human life (Aswal, Singh, Kamboj, & Singh, Citation2016; Jindal & Sharma, Citation2010; Kamboj, Kamboj & Sharma, Citation2017; Sreebha & Padmalal, Citation2011). Amongst the above, riverbed mining has become a major threat to the aquatic habitats and health of the related flora and fauna (Soucek, Cherry & Zipper, Citation2003). Riverbed mining is the extraction process of sediments from the bottom of instream and floodplain area of the river (Kamboj et al., Citation2017; Sreebha & Padmalal, Citation2011). The aquatic diversity is negatively affected by the riverbed mining practice as it removes the significant nutrients from the rivers. This hampers the thriving organisms leading to the disturbance of the river ecosystems (Bruns, Citation2005). The quality of river water changes severely when the riverbed mining practice is conducted on the instream which promotes temporary turbidity and create the disturbance in other related parameters (Peck Yen & Rohasliney, Citation2013).
Ganga River, one of the most significant perennial rivers of the country, enjoys the spiritual status in Hindu religion and is a great symbol of Indian culture. It originates from the Himalayas in the Indian state of Uttarakhand and flows through the north Indian Gangetic plain, covering a catchment area of 2525 km and finally falling into the Bay of Bengal (Kamboj, Bharti, Kamboj, Rani & Sharma, Citation2016; Kumar, Kumar, Srivastava, Singh & Kumar, Citation2018). It is the largest river in the world by discharge (Bhattacharji & Bandyopadhyay, Citation1995).
The Ganga River carries a huge quantity of sediments consisting of stone, gravel, and sand during the monsoon. The deposition of these materials in the river form the sediments dunes. These sediments dunes are continuously changing the morphological characteristics of the river which causes bank erosion and leads to a flood condition (Kamboj, Pandey, Shoaib & Kumar, Citation2012). So, to protect the river bank, forest land, and nearby agriculture landform from flooding, the collection of sands, boulders, and gravels from the riverbed have been undertaken. But due to the unscientific and haphazard mining activity, it influences the water quality and aquatic biodiversity. The quality of surface water plays a significant role in the development of aquatic flora and Fauna. Many Hydrogeochemical models (Ghalib, Yaqub & Al-Abadi, Citation2019) and water quality index method were used to assess the status of water quality. Water quality index is a single numerical value used for determining the quality of water for human consumption (Asadi, Vuppala & Anji, Citation2007; Hoseinzadeh, Khorsandi, Wei & Alipour, Citation2014). For evaluating the quality status of any river body, a plethora of water quality indices are available. Most common water quality index used are weighted arithmetic index method (Brown, McClelland, Deininder & Tozer, Citation1970), National Sanitation Foundation Water Quality Index (NSFWQI) (Hoseinzadeh et al., Citation2014), Overall Index of Pollution (OIP) (Sargaonkar & Deshpande, Citation2003), etc. The OIP helps in understanding the water quality condition of the surface water sources especially under Indian conditions (Sargaonkar & Deshpande, Citation2003). The present study is the first of its kind in revealing the surface water quality of Ganga River in the riverbed mining area based on the OIP to restoring, flood management, and recreational activities of the Riverine system. In the present study, an attempt has been made to investigate whether riverbed mining activities influence the quality of river water or not.
Materials and methods
Study area
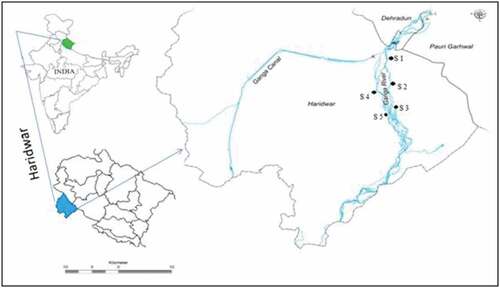
The present study was performed to assess the surface water quality in the riverbed mining area of Ganga River at district Haridwar. Haridwar is endowed with natural resources. It is an integral place of pilgrimage for Hindu religion. It located at Latitude 29° 56ʹ 52.48” N and Longitude 78° 09ʹ 36.90” E. For the present study, total five sampling sites (S1–S5) were selected which covered an area of about 46 km, S1 site is a reference site having no mining activity located in the downstream of Bhimgoda Barrage. In the downstream of S1 site, Ganga River gets diverted into two channel due to the formation of sediment dunes in the middle of Ganga River. So the two sites (S2 and S3) were selected in the right bank and two sites (S4 and S5) were selected in the left bank of Ganga River. At sites S2 to S5, riverbed mining activity is being conducted. The Geo-coordinates, landmarks, and demarcation of sampling sites mentioned in and .
Table 1. Location of the sampling sites and their geo-coordinates of Ganga River at Haridwar district.
Figure 1. Map of study area showing the five different sampling sites on the Ganga River.
Sampling procedure and methods of analysis
Water samples were collected from all the selected five sampling sites (S1–S5) bi-monthly by grab sampling method from June 2017 to May 2018. A total of twenty-four samplings was performed during the study period. The water samples were collected in the polyethylene bottles at the depth of 15–20 cm below the surface water. A total of thirteen physicochemical parameters were being analyzed in the laboratory for assessing the surface water quality. The Water Temperature, Conductivity, pH, and TDS were measured by TOSHCON electrochemical analyzer, TMULTI 27; Italy at the sampling location. Analytical parameters like Alkalinity, Total Hardness, Calcium, Magnesium, Dissolve Oxygen (DO) & BOD (Winkler titration method) were analyzed in the laboratory following the standard methods (APHA, Citation2012; Trivedy & Goel, Citation1986). Sodium and Potassium were estimated using Microprocessor Flame Photometer (ESICO) Model 1382. The measurement of all the parameters was done in triplicate and the mean value was presented in the table. For this study, the monthly data of water sample was formulated into seasonal data, monsoon (June–September), winter (October–January), and summer (February–May).
Statistical analysis
The data presented in the present study was the mean value with a standard deviation of three replicates calculated by using MS Excel, 2013.
Calculation of water quality index (WQI)
For the calculation of WQI, the OIP (Sargaonkar & Deshpande, Citation2003) was adopted. This index showed the health status of water under Indian conditions. The calculation of the index was done using EquationEquation (1)(1)
(1) .
Where Pi = pollution index for the ith parameters and n = number of parameters.
Sargaonkar and Deshpande (Citation2003) classified the water quality into 5 classes on the basis of the OIP score mentioned in . According to OIP classification, if the OIP score is <1.9, then the water quality is excellent and comes under the Class C1. If the OIP score is <3.9, then the water quality is acceptable and falls under the class C2. The OIP score <7.9, <15.9, and >16 shows slightly polluted (Class-C3), polluted (Class-C4), and heavily polluted (Class C5), respectively.
Table 2. Classification of water quality in the overall index of pollution (Sargoankar and Deshpande, Citation2003).
Result and discussion
The information regarding surface water quality of the river is vital for maintaining and survival the aquatic life. Humans, in some way or the other, depending on the river for fulfilling their daily needs. For keeping this way of view, the present study was undertaken for assessing the surface water quality of the River Ganga using OIP. In the current study, thirteen physicochemical parameters were analyzed. The data showing the seasonal variation in water quality at a different location (S1–S5) of River Ganga was tabulated in . The overall quality of the Ganga River was depicted as a statistical summary during summer, winter, and monsoon season in .
Table 3. Seasonal water quality of Ganga River at different sites (Mean±S.D.).
Table 4. Descriptive statistics for water quality parameters of Ganga River (Mean ±S.D.).
Water temperature is one of the most important factors in the aquatic environment since it influences the physicochemical as well as biological activity (Ali, Ali, Islam, & Rahman, Citation2016). The water temperature varies from 14.25 ± 1.26°C to 16.17 ± 1.07°C in winter, 19.75 ± 5.31°C to 22.42 ± 3.6°C in summer, and 23 ± 4.16°C to 24.22 ± 3.88°C in monsoon seasons at all the sampling sites (S1–S5). The average values of water temperature 21.98 ± 1.44°C for the summer season, 15 ± 0.34°C for the winter season and 23.49 ± 0.52°C for monsoon season were recorded. Similar value and trend have been observed in the Ganga River by (Chaturvedi, Kumar, & Singh, Citation2003; Garg, Citation2006).
pH generally shows the degree of acidity and basicity of a water sample. The average pH values 7.78 ± 0.09, 7.62 ± 0.37, and 7.11 ± 0.44 for summer, winter and monsoon season were recorded respectively. The permissible limit of pH as per BIS (Citation2012) standards is from 6.5-8.5. At selected sites (S1–S5), pH value shows the acidic nature of water in monsoon season and alkaline or neutral in summer and winter season. The acidic nature of water in monsoon season may be due to the increase in free CO2 (Gupta, Pandey, & Hussain, Citation2017). Kamboj et al. (Citation2016) and Kumar and Bhushan (Citation2012) observed the pH value range from 7.8 to 8.07 of the Ganga River.
Turbidity is an main important parameter in the monitoring of water quality. The higher value of turbidity decreases light penetration in the water body (Verma & Saksena, Citation2010). According to BIS (Citation2012) standards, the desirable limit of turbidity is 5 NTU. The maximum value of turbidity (364.15 ± 3.39 NTU) was found in monsoon season while the minimum value (25.4 ± 2.27 NTU) in the winter season. In summer, the value of turbidity 135.7 ± 1.97 NTU was reported. Riverbed mining activity creates the high turbidity in short terms due to the removal of riverbed material in all the seasons. The high value of turbidity in monsoon season is due to the rainfall-runoff discharge into the river. Some researchers like Gupta et al. (Citation2017); Almeida, Gonzalez, Mallea, and Gonzalez (Citation2012) also reported the higher turbidity value in the monsoon season for the different rivers.
Electrical conductivity means a measurement of electric current carrying capacity and dissolved ions present in a water sample. The average values of electrical conductivity 159.33 ± 3.60 µS/cm, 136.19 ± 3.1 µS/cm, and 210.57 ± 4.60 µS/cm for summer, winter and monsoon season were recorded, respectively. The electrical conductivity was found to be in the range of 130.95 ± 7.35–215.67 ± 2.79 µS/cm were within the BIS (Citation2012) permissible limit, 300 µS/cm. Kamboj et al. (Citation2016) reported the electrical conductivity between 258 µS/cm to 290.1 µS/cm of the Ganga River and also Upadhyay and Chandrakala (Citation2014) found the range of electrical conductivity 290–320 µS/cm of Kaveri River at Karnataka.
Total dissolved solids are the direct measurement of dissolved particles in the water sample. The average concentration of TDS, 106.75 ± 2.41 mg/l during summer, 91.25 ± 2.07mg/l during the winter season, and 141.1 ± 3.04 during monsoon season were recorded. The desirable limit of TDS is 500 mg/l according to the BIS. In all the seasons, the value of TDS of Ganga River was found within the permissible limit of BIS. Kamboj et al. (Citation2016) reported the value of TDS range between 172.90 and 187.70 mg/l of Ganga River and Jindal and Sharma (Citation2010) observed the TDS value 156 mg/l–582 mg/l for Sutlej River.
Dissolved oxygen is an essential parameter in water quality assessment and reflects the physical and biological process prevailing in the water which indicates the degree of pollution in water bodies. During the study, the DO varies 7.29 ± 0.39 to 8.30 ± 0.34 mg/l at the selected sites. The average value of DO (8.1 ± 0.12 mg/l) in summer, (7.98 ± 0.21 mg/l) in winter, and in monsoon (7.40 ± 0.11 mg/l) were reported. The desirable limit of the dissolved oxygen is 5 mg/l as per BIS standards. Sharma, Dixit, Jain, Shah, and Vishwakarma (Citation2008) also observed the DO value range between 6.5-15 mg/l of the Narmada River.
Biochemical oxygen demand (BOD) is the amount of oxygen used by micro-organism to decompose the organic matter. The average values of BOD 1.25 ± 0.14 mg/l in winter, 1.53 ± 0.06 mg/l in summer, and 2.14 ± 0.03 mg/l in monsoon season were recorded. Gupta et al. (Citation2017) found the range of BOD 0.35–2.18 mg/l of the Narmada River and Kumar et al. (Citation2018) also observed the BOD (2.46–4.76 mg/l) of the Ganga River during Kanwar Mela.
Alkalinity is present in water due to the various hydroxides, bicarbonates, carbonates, and it is the capability of an aqueous solution to neutralize an acid. The Alkalinity values fall between 82.25 ± 3.86 to 90.85 ± 15.4 mg/l for the selected sites. The average value of alkalinity 88.30 ± 1.70 mg/l in summer, 84.45 ± 2.59 mg/l in winter, and 89.41 ± 1.26 mg/l for monsoon season were found. In all the season, the value of alkalinity was found within the permissible limit (120 mg/l) of BIS. Chandra, Gupta, and Pandey (Citation2011) were recorded a similar range of total alkalinity in river Tam-Ganga at Bareilly.
The hardness is caused primarily by the presence of cations such as calcium and magnesium and anions such as carbonates, bicarbonates, and chloride in water. Water hardness has known adverse effects. Some researchers Mitra, Pal, and Das (Citation2018); Sengupta (Citation2013); Bellizzi et al. (Citation1999) and Comstock (Citation1979) reported in their studies, at different geographical location, if a man consume 2 l/day water which hardness is 150–300 mg/l and above may cause kidney problems and stone formation and also indicates its role in heart diseases. The values of hardness 134.4 ± 2.31 mg/l, 127 ± 1.59 mg/l, and 129.07 ± 1.12 mg/l in summer, winter, and monsoon season were recorded, respectively. Pathak, Prasad, and Pathak (Citation2015) observed the total hardness 85.46 mg/l in the summer season, 108.79 mg/l in the rainy season and 95.62 mg/l in the winter season of Bhagirathi River. Bora and Goswami (Citation2017) observed the hardness 52–296 mg/l in three different seasons and conclude that the water of the Kolong river falls under moderate to hard water category.
Sodium is the most important elements and is present in natural water. In this study, sodium was found to be in the range 2.90 ± 0.14 to 4.35 ± 0.9 mg/l for the selected sites. The average values of sodium (3.34 ± 0.13 mg/l) in winter, (3.12 ± 0.16 mg/l) in summer, and (4.21 ± 0.13 mg/l) in monsoon season were recorded. Kamboj et al. (Citation2016) reported the value of sodium varies 3.5 mg/l–6.4 mg/l at different ritual bathing sites of Ganga River. Garizi, Sheikh, and Sadoddin (Citation2011) reported the range of sodium 0.10–6.60 mg/l in surface water of Chehelchay watershed in the northeast of Iran.
Potassium is an essential element for human and plant nutrition. In this study, the average values of potassium 2.21 ± 0.21 mg/l in winter, 1.86 ± 0.09 mg/l in summer, and 2.48 ± 0.07 mg/l in monsoon were recorded. Kamboj, Aswal, Singh, and Dobhal (Citation2018) reported the evaluation of physicochemical characteristics of the Ganga canal and found the value of potassium 0.014–1.876 mg/l at different sites of the Ganga canal.
Calcium is an important element to develop proper bone growth. Calcium content is very common in all sources of water because they are available in most of the rocks abundant and also due to its higher solubility. The permissible limit of calcium is 75 mg/l. The average values of calcium 66.62 ± 1.02 mg/l, 61.45 ± 0.74 mg/l, and 63.28 ± 0.28 mg/l in summer, winter and monsoon seasons were recorded, respectively. Kamboj and Aswal (Citation2015) observed the calcium 28 mg/l to 31.9 mg/l of the Ganga canal water. Bhutiani, Ahamad, Tyagi, and Ram (Citation2018) observed the calcium hardness 111.00 to 125.8 mg/l of Malin River.
Magnesium usually occurs in lesser concentration than calcium due to the slow process of dissolution of magnesium-rich mineral and that of calcium is more abundant in the earth’s crust. The permissible limit of magnesium is 30 mg/l as per BIS standards. During the study, the value of magnesium falls between 17.54 ± 0.87 to 18.91 ± 2.25 mg/l for the selected sites. In different season viz. summer, winter, and monsoon, the average values of magnesium 18.57 ± 0.45 mg/l, 17.96 ± 0.34 mg/l, and 17.78 ± 0.10 mg/l were recorded, respectively. Kamboj and Aswal (Citation2015) observed the magnesium value 7.84–8.9 mg/l of the Ganga canal.
WQI analysis
For this study, OIPwas used for calculation of Water Quality Indexing (WQI). For this WQI, a total of 10 analyzed physicochemical parameters viz. pH, electrical conductivity, turbidity, TDS, DO, BOD, total hardness, calcium, magnesium, and alkalinity were selected to assess the quality status of the Ganga River in three different seasons (summer, winter, and monsoon) at selected sites. The water quality status and classification of water quality in OIP was described in and . The OIP value of all the sampling sites for each season of selected physicochemical parameters was presented in tabular form viz. –. The OIP scores showed that turbidity was highest influencing parameters at all the sampling sites (–).
Table 5. Standard of the parameters used for WQI.
Table 6. Calculation of OIP at near Bairaagi camp (S1).
Table 7. Calculation of OIP at near Shyampur Village (S2).
Table 8. Calculation of OIP at near Kangri Village (S3).
Table 9. Calculation of OIP at near Bisanpur Village (S4).
Table 10. Calculation of OIP at near Bhogpur Village (S5).
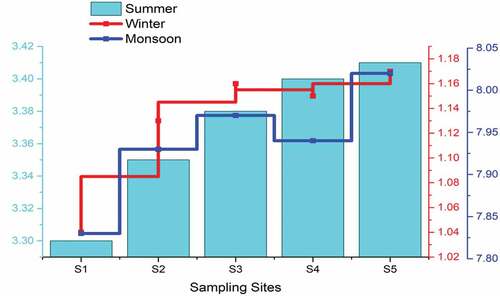
The summary of OIP values of water samples of selected five sampling sites for each season was mentioned in . The overall result shows the water quality status of Ganga River was excellent (1 < OIP < 1.9) in winter, acceptable (2 < OIP < 3.9) in summer, and slightly polluted (4 < OIP < 7.9) in monsoon season, respectively. According to OIP index score, the health status, in summer was acceptable at all the sampling sites with score S1 (3.30); S2 (3.35); S3 (3.38); S4 (3.40); S5 (3.41). In the winter season, the water quality was in excellent condition with a range of 1.04 (S1) to 1.17 (S5). In the summer and winter season, slight changes were found in the water quality of Ganga River at selected sampling sites. In S2, S3, S4, and S5, the riverbed mining activity was going on. Due to the removal of sediments from the bottom surface of the river, the temporary turbidity was increased and related parameters like TDS, conductivity also increased.
Table 11. Summary of OIP of the Ganga River.
The highest value of OIP recorded during monsoon season with values ranges from 7.83 at S1 to 8.02 at S5 with an average value of 7.94 ± 0.07 (). During monsoon, the health status of Ganga river water was slightly polluted. This may be due to the huge runoff of sediments, bank erosion and merging of waters from a different point (dumping of sewage water) and non-point sources (agricultural runoff). Some researchers were also showed the similar results of pollution level in monsoon season such as Bora and Goswami (Citation2017) in case of Kolong River, Jindal and Sharma (Citation2010) in Sutlej River, Gupta et al. (Citation2017) in Narmada River, Sebastian and Yamakanamardi (Citation2013) in Cauvery and Kapila River. Peck Yan and Rohasliney, (Citation2013) and Kondolf (Citation1997) also concluded that due to riverbed mining activity the turbidity level of water body was increased. The higher turbidity decreased the transparency of a water body which affects the primary productivity and fish population (Ambak & Zakaria, Citation2010; Krishnamoorthi et al., Citation2011; Prasanna & Ranjan, Citation2010). The OIP scores showed a mixed pattern of change in water quality in a different season ().
Figure 2. OIP rating of various sampling sites of Ganga River.
The overall summary of water quality of Ganga River was classified (class C2) in the summer, (class C1) in the winter, (class C3) in monsoon season at all the sampling sites. It clearly indicates the S1 was less polluted in comparison to S2–S5 sites in all the seasons. At all the sites only temporary turbidity was high due to some anthropogenic activities like riverbed mining, construction of river bank and other activities. Due to the instream mining at S2–S5, depth, and slope of the river at these sites increased, which show the high streamflow in that area. Shukla, Ojha, and Garg (Citation2017) studied the water quality status of Ganga River in different season by using OIP index and found that due to high stream flow, water quality was acceptable in summer and winter while polluted in monsoon season because of the runoff of a huge load of sediments, debris, bank erosion, and other. Bora and Goswami (Citation2017) also found that due to anthropogenic activity, the water quality of Kolong River falls under the good condition in post-monsoon (winter season), unsuitable for drinking in monsoon and poor quality in premonsoon (summer season).
Conclusion
The present study investigates the surface water quality of the Ganga River in the active riverbed mining area at district Haridwar. The study concluded on the basis of OIP scores and the value of OIP scores indicate the slightly polluted quality of water in monsoon season at all the sampling sites. While in summer season, OIP scores indicate acceptable water quality status and in winter season, it’s showed the excellent water quality Status of Ganga River. The water quality of the Ganga River recorded more polluted in monsoon season because of the high turbid runoff discharge in Ganga River as compared to summer and winter seasons. During the riverbed mining activity high temporary turbidity was noticed at the mining point in summer and winter seasons. The study revealed that water quality of Ganga River was found not suitable for drinking purpose in monsoon season, it can be suitable for irrigation purpose. In summer and winter season, water quality of Ganga River found to be suitable for irrigation as well as drinking purpose. The outcome of the present study need careful monitoring of the environmental aspects of a watershed especially in active riverbed mining area due to potential environmental risk.
Acknowledgments
The author thanks the Department of Science and Technology (DST), Government of India for financial support through INSPIRE program Grant number IF160805 and also thanks to the Department of Zoology and Environmental Science, Gurukula Kangri Vishwavidyalaya, Haridwar for providing all the facilities to carry out this study.
Disclosure statement
No potential conflict of interest was reported by the authors.
Additional information
Funding
References
- Ali, M. M., Ali, M. L., Islam, M. S., & Rahman, M. Z. (2016). Preliminary assessment of heavy metals in water and sediment of Karnaphuli River, Bangladesh. Environmental Nanotechnology, Monitoring & Management, 5, 27–35. doi:10.1016/j.enmm.2016.01.002
- Almeida, C., Gonzalez, S. O., Mallea, M., & Gonzalez, P. (2012). A recreational water quality index using chemical, physical and microbiological parameters. Environmental Science and Pollution Research International, 19(8), 3400–3411.
- Ambak, M. A., & Zakaria, M. Z. (2010). Freshwater fish diversity in Sungai Kelantan. Journal of Sustainability Science and Management, 5(1), 13–20.
- APHA, AWWA, WEF. (2012). The standard method for the examination of water and wastewater (22 ed.) Washington, DC. ISBN 978-087553-013-0.
- Asadi, S. S., Vuppala, P., & Anji, R. M. (2007). Remote sensing and GIS techniques for evaluation of groundwater quality in municipal corporation of Hyderabad (Zone-V), India. International Journal of Environmental Research and Public Health, 4(1), 45–52.
- Aswal, R. S., Singh, P., Kamboj, N., & Singh, R. (2016). Chemometric techniques: A comparative study of drinking water sources of Dehradun and Haridwar, Uttarakhand (India). Advances in Health and Environment, Safety Select Proceedings of HSFEA, 345–352. doi:10.1007/978-981-10-7122-5_33
- Bellizzi, V., Nicola, L. D., Minutolo, R., Russo, D., Cianciaruso, B., Andreucci, M., … Andreucci, V. E. (1999). Effects of water hardness on urinary risk factors for kidney stones in patients with idiopathic nephrolithiasis. Nephron, 81(1), 66–70.
- Bhattacharji, S., & Bandyopadhyay, R. (1995). Legends of Devi (pp. 54). India: Orient Blackswan.
- Bhutiani, R., Ahamad, F., Tyagi, V., & Ram, K. (2018). Evaluation of water quality of River Malin using water quality index (WQI) at Najibabad, Bijnor (UP) India. Environment Conservation Journal, 19(1&2), 191–201.
- Bora, M., & Goswami, D. C. (2017). Water quality assessment in terms of water quality index (WQI): Case study of the Kolong River, Assam, India. Applied Water Science, 7, 3125–3135. doi:10.1007/s13201-016-0451-y
- Brown, R. M., McClelland, N. I., Deininder, R. A., & Tozer, R. G. (1970). A water quality index- do we dare? Water Sewage Works, 117(10), 339–343.
- Bruns, D. A. 2005. Macroinvertibrate response to land cover, Habitat, and water chemistry in a a mining-impacted river ecosystem: A GIS watershed analysis. Aquatic Science, 67(4), 403–423. doi:10.1007/s00027-005-0792-3.
- Bureau of Indian Standards (BIS). (2012). Specification of drinking water. IS: 10500. New Delhi, India: Bureau of Indian standards.
- Chandra, R., Gupta, M., & Pandey, A. (2011). Monitoring of river TamGanga: Physic-chemical characteristic at Bareilly. Recent Research in Science and Technology, 3(6), 16–18.
- Chaturvedi, S. K., Kumar, D., & Singh, R. V. (2003). Study on some physico-chemical characteristics of following water of Ganga River at Haridwar. Research Journal of Chemistry and Environment, 7, 78–79.
- Comstock, G. W. (1979). Water hardness and cardiovascular diseases. American Journal of Epidemiology, 110(4), 375–400. doi:10.1093/oxfordjournals.aje.a112823
- Garg, S. K. (2006). Sewage disposal and air pollution engineering (Eighteenth revised ed.). India: Khanna Publishers.
- Garizi, A. Z., Sheikh, V., & Sadoddin, A. (2011). Assessment of seasonal variations of chemical characteristics in surface water using multivariate statistical methods. International Journal of Environmental Science and Technology, 8(3), 581–592.
- Ghalib, H., Yaqub, M., & Al-Abadi, A. (2019). Hydrogeochemical modeling and isotopic assessment of the quaternary aquifer at Ali al-Garbi Area in Misaan Governorate, South of Iraq. In Advances in Sustainable and Environmental Hydrology, Hydrogeology, Hydrochemistry and Water Resources, 121–124. doi:10.1007/978-3-030-01572-5_30
- Ghalib, H. B. (2017). Groundwater chemistry evaluation for drinking and irrigation utilities in east wasit province, Central Iraq. Applied Water Science, 7(7), 3447–3467. doi:10.1007/s13201-017-0575-8
- Ghalib, H. B., & Sogut, A. R. (2014). Environmental isotopic characterization of groundwater and surface water in Northeast Missan Province, South Iraq. ACGS Acta Geologica Sinica, 88(4), 1227–1238.
- Gupta, N., Pandey, P., & Hussain, J. (2017). Effect of physicochemical and biological parameters on the quality of river water of Narmada, Madhya Pradesh, India. Water Science, 31, 11–23. doi:10.1016/j.wsj.2017.03.002
- Hoseinzadeh, E., Khorsandi, H., Wei, C., & Alipour, M. (2014). Evaluation of aydughmush river water quality using the national sanitation foundation water quality index (NSFWQI), river pollution index (RPI), and forestry water quality index (FWQI). Desalination and Water Treatment, 54, 2994–3002.
- Jindal, R., & Sharma, C. (2010). Studies on water quality of Sutlej River around Ludhiana with reference to physicochemical parameters. Environmental Monitoring and Assessment, 174, 417–425. doi:10.1007/s10661-010-1466-8
- Kamboj, N., & Aswal, R. S. (2015). Suitability of Ganga Canal water for drinking purpose at Haridwar, Uttarakhand, India. Journal of Environmental and Applied Bioresearch, 3(3), 137–141.
- Kamboj, N., Aswal, R. S., Singh, P., & Dobhal, R. (2018). Evaluation of physico-chemical characteristics of Ganga canal at Haridwar. Asian Journal of Water, Environment and Pollution, 15(3), 125–133. 10:3233/AJW-180051
- Kamboj, N., Bharti, M., Kamboj, V., Rani, A., & Sharma, S. (2016). A comparative study of physico-chemical and bacteriological parameters of three different ritual bathing ghats of Ganga River in India. ESSENCE-International Journal for Environmental Rehabilitation and Conservation, 7(2), 46–52.
- Kamboj, N., Pandey, A., Shoaib, M., & Kumar, R. (2012). Environmental impact assessment of illegal Ganga mining at Kangri Village, District Haridwar (Uttarakhand) India. Journal of Sustainable Environmental Research, 1, 67–71.
- Kamboj, V., Kamboj, N., & Sharma, S. (2017). Environmental impact of riverbed mining-a review. International Journal of Scientific Research and Reviews, 7(1), 504–520.
- Kondolf, G. M. (1997). Hungry water: Effects of dams and gravel mining on river channels. Environmental Management, 21, 533–551.
- Krishnamoorthy, A., Senthil Elango, P., & Selvakumar, S. (2011). Investigation of water quality parameters for aquaculture- a case study of Veeranam lake in Cuddalore district, Tamilnadu. International Journal of Current Research, 3(3), 13–17.
- Kumar, M., & Bhushan, B. 2012. Assessment of water quality of river Ganga at shukratal in relation to portability norms. Bionano frontier, Eco revolution Colombo, Srilanka. ISSN 0974-0678.
- Kumar, V., Kumar, S., Srivastava, S., Singh, J., & Kumar, P. (2018). Water quality of River Ganga with reference to physico-chemical and microbiological characteristics during Kanwar Mela 2017 at Haridwar, India: A case study. Archives of Agriculture and Environmental Science, 3(1), 58–63. doi:10.26832/24566632.2018.030108
- Lal, D. (1977). The oceanic microcosm of particles. Science, 198, 997–1009.
- Meybeck, M. (1976). Total mineral transport by world major rivers. Hydrological Sciences Bulletin, 2, 265–284.
- Mitra, P., Pal, D. P., & Das, M. (2018). Does quality of drinking water matter in kidney stone disease: A study in West Bengal, India? Investigative and Clinical Urology, 59(3), 158–165. 10.4111/icu.2018.59.3.158
- Padmalal, D., & Maya, K. (2014). Sand mining. Environmental impacts and selected case studies. Environmental Science and Engineering, 1–161. doi:10.1007/978-94-017-9144-1
- Pathak, S. K., Prasad, S., & Pathak, T. (2015). Determination of water quality index river Bhagirathi in Uttarkashi, Uttarakhand, India. International Journal of Research Granthaalayah, 3(9), 1–7.
- Peck Yen, T., & Rohasliney, H. (2013). Status of water quality subject to sand mining in the Kelantan River, Kelantan. Tropical Life Science Research, 24(1), 19–34.
- Prasanna, M. B., & Ranjan, P. C. (2010). Physico-chemical properties of water collected from dharma estuary. International Journal of Environmental Sciences, 1(3), 334–343.
- Ridoutt, B. G., & Pfister, S. (2010). A revised approach to water foot printing to make transparent the impacts of consumption and production on global freshwater scarcity. Global Environmental Change, 20(1), 113–120. doi:10.1016/j.gloenvcha.2009.08.003
- Sargaonkar, A., & Deshpande, V. (2003). Development of an overall index of pollution for surface water based on a general classification scheme in Indian context. Environmental Monitoring and Assessment, 89, 43–67.
- Sebastian, K. J., & Yamakanamardi, S. M. (2013). Assessment of water quality index of Cauvery and Kapila River and their confluence. International Journal of Lakes and Rivers, 1, 59–67.
- Sengupta, P. (2013). Potential health impacts of hard water. International Journal of Preventive Medicine, 4(8), 866–875.
- Sharma, S., Dixit, S., Jain, P., Shah, K. W., & Vishwakarma, R. (2008). Statistical evaluation of hydrobiological parameters of Narmada River water at Hoshangabad City, India. Environmental Monitoring and Assessment, 143, 195–202.
- Shukla, A. K., Ojha, C. S. P., & Garg, R. D. (2017). Application of overall index of pollution (OIP) for the assessment of the surface water quality in the upper Ganga river basin, India. Water Science and Technology Library, 135–149. doi:10.1007/978-3-319-55125-8_12
- Soucek, D. J., Cherry, D. S., & Zipper, C. E. (2003). Impacts of mine drainage and other nonpoint source pollutants on aquatic biota in the upper Powell river system, Virginia. Human and Ecological Risk Assessment: an International Journal, 9(4), 1059–1073. 6.
- Sreebha, S., & Padmalal, D. (2011). Environmental impact assessment of sand mining from the small catchment rivers in the Southwestern Coast of India: A case study. Environmental Management, 47(1), 130–140. doi:10.1007/s00267-010-9571-6
- Sunil, C., Somashekar, R. K., & Nagaraja, B. C. (2010). Riparian vegetation assessment of Cauvery River basin of South India. Environment Monitoring Assessment, 170, 545–553.
- Trivedy, R. K., & Goel, P. K. (1986). Chemical and biological methods for water pollution studies. Carad, India: Environmental Publication.
- Upadhyay, A., & Chandrakala, M. (2014). Physico-chemical analysis of Kaveri River water in the pre-monsoon season in Karnataka, India. International Journal of Latest Technology in Engineering, Management & Applied Science, 3(9), 124–127.
- Verma, A. K., & Saksena, D. N. (2010). Impact of pollution on sewage collecting River Kalpi (Morar) Gwalior (M.P.) with special reference to water quality and Macro-zoobenthic fauna. Asian Journal of Experimental Biological Sciences, 1, 155–161.