
 ?Mathematical formulae have been encoded as MathML and are displayed in this HTML version using MathJax in order to improve their display. Uncheck the box to turn MathJax off. This feature requires Javascript. Click on a formula to zoom.
ABSTRACT
This research is aiming at simulating the effect of floating aquatic plants (FAP) in the drains, for best practice and adequate design, as a water quality treatment system. To achieve this objective, the field measurements of a pilot system that engineered to study the effect of FAP on water quality (WQ) of Emtdad Elumoum drain (EED) in the Western Nile Delta, has been studied. The EED with different FAP surface coverage is simulated using Qual2k model for their impact on the WQ of the drain. The Qual2K is used for simulation of different scenarios for EED with several bed widths assessing the impact of FAP on the drain WQ. In order to find out for the adequate In-stream Treatment System (ITS) design, curve fitting, and corresponding regression models have been developed for the most effective WQ improvement versus different drain dimensions. The developed regression models between the WQ variables and drain dimensions are following second-order polynomial model. Putting into mind the advantages and disadvantages of the FAP, the conclusion from this study brings simple design aspects for cost-effective technology for drain water treatment.
Introduction
As discussed in Mostafa, El-Gamal, and Shalby (Citation2005) and Achthoven, Merabet, Shalaby, and Van Steenbergen (Citation2004), Water assets in Egypt ended up naturally scarcer as of last decades, because of expansion in the land development and expanded populace that deficiency fresh water at some channels. Accordingly, agriculturists found that the best way to recompense their water requirements is the adjacent drain water. They started to lift drainage water to their fields disregarding irrigation and drainage laws, and ignoring the indicators of the marginal quality water. This raises the need to utilize an ease in-stream treatment system that treats this marginal deplete water. The in-stream treatment system transfer on the natural processes comes about considerable improve in the downstream water quality (WQ).
The removal of nutrients using Eichhornia Crassipes (ECr) has great concern from the research communities since several decades such in Scheffield (Citation1967), Cornwell, Zoltec, Patrinely, Furman, and Kim (Citation1977) and Wolverton and McDonald (Citation1978). However, Wolverton and McDonald (Citation1978) is concluded that water hyacinths grown in enriched mediums, such as sewage ponds, could potentially serve as nutrient source. Moreover, McDonald and Wolverton(Citation1980) conducted 3 year research on an existing, one-cell, facultative sewage lagoon with and without water hyacinth and concluded that the existence of the water hyacinth has a potential removal of biological oxygen demand (BOD) and total suspended solids (TSS). In recent years, Researchers as Fang et al. (Citation2007) and Yi, Kim, and Tateda (Citation2009) evaluate nitrogen reduction in water hyacinth ponds. In context, Olukanni and Kokumo (Citation2013) conclude that Constructed Wetland with water hyacinth plant is capable of removing pollutants and they are able to survive in high concentration of nutrients.
In addition, several studies experienced the use of ECr in improving the water quality of wastewater as furnished in Olukanni and Kokumo (Citation2013) that assess the efficiency of ECr in water treatment and, Nesic and Jovanovic (Citation1996) that evaluate the potential use of ECr for Wastewater Treatment in Serbia through comparison of results obtained from various studies. In addition, Jianbo, Zhihui, and Zhaozheng (Citation2008) conclude that water hyacinth system was effective in treating wastewater from an intensive duck farm during the water hyacinth growing season. Moreover, Hermosillo and Sarquis (Citation1990) assess the maximum permitted organic load in the ECr treatment system and conclude that for efficient use of water hyacinth ponds for nutrient removal they must be designed as maturation ponds.
Some studies focused on specific water quality parameters as Priya and Selvan (Citation2017) who conclude that water hyacinth has high removal rates for various dyestuffs and heavy metals like iron (Fe), zinc (Zn), copper (Cu), chromium (Cr), cadmium (Cd), manganese (Mn), mercury (Hg), and arsenic (As) from aqueous solutions. In addition, Adewumi and Ogbiye (Citation2009) whom conclude that ECr is capable of limited treatment of waste water containing volatile organic solids, dissolved iron, and heavy metals. In addition, Moyo, Chapungu, and Mudzengi (Citation2013) present evidence showing that ECr could be remediating the river based on statistically significant reduction of sulfates, total dissolved solids, electrical conductivity, phosphates, and total hardness.
In the other hand, Sullivan and Wood (Citation2012) highlighted on the main disadvantage of the Eichhornia Crassipes, as a highly aggressive weed that has degraded aquatic ecosystems as it grows rapidly and one plant can produce thousands of long-lived seeds. Navarro and Phiri (Citation2000) edited a proceeding which includes the origin and nature, spread and consequences, and the methods for handling the water-hyacinth problem. They point out that ECr, in Lake Victoria, had negative impacts on fisheries and fish-related commercial activities; the efficiency of irrigation canals, navigation, and water transport; hydroelectricity generation; and water-storage capacity.
Simulation of the existence of FAP in the natural stream put a concern on the simple but effective model that can carry out such simulation process. One of the models, that can simulate the water quality in the natural streams, is the QUAL2K. According to the user manual (Chapra, Pelletier, & Tao, Citation2012) and (Brown & Barnwell, Citation1987), QUAL2K (or Q2K) is a river and stream water quality model. QUAL2K is neither a stochastic nor dynamic simulation model. It is a one-dimensional, steady-state model of water quality and in-stream flow. It assumes fully mixed water in both vertical and horizontal directions. Likewise, it based on the equation of mass balance for the likely substances; however, it based on the decay rate equation for the biological substances. The QUAL2K model can simulate up to 16 water quality indicators along a river and its tributaries and is suitable for modeling pollutants in freshwater that rely on sediment interactions, especially as a sink of inorganic and organic substances.
For all WQ constituents, but the bottom algae, a general mass balance for a constituent in a reach is calculated mathematically as indicated in EquationEquation (1)(1)
(1) and, the external load is computed as in the EquationEquation (2)
(2)
(2) . The physical processes included in the mass balance calculations of the water quality model qual2K are illustrated in .
Figure 1. Mass balance in the Qual2K model.
Where E’ is the bulk dispersion coefficient, Wi = the external loading of the constituent to reach i [g/d or mg/d], and Si = sources and sinks of the constituent due to reactions and mass transfer mechanisms [g/m3/d or mg/m3/d].
Where; Cps,i,j i,j is the jth point source concentration for reach i [mg/L or μg/L], and Cnps,i,j i,j is the jth nonpoint source concentration for reach i [mg/L or μg/L].
Chapra and Canale (Citation2010) defined the water quality mathematical model as an idealized formulation that represents the response of aquatic ecosystems to external pollution sources. They are designed to simulate/compute quality in the receiving water as a function of pollutant effluents to explain and predict the effect of the neighboring activities on water recourses.
The objective of this research is to simulate the floating aquatic plants (i.e. Eichhornia Crassipes) in the drains, for best practice and adequate design, as water quality treatment system under the Egyptian environments. To achieve this objective, the field measurements of a pilot system, that engineered to investigate the effect of FAP on water quality of Emtdad Elumum drain (EED) in the Western Delta of the River Nile with different FAP surface coverage, is simulated with the water quality model Qual2k for their impact on the WQ of the drain for adequate design. The WQ model Qual2K is used for the simulating of different scenarios for EED with different drain dimensions for evaluating the impact of FAP on the drain WQ. Then and for the adequate In-stream Treatment System (ITS) design, curve fitting, and regression models have been developed for the most effective design that improve WQ of EED. The statistical models developed between WQ variables and different simulated drain dimensions. The developed regression models between the WQ variables and drain dimensions are following second-order polynomial model. The results designate several enhancement levels in WQ of the investigated drain based on the different applied scenarios. The most effective drain dimension determined at the vertex of the statistically developed curves of the models between WQ and drain dimensions.
Methodology
Study area
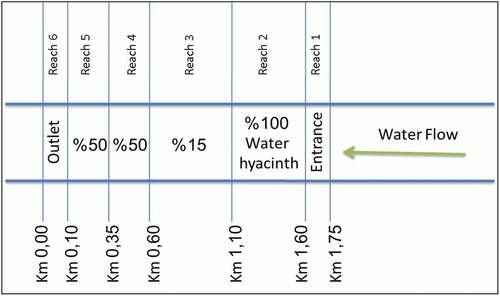
The study area was engineered at emtedad elumoum drain (EED) in the western delta of Egypt during a research study had been conducted by the Channel Maintenance Research Institute of the National Water Research Center (NWRC) of Egypt. Abou El Ella (Citation2014) gives a description of the drain pilot area and the conducted field measurements that have been used as base for this research. The pilot drain, Emtdad Elumum, is located in western delta of the Nile River between Edko drain to east and Nubaria canal to west. It flows for about seven kilometers as the most upstream of main Umum drain. The drain average bed width is about 17 m. Drainage depth in the selected drain is greater than 3.4 m, which allows for using the drain an In-stream water body. Either Industrial wastewater or solid wastes were noticed along the drain, since no industrial activities are in the area. The drain contains mainly agricultural drainage water from the outlets of subsurface drainage collectors besides, some municipal wastewater from individual households, and sanitation dump trucks. During the study period, no Industrial wastewater or solid wastes were observed along the drain. Water hyacinth exists naturally in the drain stream.
The in-stream treatment system using ECr can be effectively used to improve drain water quality, hence support the drain water reuse, and protect environmental and human health. The experimental challenge is to develop a low-cost treatment technology that effectively improves polluted drain water. So in-stream treatment systems are engineered to utilize the natural aquaculture processes including water vegetation to assist in improving drain water. The barrier units had been designed and constructed in cells shape as shown in to suite its purpose, preventing weeds from passing out pilot area. The pilot site is 1000 m reach of the drain that is originally partially covered with floating aquatic plants (i.e. Eichornia Crassipes).
Figure 2. Pilot area layout presented for Qual2k.
As presented in Abou El Ella (Citation2014), water quality samples were collected from the ITS over 12-month period between March 2011 and February 2012. Physical and chemical water parameters including turbidity, electrical conductivity (EC), total dissolved solids (TDS), TSS, dissolved oxygen (DO), ammonia (NH4-N), nitrate (NO3-N), soluble phosphate PO4 (filterable), BOD, chemical oxygen demand (COD), fecal coliform, and heavy metal (Cu, Zn, Mn, Fe, and Cd) were analyzed using standard methods of American Public Health Association [APHA] (Citation2005). Five water quality parameters out the mentioned were used for this research namely; DO, NH4-N, NO3-N, BOD, and FC.
Experiment simulation
The simulation process starts with the questions to be investigated using the model and the available data. Input data are the basis of the mathematical modeling; however, assumptions are made when some data are not available.
For Qual2k, arbitrary cross sections were applied, as the model only requires the canal bed width and side slopes. The branch was divided into reaches (simulation segments) based on the variation in hydraulic characteristics of the drain.
The preparation and calibration of the model is an iterative process. After calibration and verification, the model can be used to test possible scenarios in the future. However, the results of the model should be carefully analyzed and discussed at all stages of the modeling process. In that context, the model is manually calibrated by fine-tuning the model to fit the results to the field-measured data. This was by adjusting the model kinetic parameters to obtain an optimal agreement between the model results and the field data. The field data set was theoretically as similar as to the field conditions of EED. The Q2K model was calibrated for BOD-DO relations tuning the degradation rates and reaeration then for Nutrients tuning content BOD (NBOD) and nitrification/denitrification coefficients.
After the calibration process, mathematical model comes to the post process of examining alternative scenarios to come out with the best applications that give the best results based on the assumptions that determined by changing some dimensional characteristics or hydraulic of the watercourse or even physical and chemical properties of water quality. In our case we are talking about some scenarios were applied to dimensions of the waterway, which gives direct effect on water quality.
The average bed width (bw) of the watercourse that used in the mathematical model is 17 m in the base case which was calibrated on the data of May 2011. Then proposed scenarios were applied on the verification case of July 2011. Four scenarios were simulated investigating the impact of FAP on water quality changing the hydraulic characteristics of the watercourse. The Four scenarios of different bed widths of the watercourse are 30 m, 50 m, 70 m, and 90 m. In order to understand the effect of the drain dimensions on the treatment system performance and efficiency, group of equations has been developed using the curve fitting technique under statistical package.
Development of statistical models
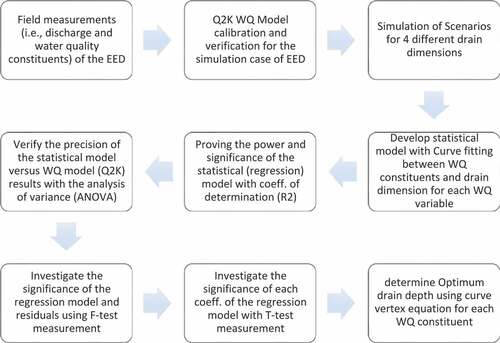
The relationship between hydraulic characteristics and water quality has been investigated in developing statistical regression models. In order to develop regression models for the adequate design of the ITS, the SPSS statistical package used for best curve fitting and evaluation of the developed statistical models. For each regression model, the coefficient of determination has been statistically evaluated for the adjusted square and their standard error of the estimate that is a measure of the accuracy of predictions. Then the analysis of variance ANOVA has been computed and evaluated for each model. The ANOVA is applied to validate the significance of the regression models and residuals from WQ model results. Then the significance of each coefficient in the model has been statistically evaluated to ensure the robust of the correlation between the drain water quality and dimensional characteristics. The framework for the mathematical and statistical modeling and verification of the regression models are itemized successively in .
Figure 3. Methodology framework for optimum ITS design.
Results and discussion
Model calibration and verification
The Qual2k model has been calibrated for selective water quality variables (i.e. EC, DO, BOD, NH4, NO3, and FC) over the simulated case of Emtedad Elumoum drain. As for the Ammonia and Nitrates, the complexity of the nitrogen cycle and its impact on decaying vegetation and algae life makes the calibration process very complex. The nitrogen cycle begins with nitrogenous organic compounds then converted to Ammonia that nitrified to Nitrate. The Nitrate denitrified to Nitrite that increase DO in water that is consumed in the process of respiration of aquatic algae.
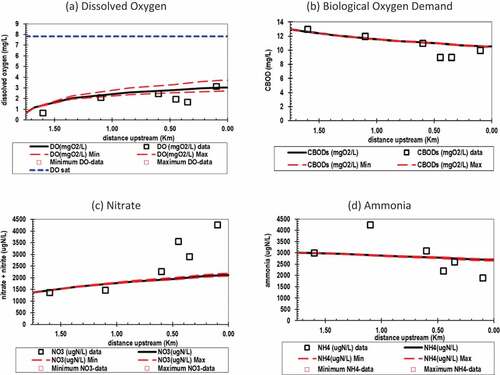
The calibration was applied using the field data collected during May 2011 and shows a good agreement between simulated and measured data. shows the simulated results versus the field observed data for the calibration case that typically agree with each other. The Qual2k model has been verified for the selective water quality variables over the simulated case of Emedad Elumoum drain. The verification was applied using the field data collected during July 2011 as seen in .
Figure 4. Model calibration for the base case during May 2011.
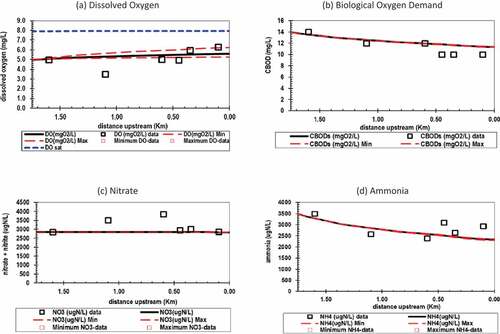
Figure 5. Model verification for the base case during July 2011.
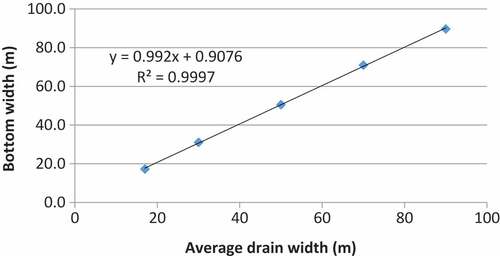
Typically, in the waterways of the trapezoidal cross section, the average drain width is at the half water depth and computed by dividing the cross sectional area by the water depth. For EED the relationship between the cross sectional area and water depth and, this between drain average width and bottom width is illustrated in and , respectively. Since the cross section of the drain is almost typically trapezoidal, the regression equation between the cross sectional area and the water depth has a coefficient of determination very close to unity (). In addition, the relationship between the bottom width and the average drain width is identically linear with a coefficient of determination of almost unity () since the side slopes of the drain are have a slight variance between 1.1 and 1.24 horizontal to 1 vertical.
Figure 6. Relationship between sectional area and water depth of the drain.
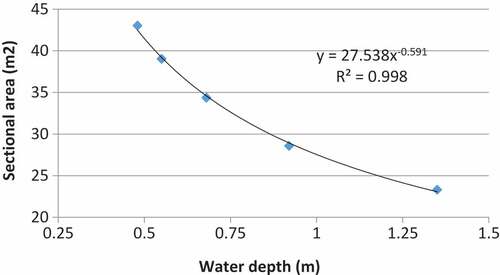
Figure 7. Relationship between bottom and average drain widths of the drain.
demonstrates the hydraulic characteristics of the EED for the different simulated scenarios where are the actions on water depth, velocity, and bed width. Subsequently, increasing the bed width led to reduce water depth and decrease water velocity. , , and, show effect of applied scenarios on water quality for 100%, 15%, and 50% (i.e. first, middle, and end FAP covered reaches of the experiment, respectively) of FAP drain coverage respectively. Conversely, the water depth and velocity are correlated linearly with the bed width; it was obvious, from the results, that the increase in bed width has no linear correlation with the water quality parameters (i.e. DO, BOD, NH4, NO3, and FC).
Table 1. Hydraulic characteristics of the Emtedad Elumoum for different scenarios.
Table 2. Water quality at the 100% FAP covered reach for different scenarios.
Table 3. Water quality at the 15% FAP covered reach for different scenarios.
Table 4. Water quality at the 50% FAP covered reach for different scenarios.
Developed statistical models
and show comparisons of water quality (i.e. oxygen budget and nutrients) in the drain for the months May, and July 2011 according to the mathematical model outputs. The results show DO and BOD are affected by normal weather improvement and especially the air temperature and reaeration that affect DO saturation value in the water.
Table 5. Model output of WQ for May 2011.
Table 6. Model output of WQ for July 2011.
As demonstrated in and , the increase in nitrate component, which is a benefit to the water quality of the watercourse, is less than Egyptian environmental law 48 of 1982 guidelines that limits the value of nitrates allowed by 45 mg/l. As shown in and , there is an increase in inorganic phosphate of watercourse spatially throughout the experiment.
Throughout the mathematical model results for some water quality elements, there is a relationship between the water quality and the waterway dimensions indicated in cross sectional area and water depth. The simulation results of the verification case were used to develop the curve that best fitting the water quality versus the drain dimensions.
– show the relationship between the six water quality constituents of the waterway and, the cross section area by the water depth. The influence of drain dimension on the water quality for the DO and the BOD is illustrated in , respectively. For all WQ parameters, the relationship follows a polynomial equation of the second order in quadratic form (i.e. ).
Figure 8. Effect of drain dimension on the DO and BOD in the treatment system.
Figure 9. Effect of drain dimension on the Ammonia and Nitrate in the treatment system.
Figure 10. Effect of drain dimension on the inorganic phosphorus and fecal coliform in the treatment system.
The relationship between the water quality variables and dimensions of the watercourse follow quadratic statistical models through which the optimal hydraulics design can be chosen. For the polynomial equation of the second order, the vertex is at that present the minimum or maximum value depending on curve convex trend. The vertex of the quadratic equation presents the optimal value in the estimated regression models. The following equations (i.e. EquationEquations (3–8)
(3)
(3) ) described the mathematical formulation of the relationship between each water quality variable and the drain dimensions.
Where;
X = cross sectional area (m2)/water depth (m)
For the DO the wider the water stream the better the reaeration process and hence the oxygen content in the water column; however, the shallower of the water stream increase the possibility of merged plants respiration leading to oxygen depletion. In the other hand, the decrease in the water depth lead to decline flow velocity and increase water temperature, which negatively affect the oxygen content. Following the oxygen trend, the BOD and NH4 are very regress to the oxygen content in the water column.
In case of nitrates, which increase the value added to the water quality and as the limits of environmental Law 48 of the year 1982 for nitrates is 45 mg/l, the estimated equation describe the relationship between Nitrate and drain morphology as in ) gives the optimum value at the most peak value of the curve.
illustrates the coefficient of determination for the estimated quadratic models addressed for each water quality parameter. All the equations show highly correlated relationship between the drain dimensions and the water quality parameters with high determination factor and relatively very low standard error. The closer of the adjusted R square to the unity prove the best curve fitting from the data and the strong regression between the dependent (i.e. water quality) and independent (i.e. stream dimension) variables. In that context, the resulted R2 prove the strong regression between the water quality and the drain dimensions. Nevertheless, the regression model itself needs to be verified for its residuals to the WQ model results and for each coefficient in the regression statistical model.
Table 7. Coefficient of determination for the developed models.
shows the analysis of variance (ANOVA) statistical test between the quadratic regression model and QUAL2K output for different scenarios. The ANOVA test proves the significance of the model compared to the data from the water quality model for the different scenarios. The sum of squares for the residuals are relatively very low compared to those of the regression model indicating the high accuracy of the estimated quadratic models. The F value (in ) of one-way ANOVA measures the significance of the variance between the means of both field and computed data. The F value in the ANOVA test also determines the P value. The P value is the probability of getting a result at least as extreme as the one that was actually observed, given that the null hypothesis is true.
Table 8. ANOVA for quadratic regression models.
Referring to EquationEquations (3–8)(3)
(3) , shows the coefficients of the regression model terms and their significance. For all regression models, all the coefficients are significant with a low standard error. shows t statistic, which is the coefficient divided by its standard error. The t statistic compared to the Student’s t distribution to determine the P value measuring the significance of the coefficient.
Table 9. Statistical significance of the regression models.
presents the coefficients of the regression statistical models for different WQ parameters that estimated statistically and the corresponding optimum average drain width. The optimum average drain width is computed at the vertex (i.e. x = -b/2a) that present the minimum or maximum value depending on curve convex trend. The optimum drain widths for different WQ parameters are vary between 49.5 m in case of PO4 and 58.7 m in Case of FC with overall average of 51.7 m.
Table 10. The optimum drain width for different WQ parameters.
The average optimum drain width presents the overall average that obtained for all WQ regression models. As presented in , the overall average width is 51.7 m. Referring to equation in (i.e. y = 0.992 X + 0.9076), the optimal bottom width is 51.2 m with side slope of 2:3. Therefore, the decision for the optimal design of the in-stream treatment system results in the best balance between the general requirements and water quality variables and the extent of their divergence from environmental laws.
Conclusion
The use of Eichhornia Crassipes as instream treatment system for drain water have both advantages and disadvantages contemplations. The use of them is a managing decision that depends on the balance in-between the benefit of water quality improvement and water quantity loss by plant evapotranspiration. In that context, this study verified that there is a robust relationship between Emtedad Elumoum drain water quality in one side and the dimensions of the drain in the other side by a means of regression model. The developed regression models are all second-degree polynomial (quadratic) equations. The developed models are proved statistically significant for all equations’ coefficients. Putting into thoughts the original bottom width of the drain (e.g. 17 m), The optimum drain widths, for best water quality improvement, are vary between 49.5 m for PO4 and 58.7 m for FC with overall average of 51.7 m. Therefore, the decision for the optimal design of the watercourse, which comes with best results, is balance between the general requirements and water quality variables and tolerance deviations from environmental laws.
Acknowledgments
The authors acknowledge the Channel Maintenance Research Institute of the National Water Research Center of Egypt for management of the fieldwork during of the research project including water sampling and discharge measurements.
References
- Abou El Ella, S. M. (2014). Improve the drainage water using in-stream wetland (case study)-Egypt. Natural Science, 12(6), 5–13.
- Achthoven, T. V., Merabet, Z., Shalaby, K., & Van Steenbergen, F. (2004). Balancing productivity and environmental pressure in Egypt (Agriculture and Rural Development Working Paper No. 13). World Bank.
- Adewumi, I., & Ogbiye, A. S. (2009). Using water hyacinth (Eichhornia crassipes) to treat wastewater of a residential institution. Toxicological & Environmental Chemistry, 91(5), 891–903.
- American Public Health Association. (Ed.). (2005). Standard methods for the examination of water and wastewater (21th ed.). New York, NY: Author.
- Brown, L. C., & Barnwell, T. O. (1987). The enhanced stream water quality models QUAL2E and QUAL2E-UNCAS: Documentation and user manual (Cooperative Agreement No. 811883). Environmental Research Laboratory, Office of Research and Development, U.S.EPA.
- Chapra, S. C., & Canale, R. P. (Ed.). (2010). Numerical methods for engineers: With software and programming applications (6th ed.). New York: McGraw-Hill.
- Chapra, S. C., Pelletier, G. J., & Tao, H. (2012). QUAL2K: A modeling framework for simulating river and stream water quality, version 2.12: Documentation and user’s manual. Medford, MA: Civil and Environmental Engineering Dept., Tufts University.
- Cornwell, D. A., Zoltec, J., Patrinely, C. D., Furman, T. S., & Kim, J. I. (1977). Nutrient removal by water hyacinths. Journal of the Water Pollution Control Federation, 70, 57–65.
- Fang, Y. Y., Yang, X. E., Chang, H. Q., Pu, P. M., Ding, X. F., & Rengel, Z. (2007). Phytoremediation of nitrogen-polluted water using water hyacinth. Journal of Plant Nutrition, 30(11), 1753–1765.
- Hermosillo, O. M., & Sarquis, S. (1990). Design considerations for waste water treatment with water hyacinth E. Crassipes. Environmental technology. Environmental Technology, 11(7), 669–674.
- Jianbo, L. U., Zhihui, F. U., & Zhaozheng, Y. I. N. (2008). Performance of a water hyacinth (Eichhornia crassipes) system in the treatment of wastewater from a duck farm and the effects of using water hyacinth as duck feed. Journal of Environmental Sciences, 20(5), 513–519.
- McDonald, R. C., & Wolverton, B. C. (1980). Comparative Study of Wastewater Lagoon with and without Water Hyacinth. Economic Botany, 34(2), 101–110.
- Mostafa, H., El-Gamal, F., & Shalby, A. (2005). Reuse of low quality water in Egypt (Non-conventional water use: WASAMED project Bari: CIHEAM/EU DG Research, (Options Méditerranéennes: Série B Etudes et Recherches, (53)), pp.93–103.
- Moyo, P., Chapungu, L., & Mudzengi, B. (2013). Effectiveness of water Hyacinth (Eichhornia crassipes) in remediating polluted water: The case of Shagashe River in Masvingo, Zimbabwe. Advances in Applied Science Research, 4(4), 55–62.
- Navarro, L., & Phiri, G. (2000). Water Hyacinth in Africa and the Middle East; a survey of problems and solutions. Canada: International Development Research Centre (IDRC.
- Nesic, N., & Jovanovic, L. (1996). Potential use of water hyacinth (E. crassipens) for wastewater treatment in Serbia. Journal of Wastewater Treatment, 13, 1–8.
- Olukanni, D. O., & Kokumo, K. O. (2013). Efficiency assessment of a constructed wetland using Eichhornia crassipes for wastewater treatment. American Journal of Engineering Research, 2(12), 450–454.
- Priya, E. S., & Selvan, P. S. (2017). Water hyacinth (Eichhornia crassipes)–An efficient and economic adsorbent for textile effluent treatment–A review. Arabian Journal of Chemistry, 10, S3548–S3558.
- Scheffield, C. W. (1967). Water hyacinth for nutrient removal. Hyacinth Control Journal, 6, 27–30.
- Sullivan, P. R., & Wood, R. (2012). Water hyacinth (Eichhornia crassipes (Mart.) Solms) seed longevity and the implications for management. In 18th Australasian Weeds Conference (pp. 37–40). Melbourne, Australia.
- Wolverton, B. C., & McDonald, R. C. (1978). Nutritional composition of water hyacinths grown on domestic sewage. Economic Botany, 32(4), 363–370.
- Yi, Q., Kim, Y., & Tateda, M. (2009). Evaluation of nitrogen reduction in water hyacinth ponds integrated with waste stabilization ponds. Desalination, 249(2), 528–534.