
 ?Mathematical formulae have been encoded as MathML and are displayed in this HTML version using MathJax in order to improve their display. Uncheck the box to turn MathJax off. This feature requires Javascript. Click on a formula to zoom.
Abstract
This study aimed to optimize nanosuspension of sorafenib tosylate (an anticancer hydrophobic drug molecule) using a central composite design. Nanosuspension was prepared using a nanoprecipitation-ultrasonication approach. FTIR and DSC analyses demonstrated that the drug and excipients were physicochemically compatible. X-ray powder diffraction analysis confirmed amorphous form of the payload in the formulation. The optimized formulation (batch NSS6) had a zeta potential of −18.1 mV, a polydispersity of 0.302, and a particle size of 97.11 nm. SEM analysis confirmed formation of rod-shaped particles. After 24 h, about 64.45% and 86.37% of the sorafenib tosylate was released in pH 6.8 and pH 1.2, respectively. The MTT assay was performed on HepG2 cell lines. IC50 value of the optimized batch was 39.4 µg/mL. The study concluded that sorafenib tosylate nanosuspension could be a promising approach in the treatment of hepatocellular cancer.
1. Introduction
Hepatocellular carcinoma (HCC) is the predominant form of primary liver cancer, accounting for over 90% of cases. This malignancy has emerged as a significant public health concern in the United States [Citation1,Citation2]. Despite the availability of radiation therapy, surgery, medical oncology, and interventional radiology, HCC is difficult to cure [Citation3,Citation4]. Sorafenib tosylate is an effective therapeutic regimen for patients with advanced HCC, including those who have progressed after locoregional treatment [Citation5]. Sorafenib tosylate is approved for the first-line treatment of liver cancer [Citation6]. Sorafenib tosylate effectively inhibits proliferation of tumour cell and tumour angiogenesis and promote programmed cell death. This is achieved by its specific targeting of the RAF/MEK/ERK and VEGF signalling pathways. Tumours exhibiting elevated levels of phosphorylated ERK (pERK) demonstrate enhanced sensitivity to sorafenib, suggesting that pERK has potential as a valuable biomarker in the treatment of HCC with sorafenib. Still, it has certain limitations, including a short half-life and poor water solubility. A significant recurrence rate results from liver cancer developing resistance to sorafenib tosylate and anti-angiogenic therapy. This highlights the critical need for cutting-edge approaches to addressing these challenges [Citation7–9].
Nanotechnology is widely regarded as a high-potential area for developing nanomedicine for cancer treatment [Citation10]. Nanomedicines possess unique features that increased solubility, allow for targeted distribution, and improved pharmacodynamic and pharmacokinetic properties [Citation11,Citation12]. Nanosuspensions are bicolloidal systems consisting of native drugs stabilized by surfactant/polymer in aqueous media. The nanosuspension increases solubility and bioavailability of poorly soluble drugs [Citation13]. Surfactants are crucial in developing a physically stable nanosuspension. The major role of surfactant is to thoroughly wet the drug particles and prevent agglomeration [Citation14,Citation15]. The selection of co-surfactant affects the crystalline behaviour, phase change, and internal phase uptake of nanosuspension. Nanosuspensions may provide benefits such as lowering the dose and cost of treatment, preventing dose dumping, limiting fluctuations in plasma levels, and reducing inter-subject variability. These benefits have accelerated the development of nanosuspension technology over the last few years [Citation16]. Improving the bioavailability of poorly water-soluble drugs is one of the distinctive benefits of nanosuspension technology [Citation13,Citation17]. The nanonization of drugs will cause them to adhere to the mucosa of the digestive tract, which increases the contact time of the drug and increases sorption. Thus, the reduction in particle size enhanced oral absorption drastically and contributed to the reduction in dose as compared to the classical delivery system [Citation18]. In the nanonization of nanosuspension, the nanoprecipitation method is simple to execute and quick in comparison to other methods. Thus, the formation of nanoparticles is instantaneous, and the entire procedure is completed in a single step. This method requires two miscible solvents. In the first system, the drug and polymer should ideally dissolve in the solvent. A nanosuspension can also be converted into solid form by using lyophilization or the spray drying technique [Citation19]. In nanosuspension preparation, several process parameters play a major role in determining stability and robustness. Thus, the experimental design can be used to determine the significant relationship between variables. Quality by design refers to the process of achieving a set of measurable characteristics in accordance with a set of predetermined criteria. When designing nanosuspensions, it is important to have a thorough understanding of interrelated factors and operational conditions [Citation20,Citation21]. Therefore, statistical tools aided in identifying the critical variables that can influence the nanosuspension formulation [Citation22].
Quality by design is a methodical approach to the design, development, and delivery of any pharmaceutical product or procedure with predetermined product specifications. Quality by design encompasses drug development and methodologies such as the design of experiments, risk assessment, and process analytical technologies. The design of experiments has been utilized as a potent strategy to reduce process variation and, ultimately, to produce high-quality products [Citation23]. It is the most effective design for studying the effect of various independent variables on formulation-dependent variables. Among various designs, central composite design is used in this study as it gives a second-order polynomial model. A central composite design is an essential component of response surface mythology. It is selected to perform the number of experiments necessary for the optimization of variables and responses [Citation24]. A box-Wilson design, also known as a ‘central composite design’, is made up of 2k factorial treatment designs with 2k additional treatment combinations referred to as axial points that are supplemented by a collection of ‘star points’ that allow curvature estimation [Citation25]. The rotatability property created for central composite design requires that the variance of predicted values be constant at sites equally far from the design centre [Citation26,Citation27]. The advantages of central composite design are its versatility, ability to explore and model nonlinear relationships between factors and responses, require fewer experiments, give enough information to estimate the main effects, interactions, and response surface curvature, aid in the estimation of curvature in received continuous responses, and consist of extreme factor combinations [Citation28]. The central composite design includes a centre point (replicated runs at the central location), which allows for estimating pure error and improving the precision of the estimated model coefficients. This leads to more reliable predictions and a better understanding of the relationships between factors and responses.
This study aimed to formulate and characterize sorafenib tosylate nanosuspension by varying co-surfactant and surfactant concentrations and sonication time. The prepared formulation was optimized by a central composite design. A central composite design was adopted to explore the effects of independent factors on formulation qualities with few experiment runs [Citation29]. The optimized nanosuspension was lyophilized for investigating FTIR spectroscopy, DSC, scanning electron microscopy, X-ray diffraction, cytotoxicity, and stability. In this study, soya lecithin was used as an amphiphilic surfactant to increase sorafenib tosylate penetration and enhance nanoparticle passage through the intestinal epithelium and into the circulation. Lecithin exhibits several notable chemical characteristics. It demonstrates a significant hydrophobic nature due to the presence of two fatty acid side chains. It displays strong lipophilicity, which can be attributed to its polar head groups that are highly hydrated. Lecithin maintains a delicate balance between hydrophilic and lipophilic properties, with a slight inclination towards the lipophilic side. Lecithin exhibits a pronounced tendency to form liquid crystal structures, primarily of the lamellar type. These inherent properties of lecithin facilitate its self-assembly into diverse structures, making it suitable for various pharmaceutical applications [Citation30]. As a co-surfactant, TPGS (d-tocopheryl poly(ethylene glycol)) downregulates P-glycoprotein (P-gp) expression, increases drug permeability through cell membranes, and reverses cancer cell multidrug resistance [Citation31]. Nanopreparations based on TPGS enhance the efficacy of chemotherapy in order to overcome multidrug resistance (MDR) [Citation32]. Drug delivery enhancers or solubilizers such as soy lecithin and TPGS have the ability to produce micelles or lipid-based nanostructures that encapsulate hydrophobic drugs like sorafenib, enhancing their transport and bioavailability in the body. This improved delivery may boost sorafenib concentration at the tumour location, leading to better therapeutic outcomes. Sorafenib-loaded lipid-based nanosuspension containing soya lecithin and Tween 80 has been regarded as safe and non-toxic within the range of 10–50 µg/mL. These formulations have good hemocompatibility [Citation33].
2. Materials and methods
2.1. Materials
Hetero Labs Limited (India) provided Sorafenib tosylate sample. Soya lecithin was obtained from HiMedia Laboratories Pvt. Ltd., Mumbai (India). PMC Isochem (France) provided D-α-tocopheryl polyethylene glycol 1000 succinate (TPGS) sample. Mannitol was purchased from HiMedia Pvt. Ltd., Mumbai (India). All analytical-grade reagents were used.
2.2. Methods
2.2.1. Preparation of nanosuspension
Nanosuspension was prepared using nanoprecipitation method, followed by sonication [Citation34,Citation35]. Briefly, sorafenib tosylate (200 mg) and soya lecithin (0.1–0.3% w/v) were dissolved in 2 mL of ethanol to form a non-aqueous phase. The prepared solution was injected into 50 mL of distilled water containing Vitamin E TPGS (0.1–0.3% w/v) under probe sonication (Sonics Vibra Cell, USA) to obtain nanodispersion. The obtained nanosuspension was magnetically stirred at 1000 rpm for 2 h at 25 °C to evaporate the organic solvent. The optimized nanosuspension was freeze-dried using mannitol as a lyoprotectant (0.5% w/v). To get the powder formulation, nanosuspension with cryoprotectants was immediately pre-frozen with liquid nitrogen and then freeze-dried overnight at −40 °C and pressure <1 mbar.
2.2.2. Optimization of sorafenib tosylate nanosuspension using the central composite design
The objective of employing a nonlinear quadratic polynomial model in the design of drug delivery systems is to get insight into the interaction and impact of several elements on the performance of developed system. Through the process of estimating the coefficients and conducting an analysis of the model, it becomes easy to discover the best circumstances or factor settings that result in the maximization or minimization of the dependent variable. This, in turn, facilitates the development of drug delivery systems that are more effective and efficient. The utilization of this modelling approach is an essential component within the framework of response surface methodology (RSM) and experimental design in the field of pharmaceutical research and development. The effects of independent variables (X1: soya lecithin concentration (% w/v), X2: TPGS concentration (% w/v), and X3: sonication time (min)) on dependent variables (drug content, zeta potential, particle size, entrapment efficiency, and drug release) was studied using a central composite design (CCD) (). This design is suitable for exploring quadratic response surfaces and developing second-order polynomial models. Using Design Expert Software (version 13.0, Stat-Ease Inc., Minneapolis, MN), a nonlinear quadratic polynomial model was developed for precise evaluation of the impact of independent factors on dependent variables. In the quadratic polynomial model, we primarily focus on the linear and quadratic terms. The term nonlinear indicates that the relationship between the independent factors and the dependent variable is not a simple, straight-line relationship.
Where Yi represents the level of response variable; βi represent the regression coefficient; the main effects are X1, X2, X3; interaction terms of the main effects are X1X2, X2X3, X1X3. Term X12, X22, and X32 are quadratic terms of the independent variables used to represent the curvature of the intended setting. The equation presented in this study provides a comprehensive and accurate representation of the interconnections between the independent variables and the dependent variable in the established framework. The provided equation facilitates the ability to make predictions or conduct analysis on the response variable (Yi) by considering the values of the independent variables (X1, X2, and X3) and their interactions. The estimation or analysis of the predicted value of Yi in this model can be conducted by substituting specific values for X1, X2, and X3. The acquisition of this knowledge holds significant value within the framework of optimizing procedures, improving resource utilization, and achieving desired outcomes in drug development processes. The model significance was calculated via a two-way analysis of variance using Design Expert. The F-test was used to analyze the differences between the regression mean square and the residual mean square.
Table 1. Central composite designed for optimization of sorafenib tosylate nanosuspension prepared by nanoprecipitation-sonication technique.
3. Evaluation of nanosuspension
3.1. Particle size, polydispersity index and zeta potential
The particle size and zeta potential were determined using a zetasizer (Nano-ZS, Malvern, UK) equipped with a hydro dispersion unit. The samples were appropriately diluted with Milli-Q water to obtain the desired particle count rate of 100–300 kcps. The Z-average for 64 runs per sample was estimated.
3.2. Drug content and entrapment efficiency
In this study, sorafenib tosylate was encapsulated in a nanosuspension formulation composed of soya lecithin (a mixture of phospholipids) and TPGS. The amount of unentrapped sorafenib tosylate was estimated to determine the entrapment efficiency of the nanosuspensions. The unentrapped drug was separated by centrifugation at 5,000 rpm for 20 min and sonication for 4 min. The supernatant was analyzed using high-performance liquid chromatography (HPLC) (Agilent Technologies 1260 Infinity, Germany), which consists of a stainless steel column with porous silica of 2.7 μm [Citation36,Citation37]. The mobile phase consisted of 50 volumes of buffer prepared by dissolving 1.36 g of potassium dihydrogen orthophosphate in 500 mL of water, pH adjusted to 3.0 with orthophosphoric acid, 5 volumes of tetrahydrofuran, and 45 volumes of acetonitrile. The flow rate of mobile phase was maintained at 1.5 mL/min. The samples were analyzed in triplicate at 265 nm. Below are the equations used to calculate drug content [Citation38] and entrapment efficiency [Citation39]:
3.3. FTIR spectroscopy
The FTIR spectra of pure drug and optimized nanosuspension (lyophilized formulation NSS6) were recorded on ATR Alpha, Bruker, Germany, between 500 and 3500 cm−1.
3.4. Differential scanning calorimetry
Thermal analysis of pure drug and optimized nanosuspension (lyophilized formulation NSS6) was done using a differential scanning calorimeter (DSC) (Q10, TA Instruments Inc., New Castle, DE, USA). For instrument calibration, indium was used as a standard. The samples were kept in an insulated aluminium pan in a nitrogen environment (60 mL/min) and heated from 30 °C to 300 °C at a rate of 10 °C/min. An empty pan was utilized as a reference.
3.5. X-ray diffraction analysis
X-ray diffraction analysis of pure sorafenib tosylate and optimized formulation (lyophilized formulation NSS6) was done using a Rigaku Miniflex 600 X-ray diffractometer (Tokyo, Japan) at room temperature, 15 mA of current, and 40 kV of voltage.
3.6. Morphological characterization
Scanning electron microscopy (SEM, JSM 7610, JEOL, Japan) was used to examine the morphology of lyophilized nanosuspension. The sample was placed on two-sided carbon tape and sputtered with gold-palladium alloy, and photomicrographs were taken at high vacuum with a 20 kV voltage.
3.7. Determination of in vitro drug release
In vitro drug release from prepared nanosuspensions was accessed by dialysis bag diffusion technique in phosphate buffer (pH 6.8) and 0.1 N HCl (pH 1.2) [Citation40]. Briefly, nanosuspension (≈ 200 mg of pure drug) was taken in a cellulose dialysis bag (average diameter of 14.3 mm, average flat width of 24.26 mm, approximate capacity of 1.61 mL/cm). The bag was sealed at both ends and immersed in the USP dissolution apparatus II (Electrolab TrustE-08 Pvt. Ltd., India), which contained 900 mL of dissolution medium and rotated at 75 rpm at 37 ± 0.5 °C. Aliquots of 5 mL were withdrawn at predetermined intervals up to 24 h. A similar volume was replaced with the fresh medium. The amount of drug released as a function of time was determined at 265 nm using an HPLC system (Agilent Technologies 1260 Infinity, Germany), which consists of a stainless steel column with porous silica of 2.7 µm.
In vitro drug release study data was fitted into kinetic equations (zero-order, first-order, Korsemeyer-Peppas’ model, and Higuchi’s model) to better understand the kinetics and mechanism of drug release from the optimized nanosuspension formulation. The value of the regression coefficient (r2) was used to confirm the release mechanism. The in vitro release profile of sorafenib tosylate from optimized nanosuspension (formulation NSS6) was compared with the marketed formulation (Soranib, Cipla, India).
3.8. Stability studies
Stability studies play an important role in determining the safety and efficacy of pharmaceutical formulations. Lyophilized sorafenib tosylate nanosuspension and colloidal nanosuspension were subjected to stability assessment at different storage condition, such as room temperature (25 ± 2 °C/60 ± 5% RH), freezing temperature (4 ± 1 °C) and accelerated condition (45 ± 2 °C/75 ± 5% RH) for 3 months [Citation41]. The lyophilized formulation was dispersed in sufficient amount of water and analyzed for particle size and zeta potential. Particle size and zeta potential were also determined for colloidal nanosuspension [Citation42].
3.9. Cytotoxicity studies
3.9.1. Cell culture preparation
HepG2 cells (ATCC® HB8065TM) were used for the cytotoxicity studies. Briefly, HepG2 cells rapidly defrosted to room temperature after being removed from liquid nitrogen storage. Complete culture medium (9 mL) was mixed with the contents of the vial before being centrifuged at 125 g for 5 min. The pellets were combined with 10 mL of complete DMEM medium after centrifugation, suspended in a T25 flask, and incubated at 37 °C with 5% CO2 after the supernatant was discarded. The cells were detached using trypsin-EDTA and transferred to two T25 flasks. It was used for the assay when the cell confluency reached 80–90%.
3.9.2. MTT assay
The cell suspension (200 µL) was seeded on a 96-well plate without using a test agent and allowed to grow for 24 h. After 24 h, the media was replaced with an appropriate concentration of test compounds. Under a 5% CO2 atmosphere, it was incubated for 48 h at 37 °C. After incubation, the media was taken out and the MTT reagent was added to a final concentration of 0.5 mg/mL (through a sterilized 0.2 µm filter). To avoid light exposure, the plates were wrapped in aluminium foil before incubation for 3 h. DMSO (100 µL) was added to it, and the 3-(4,5-dimethythiazol-2-yl)-2,5-diphenyl tetrazolium bromide (MTT) reagent was removed after incubation. Absorbance was measured at 570 nm using a spectrophotometer (Tecan™ Infinite 200Pro) [Citation43,Citation44].
4. Results and discussion
4.1. Particle size and zeta potential
Singare et al. examined how polymer concentration and milling speed affect nanosuspension zeta potential. The study found that polymer concentration affected zeta potential more than surfactant concentration. Larger surfactant concentrations reduced steric hindrance between nanoparticles, resulting in smaller particles due to thicker coatings that increased stability [Citation45]. The lipophilic surfactant decreases particle size [Citation46]. In this study, the particle size, PDI, and zeta potential of sorafenib tosylate-loaded nanosuspension ranged from 97.11 nm to 324.7 nm, 0.286 to 1.00, and −18.8 mV to −6.4 mV, respectively. The optimized batch (formulation NSS6), which contained 0.3% soya lecithin and 0.1% TPGS and was sonicated for 5 min, showed the lowest particle size and highest zeta potential. Formulations containing a high concentration of surfactant and a low concentration of co-surfactant and sonicated for a long time had smallest particle size and highest zeta potential values ().
Table 2. Characterization of central composite designed sorafenib tosylate-loaded nanosuspension prepared by a nanoprecipitation followed by sonication technique.
4.2. Drug content and entrapment efficiency
The lipophilic surfactant has been reported to increase drug entrapment efficiency [Citation46]. Since TPGS is non-ionic and has hydrophilic and hydrophobic moieties, its nature maximizes drug entrapment efficiency. The mixture of lipids also increases drug entrapment [Citation47]. Agnihotri et al. reported a positive impact of surfactant concentration on the entrapment efficiency of nanosuspensions [Citation48]. Sorafenib tosylate content in the nanosuspension ranged from 48.39% to 75.03%, and the entrapment efficiency ranged from 58.86% to 81.44%. The optimized batch (formulation NSS6), containing the highest concentration of surfactant in combination with the lowest concentration of co-surfactant and proceeding at a high sonication time, had highest percentage of drug content and entrapment efficiency ().
4.3. FTIR spectrometry
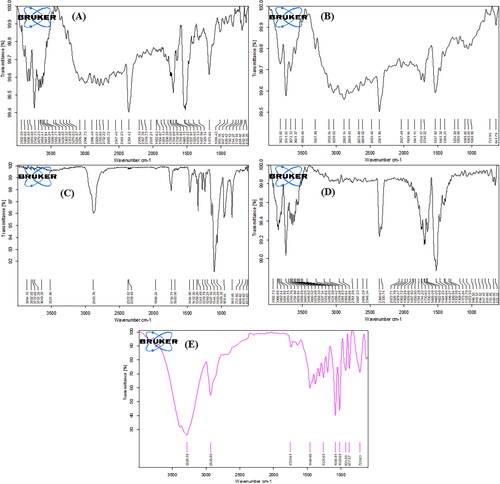
The sorafenib tosylate showed distinct bands at 3363.32 cm−1 (N-H stretching), 3076.54 cm−1 (-CH stretching), 1732.30 cm−1 (C = O uride), 1474.13 cm−1 (C-F), and 1325.14 cm−1 (S = O sulfonate) () [Citation49]. Soya lecithin showed peaks at 3039.03 cm−1, 2882.14 cm−1 (C-H stretching), 1746.17 cm−1 (ester C = O stretching), 1461.32 cm−1 (C–H bending vibration of methyl group), and 1254.58 cm−1 (P = O stretching vibration) () [Citation50]. TPGS showed peaks at 2883.76 cm−1 (aromatic C–H stretching vibration), 1735.71 cm−1 (C = O stretching), 1464.90 cm−1 (–CH2 bending vibration), and 1103.49 cm−1 (C–O stretching) () [Citation51]. The physical mixture showed peaks at 3295.42 cm−1 (-NH stretching), 3091.83 cm−1 (-CH stretching), 1733.63 cm−1 (C = O uride), 1468.64 cm−1 (C-F), and 1332.38 cm−1 (S = O sulfonate) (). The optimized lyophilized formulation showed all intense peaks of the drug at 3288.16 cm−1, 2935.80 cm−1, 1720.61 cm−1, 1460.96 cm−1, and 1321.65 cm−1. The result indicated no significant changes in the peak position or overlap of characteristic peaks and no appearance of distinct peaks in the spectra of an optimized formulation (). The drug was stable, with no chemical or molecular interaction between the drug and the other formulation ingredients.
Figure 1. FTIR spectrum of pure sorafenib tosylate (a), soyalecithin (B), Vit E TPGS (C), physical mixture (D), and optimized nanosuspension (formulation NSS6) (E).
4.4. Differential scanning calorimetry
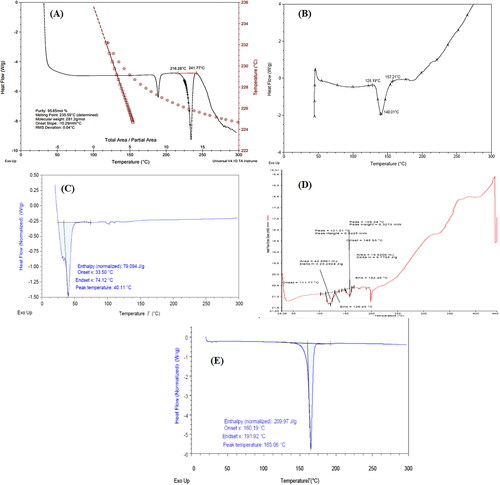
Thermal analysis of pure drug and optimized nanosuspension (formulation NSS6) was done to examine the differences in solid state. The exothermic peak at 235.59 °C in the thermogram of pure drug indicates its melting point (). Soya lecithin revealed a single endothermic melting peak at 140.01 °C (). However, a range of intricate endothermic peaks between 150 °C and 300 °C were identified by Marquele-Oliveira et al. due to the melting and degradation of the lecithin [Citation52]. The thermogram of TPGS revealed a single endothermic melting peak at 40.11 °C (), corresponding to the melting peak reported at 39.89 °C by Yang et al. [Citation53]. The melting temperature of mannitol, recorded at 162.5 °C, was distinctive, corresponding to the results obtained by Zhang et al. [Citation54]. The peak intensity in the thermogram of physical mixture was decreased due to the diluting effects of excipients on the payload (). However, due to the drug being trapped in the polymer matrix, the crystallinity of the formulation decreased, and no distinct peaks were observed in lyophilized formulation NSS6 () [Citation55,Citation56].
Figure 2. DSC thermogram of pure sorafenib tosylate (a), soyalecithin (B), TPGS (C), physical mixture (D), and optimized nanosuspension (formulation NSS6) (E).
4.5. X-ray diffractometery
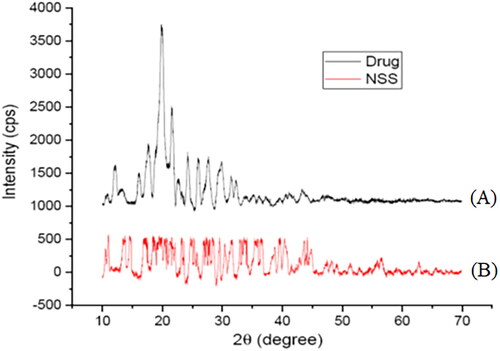
The X-ray crystallographic spectrum of pure sorafenib tosylate and the optimized batch are shown in . The intense peaks of pure sorafenib tosylate at 2θ of 13.1°, 17.9°, 18.4°, 19.92°, 20.74°, 21.58°, 22.8°, 23.22°, 24.2°, and 25.94° reveal its crystalline nature. The optimized batch (formulation NSS6) revealed amorphous nature of sorafenib tosylate (at least not at a higher percentage of crystalline form).
Figure 3. X-ray diffractogram of pure sorafenib tosylate (A) and optimized nanosuspension (formulation NSS6) (B).
4.6. Morphological characterization
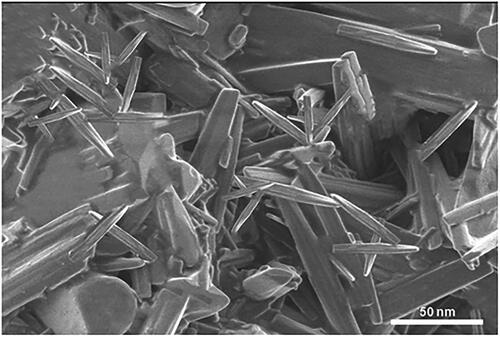
Rod-shaped particles in the nanometer range were recorded in the scanning electron micrograph of lyophilized sorafenib tosylate-loaded nanosuspension (formulation NSS6) () [Citation57]. This may be due to the presence of hydrophilic moieties with sufficient kinetic energy in soya lecithin and TPGS, which created a highly hydrophilic environment around particles, leading to prevent particle aggregation and promote segregation [Citation58,Citation59]. As a result, an amorphous layer formed on the surface of the inner crystals after surfactant lyophilization [Citation60].
Figure 4. Scanning electron microscopic image of optimized lyophilized nanosuspension (formulation NSS6).
4.7. Statistical approach of central composite design application
Using a central composite design, the effects of X1 (concentration of soya lecithin), X2 (concentration of TPGS), and X3 (sonication time) on zeta potential, particle size, entrapment efficiency, drug content, and drug release (at pH 1.2 and pH 6.8) were studied. The quadratic model was developed to assess the implications of the study. Following mathematical models are provided for parameter estimation:
The positive coefficients of Vit E TPGS concentration (X2) indicate that the particle size increases with an increase in Vit E TPGS concentration. The negative coefficients of soya lecithin concentration (X1) and sonication time (X3) indicate that particle size decreases with an increase in X1 and X3 concentrations, assuming all other variables are held constant. The negative coefficients of X1X2 and X1X3 suggest that the interaction between X1 and X2, and X1 and X3 has a negative effect on particle size (Y1). On the other side, the positive coefficient of X2X3 suggests that the interaction between X2 and X3 has a positive effect on particle size (Y1). The squared terms (X12, X22, and X32) account for potential non-linear relationships. For example, the coefficient of X12 (2.93) suggests that the relationship between X1 and Y1 is not purely linear; it may have a quadratic component. ANOVA was used to analyze the model fit. The F-value (4.98) and P-value (0.0169) confirmed model validity. The impact of main variables and interactive variables on particle size was investigated. The p-values of X1, X2, and X3 were 0.3226, 0.0122, and 0.0010, respectively. In this case, X2, X2X3, X12, X32 were significant model terms.
The positive coefficients of Vit E TPGS (X2) concentration indicated zeta potential increases with respect to the increase in the corresponding variable. The negative values of soya lecithin (X1) and sonication time (X3) showed that zeta potential decreased with respect to the decrease in the corresponding variables. The negative coefficient of X1X2, X1X3, and X2X3 suggests that the interaction between X1 and X2, X1 and X3, and X2 and X3 has a negative effect on zeta potential (Y2). The squared terms (X12, X22, and X32) account for potential non-linear relationships. For example, the coefficient of X12 (−0.0813) suggests that the relationship between X1 and Y2 is not purely linear; it may have a quadratic component. The F-value and P-value were 15.18 and 0.0004, respectively, indicating model significant. The p-values of X1, X2, and X3 were 0.7897, 0.0003, and < 0.0001, respectively.
The coefficient of Vit E TPGS concentration (X2) was negative, indicating that drug content increases with a decrease in Vit E TPGS concentration. Soya lecithin (X1) and sonication time (X3) concentrations had a positive impact on drug content. The positive coefficients of X1X2, X1X3, and X2X3 suggest that the interaction between X1 and X2, X1 and X3, and X2 and X3 has a positive effect on drug content (Y3). The squared terms (X12, X22, and X32) account for potential non-linear relationships. For example, the coefficient of X12 (0.6081) suggests that the relationship between X1 and Y3 is not purely linear; it may have a quadratic component. The model’s significance is indicated by an F-value of 3.96 and a P-value of 0.0329. The p-values of X1, X2, and X3 were found to be 0.1060, 0.0708, and 0.0021, respectively.
The negative coefficient of Vit E TPGS concentration (X2) indicated an increase in entrapment efficiency with respect to a decrease in the corresponding variable. The positive values of soya lecithin (X1) and sonication time (X3) confirmed increased entrapment efficiency with respect to the increase in the corresponding variables. The positive coefficient of X1X2, X1X3, and X2X3 suggests that the interaction between X1 and X2, X1 and X3, and X2 and X3 has a positive effect on entrapment efficiency (Y4). The coefficient of squared terms (X12, X22, and X32) suggests a non-linear relationship between the main effects (X1, X2, X3) and response variable (Y4); it may have a quadratic component. The F-value (5.77) and P-value (0.0108) indicated the significance of the tested model. The p-values of X1, X2, and X3 were found to be 0.1171, 0.0117, and 0.0008, respectively.
Negative coefficients of TPGS concentration (X2) indicate that the cumulative drug release in 0.1 N HCl decreases with an increase in the corresponding variable. The positive coefficients of soya lecithin (X1) and sonication time (X3) indicated an increase in drug release in acidic medium with an increase in the concentration of corresponding variables. The positive coefficients of X1X2, X1X3, and X2X3 suggest that the interaction between X1 and X2, X1 and X3, and X2 and X3 has a positive effect on drug release in 0.1 N HCl. The coefficient of squared terms (X12, X22, and X32) suggests a non-linear relationship between the main effects (X1, X2, X3) and the response variable (Y5). The F-value (4.28) and P-value (0.0263) indicate the significance of the tested model for cumulative drug release in 0.1 N HCl. The p-values of X1, X2, and X3 were 0.0465, 0.1685, and 0.0021, respectively.
Negative coefficients of TPGS concentration (X2) indicated that the cumulative drug release in phosphate buffer increased with a decrease in the corresponding variable. Cumulative drug release in phosphate buffer increased with an increase in soya lecithin (X1) and sonication time (X3) concentrations. The positive coefficients of X1X2 and X1X3 suggest that the interaction between X1 and X2, and X1 and X3 has a positive effect on drug release in phosphate buffer. On the other side, the negative coefficient of X2X3 suggests that the interaction between X2 and X3 has a negative effect on drug release in phosphate buffer. The squared terms (X12, X22, and X32) account for potential non-linear relationships. For example, the coefficient of X12 (1.60) suggests that the relationship between X1 and Y6 is not purely linear; it may have a quadratic component. The F-value (6.49) and P-value (0.0074) indicated a model fit for cumulative drug release in phosphate buffer. The p-values of X1, X2, and X3 were 0.0061, 0.8505, and 0.0010, respectively.
To determine the model’s significance, a two-way ANOVA was conducted using Design Expert software. The residual mean square and regression mean square were correlated using F-test. The pareto chart, contour plot, and 3D response surface plot represent the impact of various process variables on the response variables (). An analysis of variance was used on the response to examine the model’s fit and importance. The results indicated that the model was significant. Results of two-way ANOVA on particle size, zeta potential, drug content, entrapment efficiency, and drug release in pH 1.2 and 6.8 are shown in .
Figure 5. Particle size of formulation NSS6 (a), pareto chart represents particle size coefficients (b1, b2, b3 are main terms; b4, b5, b6 are interaction terms and b7, b8, b9 are square terms) (B), 3D response surface (C) and contour plot (D) showing impact of various process variables on particle size.
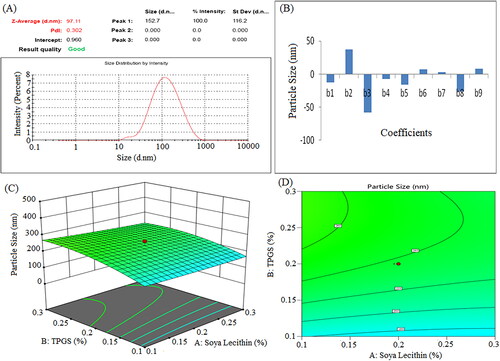
Figure 6. Zeta potential of formulation NSS6 (a), pareto chart represent coefficients of zeta potential (b1, b2, b3 are main terms; b4, b5, b6 are interaction terms and b7, b8, b9 are square terms) (B), 3D response surface plot (C) and contour plot (D) and showing impact of various process variables on zeta potential.
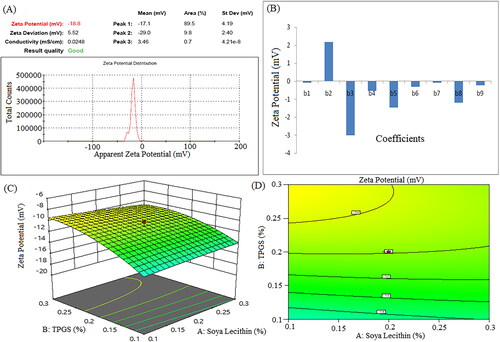
Figure 7. Pareto chart represent coefficients of drug content (b1, b2, b3 are main terms; b4, b5, b6 are interaction terms and b7, b8, b9 are square terms) (a), 3D response surface plot (B) and contour plot (C) showing impact of various process variables on drug content.
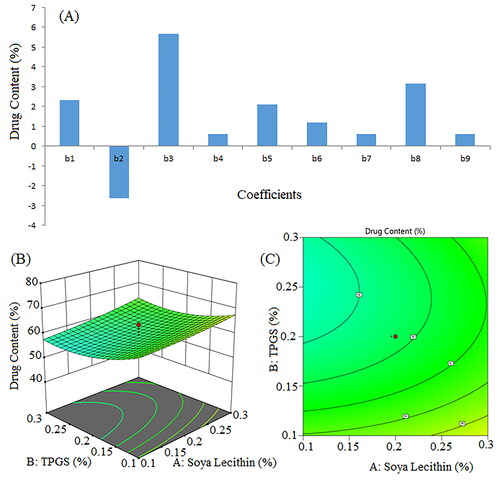
Figure 8. Pareto chart for coefficients of entrapment efficiency (b1, b2, b3 are main terms; b4, b5, b6 are interaction terms and b7, b8, b9 are square terms) (a), 3D response surface plot (B) and contour plot (C) illustrating the impact of various process variables on entrapment efficiency.
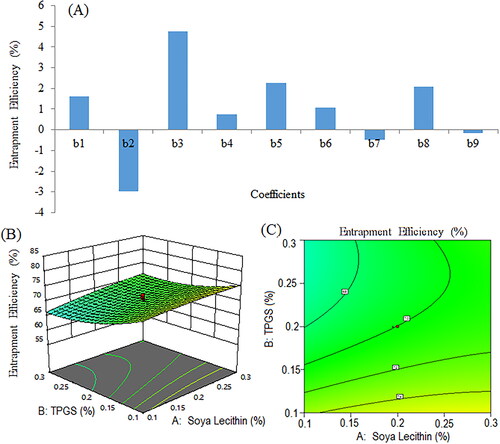
Figure 9. Pareto chart represents coefficients showing coefficients of percent cumulative drug release in 0.1 N HCl (pH 1.2) (b1, b2, b3 are main terms; b4, b5, b6 are interaction terms and b7, b8, b9 are square terms) (a), 3D response surface (B) and contour plot (C) and showing impact of various process variables on percent cumulative drug release.
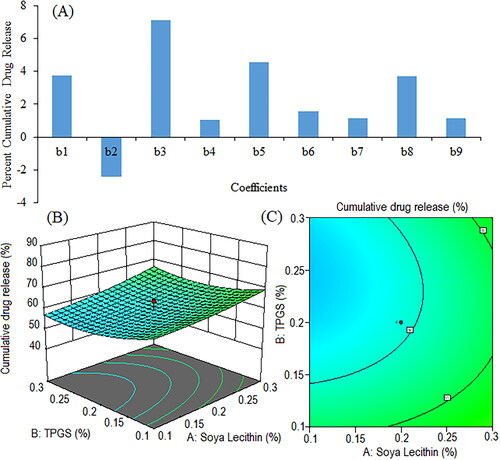
Figure 10. Pareto chart showing coefficients of percent cumulative drug release in phosphate buffer (pH 6.8) (b1, b2, b3 are main terms; b4, b5, b6 are interaction terms and b7, b8, b9 are square terms) (a), 3D response surface plot (C) and contour plot (C) illustrating the impact of various process variables on percent cumulative drug release.
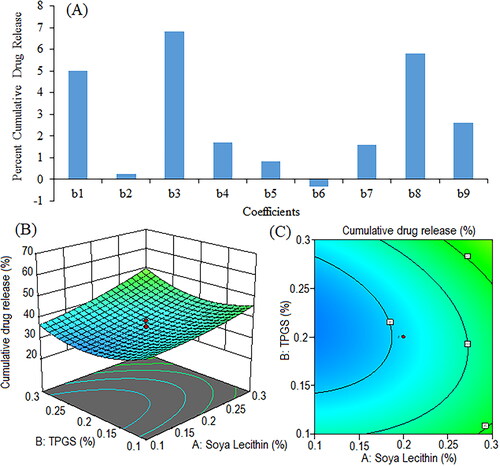
Table 3. Results Of two-way ANOVA of regression on the particle size, zeta potential, drug content, entrapment efficiency, and percent cumulative drug release in pH 1.2 and pH 6.8 dissolution media.
4.8. In vitro release studies
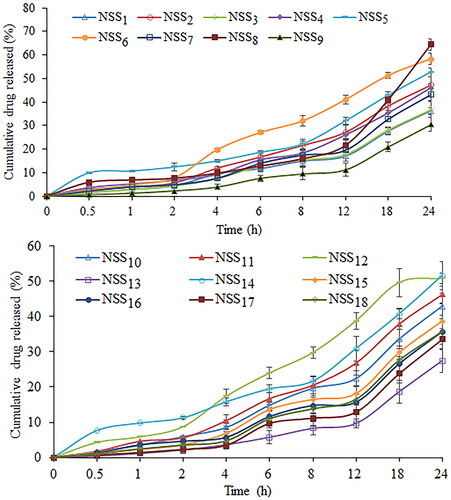
Dialysis bag diffusion was used to assess the in vitro drug release profile from prepared nanosuspension. In order to verify the sorafenib tosylate release, an in vitro release study was conducted in 0.1 N HCl (pH 1.2) and phosphate buffer (pH 6.8). The cumulative drug release from nanosuspension (NSS1–NSS18) varied from 48.37% to 86.37% in 0.1 N HCl after 24 h of dissolution study (). After 24 h, a formulation composition with 0.3% w/v of soya lecithin and 0.3% w/v of Vitamin E TPGS (formulation NSS8) had the highest drug release (86.37%) in 0.1 N HCl (pH 1.2). After 24 h of dissolution study in phosphate buffer (pH 6.8), drug release varied from 27.46% to 64.45% (). Following a 24 h dissolution study, formulation NSS8 had the highest sorafenib tosylate release (64.45%) in phosphate buffer. In acidic media, sorafenib tosylate is more likely to dissolve as a free base. This could explain why sorafenib tosylate releases quickly in gastric fluid (pH 1.2) but has a slow release profile in phosphate buffer (pH 6.8). Park et al. also reported more sorafenib release in pH 1.2 media from Eudragit-based microprecipitated powder formulation, supporting the outcomes of the present study [Citation61]. The continuous release of loaded sorafenib tosylate may boost treatment efficacy while also increasing the time required for absorption in gastrointestinal fluid.
Figure 11. Cumulative percentage release of sorafenib tosylate in 0.1 N HCl (pH 1.2) from the nanosuspension prepared using nanoprecipitation-sonication technique.
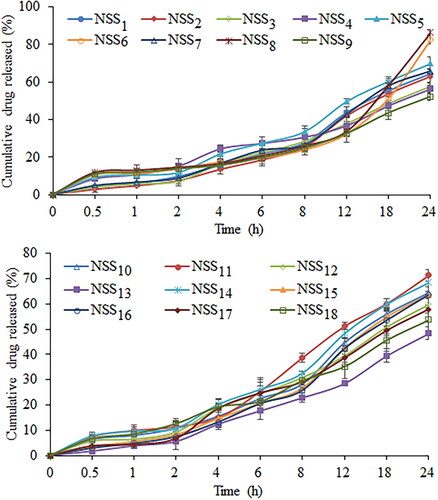
Figure 12. Cumulative percentage release of sorafenib tosylate in phosphate buffer (pH 6.8) from the nanosuspension prepared using nanoprecipitation-sonication technique.
4.8.1. Model for kinetics release
To conform the kinetics and mechanism of in vitro drug release from formulation NSS6, kinetic models such as zero-order, first-order, Higuchi’s model, and Korsmeyer-Peppas’ model were used. The linearity of Higuchi’s plot, based on the correlation coefficient (r2) value, illustrates diffusion-controlled drug release. Korsmeyer-Peppas’ model suggests that the drug release profile is non-Fickian anomalous diffusion if the slope (n) value ranges from 0.43 to 0.85. The n values higher than 0.85 suggest drug release by a diffusion-controlled mechanism with swelling (polymer matrix expansion). If the n value exceeds one, it implies that the release mechanism follows super case II mode. The best-fitting kinetic model was selected based on goodness of fit, depending on the highest r2 value. The time-drug release rate relationship can be understood through the value of r2 in zero-order drug release kinetics. A high r2 value (close to 1) for the zero-order drug release kinetics depicts a situation in which the rate of drug release from a dosage form is constant across time, regardless of the initial drug concentration. On the other hand, a high r2 value (close to 1) for the first-order kinetic model suggests that the rate of drug release is proportional to the remaining drug concentration. In the present study, the drug release was best explained by zero-order kinetics from the nanosuspension in 0.1 N HCl (pH 1.2) and phosphate buffer (pH 6.8), which means that the dissolution rate of sorafenib tosylate from the nanosuspension was independent on the drug concentration. With correlation coefficient (r2) values of 0.9820 in pH 6.8, the dissolution data of sorafenib tosylate from the prepared nanosuspension demonstrated linearity for Higuchi’s plots. However, a higher r2 value was recorded for Korsmeyer-Peppas’ model in pH 1.2. The Korsmeyer-Peppas’ plots, by displaying reasonable linearity, supported the diffusion theory of drug release (r2 values of 0.9470 and 0.8862 in pH 1.2 and pH 6.8, respectively, with slope values of 0.1246 and 0.1295) (). The drug release profile followed non-Fickian anomalous diffusion from the prepared nanosuspension.
Table 4. Correlation coefficient value from different drug release kinetics.
4.8.2. Comparison with marketed preparation
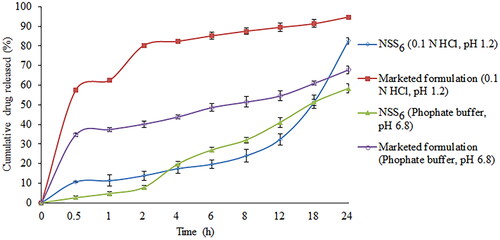
The comparative in vitro drug release study of the commercially available formulation (Soranib, Cipla Ltd., India) and the optimized nanosuspension (formulation NSS6) was carried out in phosphate buffer (6.8 pH) and 0.1 N HCl (1.2 pH). In phosphate buffer and 0.1 N HCl, formulation NSS6 demonstrated drug release of 4.71% and 11.24% in 1 h, respectively. The marketed formulation demonstrated 37.38% and 62.52% of drug release in pH 6.8 and pH 1.2 in 1 h, respectively. After 24 h, formulation NSS6 released 58.26% and 82.52% drug in phosphate buffer and 0.1 N HCl, respectively, and the marketed tablet formulation released 94.72% and 67.82% of the drug in 0.1 HCl and phosphate buffer, respectively (). Sorafenib tosylate is released more slowly from the formulation NSS6 than from the commercial tablet, which could make it more effective and less likely to cause side effects.
Figure 13. Comparison of in vitro release of optimized batch and marketed formulation (Soranib, Cipla Ltd., Mumbai, India) in 0.1 N HCl and phosphate buffer.
4.9. Stability study
The stability study was conducted for 3 months in order to compare the storage stability of colloidal and lyophilized nanosuspensions. The comparative stability study data were interpreted on the basis of particle size and zeta potential (). The study was done for 3 months as per the ICH guidelines (4 ± 1 °C, 25 ± 2 °C/60 ± 5% RH, and 45 ± 2 °C/75 ± 5% RH). The data obtained revealed that the refrigerator condition (4 ± 1 °C) was suitable for the storage of both colloidal and lyophilized nanosuspension formulations. Further, it was observed that the lyophilized nanosuspension had greater physical stability than colloidal nanosuspension.
Table 5. Results of stability study of nanosuspension.
4.10. Cytotoxicity studies
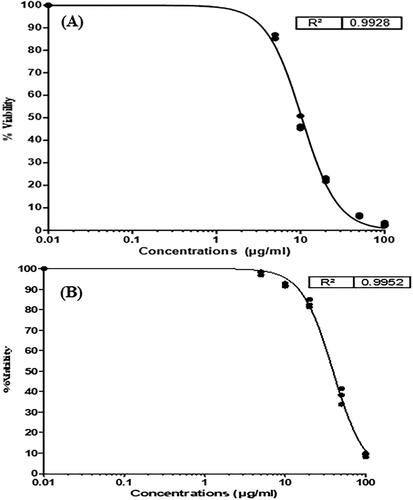
The cytotoxicity study of the pure drug and optimized nanosuspension with the highest entrapment efficiency and the smallest particle sizes (formulation NSS6) was carried out on HepG2 cells (Human Hepatocellular carcinoma cells). HepG2 cells were effectively inhibited by a nanosuspension of sorafenib tosylate. The uptake of drugs by cancer cells is significantly influenced by particle size. Formulation NSS6 displayed a significant cytotoxic effect; its smaller particle size may be the reason for this. A higher zeta potential value results in more direct interaction with a tumour cell, which makes cancer cells more vulnerable to cytotoxicity. The results showed that free drug was more toxic than drug-loaded nanosuspension. The slow release of sorafenib tosylate from nanosuspension may account for its lower cytotoxicity [Citation62]. The IC50 values for pure sorafenib tosylate and formulation NSS6 were 10.5 µg/mL and 39.4 µg/mL, respectively (). The results suggest that the cytotoxicity of sorafenib tosylate nanosuspension is dependent on the particle size and zeta potential of the formulation.
Figure 14. Results of cytotoxicity of pure sorafenib tosylate (a), and sorafenib tosylate-loaded nanosuspension (lyophilized formulation NSS6) on HepG2 cell line (B).
5. Conclusions
Nanoprecipitation followed by sonication is a commonly used technique to prepare nanosuspensions, which presents numerous advantages compared to alternative nanoparticle production methods. This technique is characterized by its simplicity and versatility, enabling the generation of nanoparticles with controlled and narrow particle size distributions. Additionally, it requires low energy consumption and improves the stability of the payload. By using nanoprecipitation followed by the sonication technique, sorafenib tosylate-loaded nanosuspension was successfully prepared and evaluated. With its nanoscale particle size, the optimized formulation demonstrated good entrapment efficiency (81.44 ± 0.25%) with an optimum particle size of 97.11 nm. The optimized nanosuspension formulation had excellent release properties (86.37% after 24 h in 0.1 N HCl and 64.45% after 24 h in phosphate buffer pH 6.8). The size and surface characteristics of nanosuspension have a significant impact on its ability to be delivered at its target site. SEM image confirmed rod-shaped particles in the nanometer range. The optimized formulation was stable, as indicated by the zeta potential values (−10.3 to −18.2 mV for colloidal nanosuspension and −12.4 to −18.7 mV for lyophilized nanosuspension). The stability studies concluded that 4 °C is preferable for storing nanosuspension formulations. The results of cytotoxicity study in Hep G2 cells demonstrated that the nanosuspension had lower cytotoxicity (IC50 value 39.4 µg/mL) due to the slow release of sorafenib tosylate. Overall, the established mathematical models may be used to formulate nanosuspensions with the desired characteristics.
Disclosure statement
No potential conflict of interest was reported by the authors.
References
- Llovet JM, Kelley RK, Villanueva A, et al. Hepatocellular carcinoma. Nat Rev Dis Primers. 2021;7(1):6. doi:10.1038/s41572-020-00240-3.
- Oluyomi AO, El-Serag HB, Olayode A, et al. Neighborhood-level factors contribute to disparities in hepatocellular carcinoma incidence in Texas. Clin Gastroenterol Hepatol. 2023;21(5):1314–1322.e5. doi:10.1016/j.cgh.2022.06.031.
- Apisarnthanarax S, Barry A, Cao M, et al. External beam radiation therapy for primary liver cancers: an ASTRO clinical practice guideline. Pract Radiat Oncol. 2022;12(1):28–51. doi:10.1016/j.prro.2021.09.004.
- Podlasek A, Abdulla M, Broering D, et al. Recent advances in locoregional therapy of hepatocellular carcinoma. Cancers (Basel). 2023;15(13):3347. doi:10.3390/cancers15133347.
- Yin Z, Chen D, Liang S, et al. Neoadjuvant therapy for hepatocellular carcinoma. J Hepatocell Carcinoma. 2022;9:929–946. doi:10.2147/JHC.S357313.
- Ruman U, Buskaran K, Pastorin G, et al. Synthesis and characterization of chitosan-based nanodelivery systems to enhance the anticancer effect of sorafenib drug in hepatocellular carcinoma and colorectal adenocarcinoma cells. Nanomaterials. 2021;11(2):497. doi:10.3390/nano11020497.
- Li Z, Ye L, Liu J, et al. Sorafenib-loaded nanoparticles based on biodegradable dendritic polymers for enhanced therapy of hepatocellular carcinoma. Int J Nanomedicine. 2020;15:1469–1480. doi:10.2147/IJN.S237335.
- Carmeliet P, Jain RK. Molecular mechanisms and clinical applications of angiogenesis. Nature. 2011;473(7347):298–307. doi:10.1038/nature10144.
- Jain RK. Normalizing tumour microenvironment to treat cancer: bench to bedside to biomarkers. J Clin Oncol. 2013;31(17):2205–2218. doi:10.1200/JCO.2012.46.3653.
- Awasthi R, Roseblade A, Hansbro PM, et al. Nanoparticles in cancer treatment: opportunities and obstacles. Curr Drug Targets. 2018;19(14):1696–1709. doi:10.2174/1389450119666180326122831.
- Sarkar M, Wang Y, Ekpenyong O, et al. Pharmacokinetic behaviors of soft nanoparticulate formulations of chemotherapeutics. Nanomed Nanobiotechnol. 2023;15(2):e1846.
- Rasool M, Malik A, Waquar S, et al. New challenges in the use of nanomedicine in cancer therapy. Bioengineered. 2022;13(1):759–773. doi:10.1080/21655979.2021.2012907.
- Ma Y, Cong Z, Gao P, et al. Nanosuspensions technology as a master key for nature products drug delivery and in vivo fate. Eur J Pharm Sci. 2023;185:106425. doi:10.1016/j.ejps.2023.106425.
- Ferrar JA, Sellers BD, Chan C, et al. Towards an improved understanding of drug excipient interactions to enable rapid optimization of nanosuspension formulations. Int J Pharm. 2020;578:119094. doi:10.1016/j.ijpharm.2020.119094.
- Saraswat AL, Vartak R, Hegazy R, et al. Drug delivery challenges and formulation aspects of proteolysis targeting chimera (PROTACs). Drug Discov Today. 2023;28(1):103387. doi:10.1016/j.drudis.2022.103387.
- Jacob S, Nair AB, Sha J. Emerging role of nanosuspensions in drug delivery systems. Biomat Res. 2020;24:3.
- Sampathi S, Haribhau CJ, Kuchana V, et al. Nanosuspension encapsulated chitosan-pectin microbeads as a novel delivery platform for enhancing oral bioavailability. Carbohydr Polym. 2023;319:121177. doi:10.1016/j.carbpol.2023.121177.
- Sher M, Zahoor M, Shah SWA, et al. Is particle size reduction linked to drug efficacy: an overview into nano initiatives in pharmaceuticals. Zeitschrift Physikalische Chem. 2023;237(7):845–877. doi:10.1515/zpch-2023-0221.
- Pezik E, Gulsun T, Gunduz MG, et al. Preparation of nanosuspensions of a 1,4-dihydropyridine-based mixed L-/T-type calcium channel blocker by combined precipitation and ultrasonication methods. J Drug Deliv Sci Technol. 2023;87:104772. doi:10.1016/j.jddst.2023.104772.
- Lee SH, Kim JK, Jee JP, et al. Quality by design (QbD) application for the pharmaceutical development process. J Pharm Investig. 2022;52(6):649–682. doi:10.1007/s40005-022-00575-x.
- Rampado R, Peer D. Design of experiments in the optimization of nanoparticle-based drug delivery systems. J Control Release. 2023;358:398–419. doi:10.1016/j.jconrel.2023.05.001.
- Cooper RG, Edgett SJ, Kleinschmidt EJ. Optimizing the stage-gate process: what best-practice companies do-I. Res Technol Manag. 2002;45(5):21–27. doi:10.1080/08956308.2002.11671518.
- Anandam S, Selvamuthukumar S. Optimization of microwave-assisted synthesis of cyclodextrin nanosponges using response surface methodology. J Porous Mater. 2014;21(6):1015–1023. doi:10.1007/s10934-014-9851-2.
- Beg S, Swain S, Rahman M, et al. Application of design of experiment (DoE) in pharmaceutical product and process optimization, in pharmaceutical quality by design. In: Beg S, Hasnain MS, editors. Pharmaceutical quality by design. United States, MA: Cambridge, 2019;43–64.
- Bhattacharya S. Central composite design for response surface methodology and its application in pharmacy. In: Response surface methodology in engineering. London, United Kingdom: Intech. Open. 2021;1–21
- Djoudi W, Aissani-Benissad F, Bourouina-Bacha S. Optimization of copper cementation process by iron using Central composite design experiments. Chem Eng J. 2007;133(1-3):1–6. doi:10.1016/j.cej.2007.01.033.
- Acıkalın K, Karaca F, Bolat E. Central composite rotatable design for liquefaction of pine barks. Fuel Process Technol. 2005;87(1):17–24. doi:10.1016/j.fuproc.2005.04.005.
- Rakic T, Kasagic-Vujanovic I, Jovanovic M, et al. Comparison of full factorial design, Central composite design, and box-behnken design in chromatographic method development for the determination of fluconazole and its impurities. Anal Lett. 2014;47(8):1334–1347.
- Peter S, Mathews MM, Saju F, et al. Development, optimization and in vitro characterization of eudragit-ganciclovir nanosuspension or treating herpes simplex keratitis. J Pharm Innov. 2023. doi:10.1007/s12247-023-09723-8.
- Waghule T, Saha RN, Alexander A, et al. Tailoring the multi-functional properties of phospholipids for simple to complex self-assemblies. J Control Release. 2022;349:460–474. doi:10.1016/j.jconrel.2022.07.014.
- Zheng Y, Chen H, Zeng X, et al. Surface modification of TPGS-b-(PCL-ran-PGA) nanoparticles with polyethyleneimine as a co-delivery system of TRAIL and endostatin for cervical cancer gene therapy. Nanoscale Res Lett. 2013;8(1):161. doi:10.1186/1556-276X-8-161.
- Yan H, Du X, Wang R, et al. Progress in the study of D-α-tocopherol polyethylene glycol 1000 succinate (TPGS) reversing multidrug resistance. Colloids Surf B Biointerfaces. 2021;205:111914. doi:10.1016/j.colsurfb.2021.111914.
- Yang S, Zhang B, Gong X, et al. In vivo biodistribution, biocompatibility, and efficacy of sorafenib-loaded lipid-based nanosuspensions evaluated experimentally in cancer. Int J Nanomedicine. 2016;11:2329–2343. doi:10.2147/IJN.S104119.
- Matteucci ME, Hotze MA, Johnston KP, et al. Drug nanoparticles by antisolvent precipitation: mixing energy versus surfactant stabilization. Langmuir. 2006;22(21):8951–8959. doi:10.1021/la061122t.
- Singh MK, Pooja D, Ravuri HG, et al. Fabrication of surfactant-stabilized nanosuspension of naringenin to surpass its poor physiochemical properties and low oral bioavailability. Phytomedicine. 2018;40:48–54. doi:10.1016/j.phymed.2017.12.021.
- Shaikh F, Patel M, Patel V, et al. Formulation and optimization of cilnidipine loaded nanosuspension for the enhancement of solubility, dissolution and bioavailability. J Drug Deliv Sci Technol. 2022;69:103066. doi:10.1016/j.jddst.2021.103066.
- Liu Y, Feng L, Liu T, et al. Multifunctional pH-sensitive polymeric nanoparticles for theranostics evaluated experimentally in cancer. Nanoscale. 2014;6(6):3231–3242. doi:10.1039/c3nr05647c.
- Mishra B, Arya N, Tiwari S. Investigation of formulation variables affecting the properties of lamotrigine nanosuspension using fractional factorial design. DARU J Pharm Sci. 2010;18(1):1–8.
- Bose S, Sharma P, Mishra V, et al. Comparative in vitro evaluation of glimepiride containing nanosuspension drug delivery system developed by different techniques. J Mol Struct. 2021;1231:129927. doi:10.1016/j.molstruc.2021.129927.
- Singh AK, Singh SS, Rathore AS, et al. Lipid-coated MCM-41 mesoporous silica nanoparticles loaded with berberine improved inhibition of acetylcholine esterase and amyloid formation. ACS Biomater Sci Eng. 2021;7(8):3737–3753. doi:10.1021/acsbiomaterials.1c00514.
- Khatak S, Mehta M, Awasthi R, et al. Solid lipid nanoparticles containing anti-tubercular drugs attenuate the Mycobacterium marinum infection. Tuberculosis (Edinb). 2020;125:102008. doi:10.1016/j.tube.2020.102008.
- Banarase NB, Kaur CD. Whole whey stabilized oleanolic acid nanosuspension: formulation and evaluation study. J Drug Deliv Sci Technol. 2022;67:103001. doi:10.1016/j.jddst.2021.103001.
- Alley MC, Scudiero DA, Monks A, et al. Feasibility of drug screening with panels of human tumor cell lines using a microculture tetrazolium assay. Cancer Res. 1988;48(3):589–601.
- Noor F, Niklas J, Müller-Vieira U, et al. An integrated approach to improved toxicity prediction for the safety assessment during preclinical drug development using hep G2 cells. Toxicol Appl Pharmacol. 2009;237(2):221–231. doi:10.1016/j.taap.2009.03.011.
- Singare DS, Marella S, Gowthamrajan K, et al. Optimization of formulation and process variable of nanosuspension: an industrial perspective. Int J Pharm. 2010;402(1–2):213–220. doi:10.1016/j.ijpharm.2010.09.041.
- Shamma RN, Basalious EB, Shoukri R. Development of novel sustained release matrix pellets of betahistine dihydrochloride: effect of lipophilic surfactants and co-surfactants. Pharm Dev Technol. 2012;17(5):583–593. doi:10.3109/10837450.2011.557730.
- Godara S, Lather V, Kirthanashri SV, et al. Lipid-PLGA hybrid nanoparticles of paclitaxel: preparation, characterization, in vitro and in vivo evaluation. Mater Sci Eng C Mater Biol Appl. 2020;109:110576. doi:10.1016/j.msec.2019.110576.
- Agnihotri SA, Mallikarjuna NN, Aminabhavi TM. Recent advances on chitosan-based micro-and nanoparticles in drug delivery. J Control Release. 2004;100(1):5–28. doi:10.1016/j.jconrel.2004.08.010.
- Elsayed MM, Mostafa ME, Alaaeldin E, et al. Design and characterisation of novel sorafenib-loaded carbon nanotubes with distinct tumour-suppressive activity in hepatocellular carcinoma. Int J Nanomedicine. 2019;14:8445–8467. doi:10.2147/IJN.S223920.
- Wang X, Luo Z, Xiao Z. Preparation, characterization, and thermal stability of β-cyclodextrin/soybean lecithin inclusion complex. Carbohydr Polym. 2014;101:1027–1032. doi:10.1016/j.carbpol.2013.10.042.
- Perez-Ruiz AG, Ganem A, Olivares-Corichi IM, et al. Lecithin-chitosan-TPGS nanoparticles as nanocarriers of (−)-epicatechin enhanced its anticancer activity in breast cancer cells. RSC Adv. 2018;8(61):34773–34782. doi:10.1039/c8ra06327c.
- Marquele-Oliveira F, Torres EC, da Silva Barud H, et al. Physicochemical characterization by AFM, FT-IR and DSC and biological assays of a promising antileishmania delivery system loaded with a natural Brazilian product. J Pharm Biomed Anal. 2016;123:195–204. doi:10.1016/j.jpba.2016.01.045.
- Yang L, Wu P, Xu J, et al. Development of apremilast solid dispersion using TPGS and PVPVA with enhanced solubility and bioavailability. AAPS PharmSciTech. 2021;22(4):142. doi:10.1208/s12249-021-02005-x.
- Zhang T, Li X, Xu J, et al. Preparation, characterization, and evaluation of breviscapine nanosuspension and its freeze-dried powder. Pharmaceutics. 2022;14(5):923. doi:10.3390/pharmaceutics14050923.
- Gao Y, Liao J, Qi X, et al. Coamorphous repaglinide-saccharin with enhanced dissolution. Int J Pharm. 2013;450(1–2):290–295. doi:10.1016/j.ijpharm.2013.04.032.
- Abdelbary AA, Al-Mahallawi AM, Abdelrahim ME, et al. Preparation, optimization, and in vitro simulated inhalation delivery of carvedilol nanoparticles loaded on a coarse carrier intended for pulmonary administration. Int J Nanomedicine. 2015;10:6339–6353. doi:10.2147/IJN.S91631.
- Benizri S, Ferey L, Alies B, et al. Nucleoside-lipid-based nanocarriers for sorafenib delivery. Nanoscale Res Lett. 2018;13(1):17. doi:10.1186/s11671-017-2420-2.
- Hong C, Dang Y, Lin G, et al. Effects of stabilizing agents on the development of myricetin nanosuspension and its characterization: an in vitro and in vivo evaluation. Int J Pharm. 2014;477(1–2):251–260. doi:10.1016/j.ijpharm.2014.10.044.
- Kalvakuntla S, Deshpande M, Attari Z, et al. Preparation and characterization of nanosuspension of aprepitant by H96 process. Adv Pharm Bull. 2016;6(1):83–90. doi:10.15171/apb.2016.013.
- Nakarani M, Misra AK, Patel JK, et al. Itraconazole nanosuspension for oral delivery: formulation, characterization and in vitro comparison with marketed formulation. DARU. 2010;18(2):84.
- Park JH, Baek MJ, Lee JY, et al. Preparation and characterization of sorafenib-loaded microprecipitated bulk powder for enhancing oral bioavailability. Int J Pharm. 2020;589:119836. doi:10.1016/j.ijpharm.2020.119836.
- Zhang S, Li J, Lykotrafitis G, et al. Size-dependent endocytosis of nanoparticles. Adv Mater. 2009;21(4):419–424. doi:10.1002/adma.200801393.