Abstract
Sound ecological data are important for the conservation of the endangered Sardinian red deer, but mainly anecdotal information is available. Deer density in Mt. Arcosu WWF Reserve was 25–26 deer/100 ha. We radiotracked 8 hinds and 2 stags. Mean annual home range size was 36.5 ha (hinds) and 65.9 ha (stags). On the rut, adult females increased their home ranges by 25% and subadult females by 80%. At birthing, female home ranges reached a minimum. Small home ranges of our deer were probably related to the mild climate and dense evergreen vegetation, providing food and cover. Hinds always moved more than stags. Site fidelity was shown to areas rich in food and cover, except on the rut. In days with tourists, mean home range size significantly increased and deer selected wooded areas, whereas they preferred open terrain in days without tourists. A stronger response to disturbance occurred during the rut and in winter, when deer were less habituated to tourists. Maximum habitat selection occurred in spring and summer, when open areas were rarely used. A lethal impact on uncommon species, because of overbrowsing, was observed on 1.3% of plants. The overall impact on vegetation was negligible, despite the great deer density.
Introduction
The present distribution of the red deer Cervus elaphus Linnaeus, 1758 in Europe is mainly the result of man's influence (Staines Citation1974). This cervid was formerly distributed over nearly all of Europe, north‐west Africa and most of Asia, in habitats as diverse as the Siberian taiga, the Southern Tibetan plateau, mountain forests, moorland and the Mediterranean scrubwood. This wide Palaearctic distribution suggests that the red deer is a quite adaptable species, matching its biological requirements to local habitat features.
While most studies on the ecology, behaviour and management of red deer have been conducted on populations of Central Europe and Great Britain (e.g. Georgii Citation1980; Clutton‐Brock et al. Citation1982; Catt & Staines Citation1987; Wood Citation2000; Gebert & Verheyden‐Tixier Citation2001; Virtanen et al. Citation2002; Putman & Staines Citation2004; Ward Citation2005), only a very few of them have been carried out on populations inhabiting the ecologically richer Mediterranean areas (Papageorgiou Citation1978; Carranza et al. Citation1991; Maillard et al. Citation1995).
Mediterranean populations of red deer are of the highest interest because of conservation and management issues. The Sardo‐corsican subspecies Cervus elaphus corsicanus Erxleben, 1777 is reported as ‘endangered’ in the IUCN Red Data Book (IUCN Citation2004). This localized taxon is the largest mammal in Sardinia and Corsica and its conservation is a priority for the restoration of local biodiversity. Ecological and behavioural data may be important to organise a correct management for this deer, but only anecdotal information is presently available on its biology (e.g. Beccu Citation1989).
The red deer was common in Sardinia until the nineteenth century (Beccu Citation1989). Presently, it only survives in three mountainous areas in the south‐west (Pula, Capoterra, Assemini, Uta, Sanrroch and Villa San Pietro), in the south‐east (Sette Fratelli mountain) and in the west coast (between Monte Vecchio and Marina di Arbus). Reintroductions are in progress to several areas of Sardinia and Corsica. No less than 2700 deer survive in the wild (I.N.F.S. Citation2002).
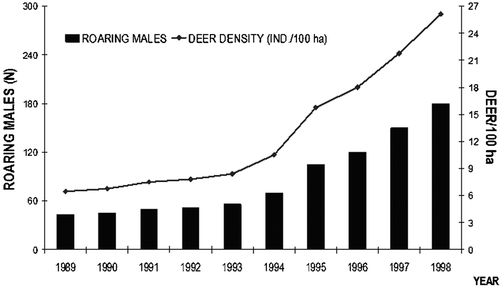
The number of deer living in our study area (Mt. Arcosu, south‐west of Sardinia) has increased steadily since 1985 (when the WWF Reserve of Mt. Arcosu was established). Counts of roaring males (with direct observations throughout the year to assess the local population structure) were carried out from 1989 to 1998, indicating an increase from 50 to 180 roaring stags (C. Murgia, unpublished data; Figure ). Thus, a density of about 26 deer/100 ha was reported in 1998, confirming the results of a previous estimate carried out through a pellet group count (Lovari Citation1996). Some recent (2003–2004) information from the same area suggests a present density of over 29 deer/100 ha (Murgia et al. Citation2005a, Citation2005b). In other geographic areas (e.g. Central Europe) densities of 5 deer/100 ha have been considered alarming because of the high probability of overbrowsing (e.g. Baines et al. Citation1994): control measures—such as culling—have often been applied to limit these effects, even in protected areas. Different habitats and ecological contexts have different carrying capacities. Assuming that the local density of a species is ‘too high’ (in relation to what happens in other ecological contexts) may be hazardous. The density of a species becomes ‘too high’ only when convincing evidence is provided that permanent damage is caused to other components of ecosystems or heavy encroachment occurs with human activities. This cautious approach is particularly important when culling operations are considered to reduce the density of a species (e.g. deer) in a protected area.
Figure 1. Estimates of deer numbers between 1989 and 1998.
The aims of this project were to assess: (1) seasonal movements and home range features of this deer, (2) habitat selection, (3) effect of tourism on movements and activity patterns, (4) impact of deer, living at a high density, on the Mediterranean scrubwood.
S.L. is responsible for the overall planning of this study and most of data analyses, P.C. and A.M. carried out most of field work and some data analyses, C.M. provided backing and practical facilities at all stages of field work, G.P. carried out some data analyses and statistical evaluations, F.S. devised and supervised the analysis on browsing. S.L., G.P. and P.C. cooperated in writing drafts of this paper.
Material and methods
Study area
Our study was carried out in the WWF Reserve of Mt. Arcosu (about 3600 ha), in Capoterra, Assemini and Uta hills (Cagliari county, south‐west Sardinia). The altitude varies from 400 to 1200 m. Mean maximum daily temperatures ranged from 14.0°C (January) to 32.0°C (July); mean minimum daily temperatures varied from 4.5°C (January) to 17.5°C (August). Raining days were frequent in February (9.0 days), decreased until a minimum of just 1.0 day in July, then it increased again till a new maximum of 9.5 days with rain in December (data from Servizio Meteorologico–Aeronautica Militare Italiana; meteorological station of Decimomannu; means over the study period).
In our study area the vegetation was Mediterranean scrubwood, with a prevalence of sclerophyl plants. Eight main vegetation types were present: garigue, in rocky areas (bush and scrub vegetation; 18% ca., in our study area); low scrubwood, in warmer sites and at lower altitudes (xerophyl and thermophyl small‐leaved scrubs, up to 2 m tall; 13% ca.); tall scrubwood (mesophyl species up to 4–6 m in height, e.g. Phillyrea latifolia, Arbutus unedo, Quercus ilex; 13% ca.); olive Olea europaea oleaster scrubwood (2% ca.); holm oak wood (Quercus ilex, up to a height of 8–10 m; 25% ca.); cork oak Quercus suber wood (20% ca.); riparian vegetation (formations of Nerium oleander, mainly with Alnus glutinosa and Salix caprea, often interspersed with Rubus ulmifolius and Hedera helix; 8% ca.); scattered, small meadows (pasture for wild herbivores; 1% ca.).
Data collection
Eight hinds (five adults, i.e. >2 years old; three yearlings) and two adult stags (>5 years old) were caught using a corral trap (Harper Citation1985) and fitted with radiocollars (Televilt®, Stora, Sweden). Approximate age was assessed mainly through tooth eruption and wear. Deer were monitored over a 24‐h cycle. Fixes were evenly collected in all seasons (24.5% in winter, 24.2% in spring, 24.6% in summer and 26.7% in autumn). Six females (F1, F2, F3, F4, F5, F6) were monitored from October 1996 to December 1998. Two females (F7 and F8) were radiotracked from November 2001 to November 2002. Males (M1 and M2) were followed between October 1996 and September 1998. Male M2 was not monitored continuously during the cold months due to technical problems. A total of 9381 fixes were collected and 27 outliers (>3 SD) were removed. Out of 9354 fixes used for analyses, 74.3% were from females and 25.7% from males.
Data analyses
Annual and seasonal home range sizes have been estimated for each animal with the kernel method (White & Garrott Citation1990). Annual and bimonthly home range sizes were also estimated using the Minimum Convex Polygon (hereafter, MCP; Mohr Citation1947; Southwood Citation1989) on ‘active’ fixes only. Kernel home range sizes were also assessed for the mating period (16 August–15 October), pre‐mating (16 June–15 August) and post‐mating (16 October–15 December) periods. For males, bi‐weekly MCP home ranges have also been calculated during the mating period. For each animal, overlap between seasonal MCP home ranges was also estimated. We used both kernel and MCP estimates to allow comparisons with existing literature.
Spatial analyses were carried out through the extension Animal Movement 2.0 (Hooge & Eichenlaub Citation2000) for ESRI ArcView 3.2 GIS®. Kernel home ranges were estimated using an ad hoc smoothing factor on a grid of 10 m cells (Hooge & Eichenlaub Citation2000). Statistics on movements has been carried out for each season and for each month using SPSS® software (SPSS Inc.), through non‐parametric tests for K independent samples: we considered fixes used to assess ranging movements as independent, because of the long time interval between them (24 h). Differences between pre‐mating, mating and post‐mating seasons have been tested through standard parametric and non‐parametric tests, as indicated in the text (see further).
The effects of tourism disturbance on movements and activity patterns of deer were investigated by comparing data collected in days in which visitors were not allowed in the study area (‘no tourists’ days), with those collected in days in which at least 10 persons were visiting the area (‘with tourists’ days). Possible effects of weather conditions on activity patterns and movements of the animals were considered to be irrelevant (there was no significant statistical difference in weather conditions between days with ‘no tourists’ and days ‘with tourists’). However, it is possible that differences in weather conditions and temperature between seasons of maximum tourist presence (spring and autumn) and seasons with a small number of tourists (summer, winter) may influence the activity rate of deer, adding a bias to the analysis of tourism effects on deer movements. The activity rate of deer was measured as:
A map (1:10,000) of the vegetation derived from the CTR (Carta Tecnica Regionale) through direct vegetation surveys was adopted to assess the availability (as a fraction of the total area) of different habitat types within the home range of each marked animal. Habitat use was estimated as the percentage of radio locations (fixes) recorded in each habitat. Habitat selection (third level, sensu Johnson Citation1980), as well as the use of different habitat types, was investigated both on seasonal and annual bases using Ivlev's (Citation1961) preference index (see below).
Monthly measurements of browsing, debarking and fraying activities were collected over 12 sample itineraries equally distributed in each main vegetation type (through the random selection of deer paths in each layer of the stratified sample), between July 1998 and June 1999, to assess the impact of red deer on tree and shrub vegetation. One month was found to be the longest period in which new browsing events could be told apart from old ones. Along each itinerary (60 m in length), three circular plots of 5 m radius (about 80 m2) were established, at a distance of 15 m from one another. Plant species were assessed for each plot, and species with browsing, fraying or debarking activities were recorded. Browsing was classified in four classes, according to the extent of damage (0: no damage; 1: 1–25% damaged; 2: 26–50% damaged; 3: 51–75% damaged; 4: 76–100% damaged). Fraying or bark‐stripping activities were recorded according to the following scale: 0, no signs; 1, recent signs; 2, old signs. For each damaged plant, condition and height were recorded.
Browsing data have been analysed for each vegetation type (see ‘Study area’). The standardized Ivlev's selectivity or Jacob's index (Jacob Citation1974) was used to evaluate the degree of preference for each plant species, as well as to detect seasonal patterns:
The small sample size, markedly biased to females, did not allow detailed comparisons between sexes and age classes.
Results
Home range size
On average, for each deer, 938 (SD = 504) fixes were collected. Deer were found to be active in 59.5% of fixes (a mean of 726±131 fixes, for each animal) and inactive (resting) in 27.6% of them (348±96 fixes on each animal). Activity/inactivity could not be assessed in 12.9% of fixes.
The mean annual MCP100% home range size was 122.1±97.1 ha. Males had an annual MCP100% home range of 190.1±100.5 ha, whereas females had an annual MCP100% home range of 113.6±92.6 ha.
The kernel (hereafter, K) annual home range sizes were also estimated for each deer: the overall mean annual range size was 1.8±2.5 ha for K25%, 5.5±6.8 ha for K50% and 41.6±29.4 ha for K95%. Males had K25% home ranges of 4.2±5.3 ha, K50% home ranges of 10.6±12.6 ha and K95% home ranges of 65.9±38.4 ha. Females had K25% home ranges of 1.4±1.3 ha, K50% home ranges of 4.4±4.8 ha, and K95% home ranges of 36.5±25.5 ha.
Mean differences between seasonal home ranges (K25%, K50%, K95%) were not significant. While summer home ranges of adult females (MCP95% and MCP50%) were on average 32% smaller than winter ones; for subadult females, these range sizes increased slightly in the cold season. Combined effects of sex and season on home range size (K25%, K50%, K95%) were not significant (Generalised Linear Model, univariate GLM procedure).
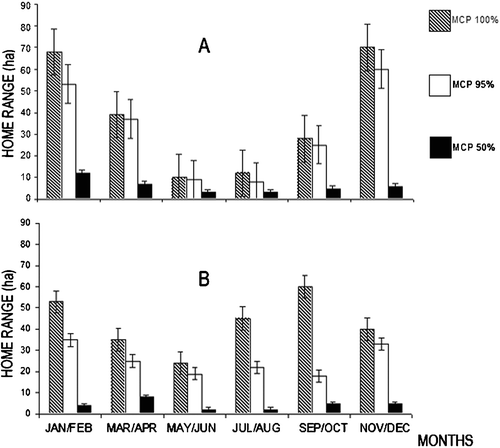
Adult females increased their home range sizes (MCP95% and MCP50%) by about 25% during the mating season. Subadult females showed an increase of their home range sizes by more than 80%, in the same period. In the birth period (May–June), home range sizes of subadult and adult females reached a minimum (about 10 and 15 ha, respectively) (Figure ).
Figure 2. Mean bimonthly home range sizes measured with different MCP estimates(100%, 95%, 50%) of adult (A) and subadult (B) hinds in 1997 and 1998. Vertical bars represent standard deviations.
Males occupied greater home ranges (80 ha ca.) at the beginning (end of August) and at the end (beginning of October) of the mating season, than during the rut (<10 ha).
Differences between kernel home ranges during the mating season, the pre‐mating and post‐mating periods, were not significant (Mann–Whitney U test) both for the whole sample and if males and females were separately grouped.
Overlap between seasonal home ranges
Overlap between seasonal MCP95% home ranges, in the same year, was greater in winter/spring, for adult females; in spring/summer and winter/summer for subadult females; in winter/spring and spring/summer, for males (Table ). One subadult and two adult females showed a high degree of overlap of their home ranges (about 70%). For males, overlap between seasonal home ranges (MCP95%) belonging to different years was relatively high (70±9%): the largest overlap occurred in spring (80±28%) and summer (73±21%). In the two years in which male M1 was radiotracked, his seasonal home ranges overlapped in winter (77%, 1997; 41%, 1998), spring (100%, 1997; 60%, 1998), summer (58%, 1997; 88%, 1998) and autumn (39%, 1997; 91%, 1998).
Table I. Seasonal home range (MCP100%) overlap between preceding and following seasons and vice versa.
Movements
The overall mean distance between two successive fixes was 47±52 m. Inter‐fix distances were not normally distributed (Kolmogorov–Smirnov 1‐sample test Z = 29,165, Monte Carlo 2‐tailed P<0.001, n = 9347) nor distances covered by deer were equally distributed throughout years (Kruskal–Wallis χ2 = 35.457, Monte Carlo 2‐tailed P<0.0001, n = 9347).
Inter‐fix distances significantly varied between seasons (Kruskal–Wallis χ2 = 104,644, Monte Carlo 2‐tailed P<0.0001, n = 9347), with, respectively, two peaks in the autumn (51±50 m) and winter (55±52 m), and two minimum values in spring (44±50 m) and summer (41±50 m).
Differences between distances travelled significantly varied between months (Kruskal–Wallis χ2 = 134,461, Monte Carlo 2‐tailed P<0.0001, n = 9347), with a minimum in August (37 m ca.) and a maximum in December (66 m ca.).
Distances travelled between pre‐mating, mating and post‐mating periods significantly varied (Kruskal–Wallis χ2 = 66,651, Monte Carlo 2‐tailed P<0.0001, n = 4863), with an increasing median distance from the pre‐rut (36 m ca.) to the rut (43 m ca.) and to the post‐rut (52 m ca.). Significant differences have been also found when the periods were tested in pairs (Kruskal–Wallis pre‐mating/mating: P = 0.001, n = 3245; mating/post‐mating: P<0.0001, n = 3233).
Reactions to tourists
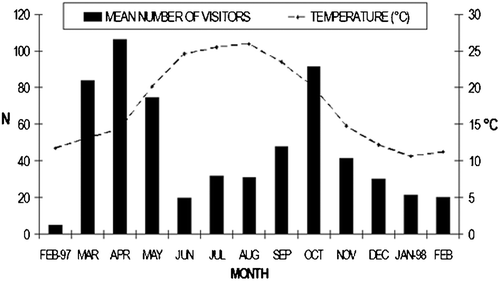
Tourist activities showed a seasonal pattern, with maximum daily means in spring and mid‐autumn (Figure ). The activity rate was estimated to be about 66.3% (±3%) in presence of tourists, and 72% (±3%) in their absence. On average, females showed a greater activity rate (84±1%) than males (58±0%) in presence of tourists, with the exception of F2 (56%).
Figure 3. Monthly number of tourists in the Reserve. FEB‐97 = February 1997; JAN‐98 = January 1998.
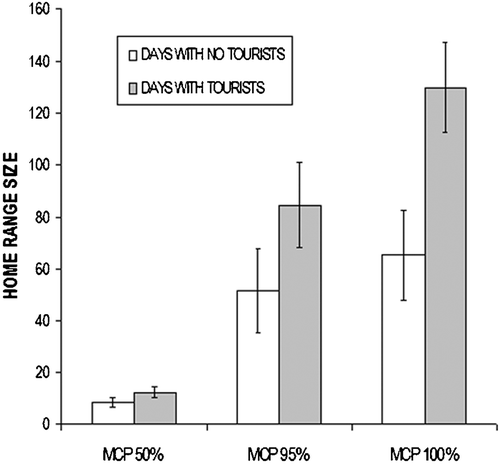
Mean home range size tended to increase in presence of tourists (Figure ). For females, the mean size increased significantly more (MCP95%: +50.7%; MCP100%: +56.7%) than that of males (MCP95%: +15.1%; MCP100%: +31.7%) (Wilcoxon test for paired data; n = 8, T = 36.0, P = 0.004).
Figure 4. Variation of mean home range sizes(ha) in days with no tourists and in those with tourists.
Deer selected closed areas, e.g. scrubwood and riparian vegetation, in presence of visitors, whereas they preferred relatively open areas, i.e. meadows and low scrubwood, in their absence.
Habitat selection
Overall, females showed some preference for tall scrubwood, riparian vegetation and meadows, whereas M1 showed a preference for cork‐oak wood and riparian vegetation (Figure ). This stag selected wooded areas in winter and spring, but he avoided them in the rest of the year.
Figure 5. Annual habitat selection(Ivlev index; third level, Johnson Citation1980).
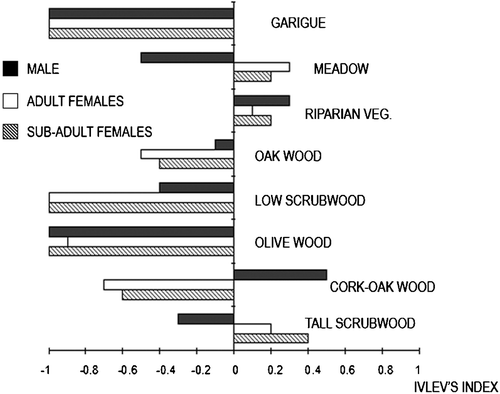
There were no apparent differences between males and females in the use of habitats in autumn and summer: both sexes spent more time in tall scrubwood, riparian vegetation and meadows (Table ). However, the small sample size for males could have deeply influenced any comparison between the sexes.
Table II. Seasonal preference index (Ivlev, third level, see Johnson Citation1980). SF = subadult females, AF = adult females; M = male M1.
Browsing preferences and impact on vegetation
Strong preferences for browsing on Ruscus aculeatus, Quercus ilex, Alnus glutinosa, Salix caprea, Myrtus communis and Viburnum tinum were found. The highest selectivity values (close to 1) were shown in periods with rich cover (particularly in winter and spring), especially in garigue, low scrubwood and riparian vegetation patches (Table ).
Table III. Preferences for browsed species, in different seasons. In parentheses, the standardized Ivlev's selectivity index for each species (see Methods).
While tall scrubwood was preferred for browsing in autumn, winter and spring, oak wood was selected in summer. Riparian vegetation, cork‐oak wood and low scrubwood were preferred in winter and summer, whereas the garigue was used less than expected throughout the year (Table ).
Table IV. Selectivity (Ivlev's index) of different vegetation types, in each season. A = availability; U = use.
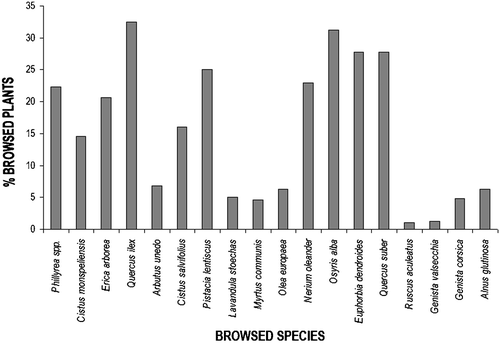
Phillyrea latifolia was the most abundant species in all areas, with the exception of low scrubwood and garigue, in which Cistus monspeliensis was the most abundant plant. A common species in all vegetation types was Quercus ilex. Arbutus unedo, Myrtus communis, Pistacia lentiscus and Erica arborea were often present too. Browsing was not concentrated on a few plant species, but ten species were browsed with frequencies>10% (Figure ).
Figure 6. Browsed plants in relation to their overall abundance. For each species is reported the percentage of plants browsed in relation to the total number of plants recorded.
Ten plant species belonged to browsing category 1, 9 species to category 2, 11 species to category 3 and 7 species to category 4. The number of plant species with a lower browsing category (1, 2 or 3) did not significantly differ between seasons, whereas there were no browsing signs in winter for category 4. The mean percentage of plants (of each species) with browsing signs belonging to the categories 1, 2 and 3 was similar, whereas most species subjected to browsing category 4 (e.g. Alnus glutinosa, Ruscus aculeatus, Viburnum tinum and Olea europaea oleaster) showed a high percentage (>25%) of plants affected.
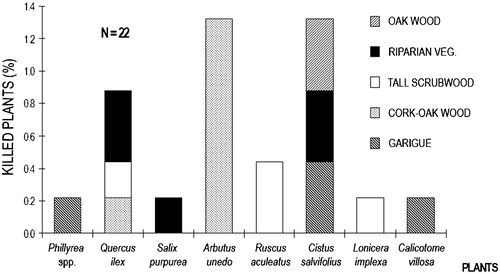
Signs of bark‐stripping activities were not found. On the other hand, just a very few signs of fraying activity (with antlers) could be observed (n = 6) on Phillyrea latifolia (tall scrubwood, oak wood), Quercus ilex (oak wood) and Pistacia lentiscus (low scrubwood). Lethal impact, caused by intense and repeated browsing activity, was observed only on 1.3% of the plants. The most affected species were Arbutus unedo, Cistus salvifolius and Quercus ilex (Figure ).
Figure 7. Proportion of shrub/tree species killed by browsing in each habitat.
Discussion
The annual mean home range size of our tagged females (ca. 130 ha, MCP100%) was much smaller than those described for red deer populations of Northern Europe, e.g. in the British Eastern Highlands females have a mean home range size of 2400 ha, while in the Glenbrander forest of Scotland these oscillate from 406 ha to 1008 ha (Catt & Staines Citation1987). The small home ranges of our deer were probably related to the temperate climate and dense evergreen vegetation of Sardinia, which makes seasonal migrations unnecessary between winter and summer ranges. In another Mediterranean area, in Monfragüe (Spain), home ranges of hinds measured about 250 ha (Carranza et al. Citation1990). Small home range sizes described for a population of central‐western Europe (Georgii Citation1980) may also support this view: in the productive foothills of the Bavarian Alps, ‘sedentary’ females, with mean home ranges of about 170 ha, occurred together with ‘migratory’ females, with home ranges of 300–350 ha. Females of Sardinian red deer partly differed from those of all other populations: while these have their smallest range sizes in the mating period, Sardinian hinds showed smaller range sizes during birth and lactation periods. Stags, on the other hand, occupied annual home ranges 1/3 bigger than hinds, which is probably related to their movements during the rut.
Overlap was great between winter/spring/summer home ranges for all our marked individuals. These deer were sedentary throughout nearly all the year. In the early autumn (mating season), home ranges shifted in space, but, after the mating season, the deer returned to previous sites. This could suggest fidelity to areas rich in food and cover, except for the mating season, when a partner is the most important resource to find.
Male deer moved more than females. This may be expected in a polygynous, not territorial species, but movements have been in all cases very short if compared with those observed elsewhere (e.g. Georgii Citation1980). Most likely, deer had abundant food resources and cover in our study area: in turn, this may have determined the locally high deer density (26–29 deer/100 ha; Lovari Citation1996; Murgia et al. Citation2005a, Citation2005b), with little reason for males to establish rutting grounds far from their summer ranges. Thus, all radio‐tagged deer were resident and no seasonal migration (as observed in other environmental contexts, e.g. Luccarini et al. Citation2006) was recorded.
Our red deer showed a strong preference for tall scrubwood, followed by riparian vegetation, whereas low scrubwood, oak wood and garigue were seldom used. Males seemed to spend more time in woodland than females, whereas the latter preferred open areas: this is probably related to different nutritional requirements of the two sexes, with females preferring the best grazing areas (Clutton‐Brock et al. Citation1982). Deer were found to be more selective in spring, when food resources are abundant and of a better quality, and in summer, when open areas were rarely used (probably because of dry vegetation there, due to local high temperatures: max = 26.2±0.3°C).
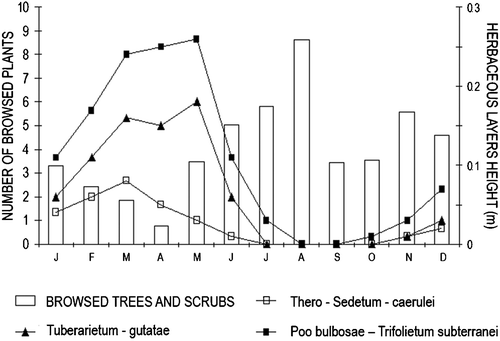
Browsing can be considered as the most damaging activity exerted by deer on the Mediterranean scrubwood: plant mortality, even if seldom observed, may be caused by intense browsing. Some relatively uncommon plant species (Ruscus aculeatus, Salix caprea, Myrtus communis, Alnus glutinosa, Viburnum tinum) were selected, in our study area: along with the great local population density of deer, this could have negative effects on plant diversity, in the long run. In particular, Ruscus aculeatus is a relatively rare, protected species in Italy and in most European countries. However, in our study area red deer seemed to live in balance with the evergreen Mediterranean vegetation: despite the local high population density, the impact on scrub and tree vegetation did not provide any apparent reason for present concern. In particular, the extent of browsing decreased strongly, when grass was available seasonally (Figure ).
Figure 8. Monthly variations in the relationships between number of browsed plants(trees and scrubs) and height of herbaceous layer associations. Browsing frequency was low when the herbaceous vegetation peaked. Data on availability of grass associations are from the Monte Arcosu WWF Reserve archive.
Elsewhere, e.g. in Central and Northern Europe, where winter rigours decrease food resources, grazing/browsing concentrate on few plant species, in the cold months. Thus, damage can be intense even at much lower deer densities. There, deer densities should be kept as low as just several individuals per 100 ha to avoid overbrowsing (e.g. Baines et al. Citation1994). Our data suggest that appropriate studies (e.g. to assess actual damage to the vegetation) should be carried out before culling deer in areas with alleged high densities of this species, particularly in protected areas: in fact, ‘many’ deer are not necessarily ‘too many’.
Tourism had no significant effect on activity patterns of deer (activity increased only by 4% in the days with visitors), but there was some evidence that the presence of tourists affected home range size, with a mean increase of over 16% (MCP95%). This change could suggest that the deer were moved to marginal areas of their usual home ranges. However, the local dense vegetation provided cover even at a relatively short distance from tourists. The narrow valleys with gorges and steep, thickly forested slopes should have allowed the deer to hide without moving far (thus avoiding an energetic waste). The strongest response to disturbance was observed during the rut (with males being strongly affected) and in winter, when tourists were rare and the deer were less habituated. Thus, the impact of disturbance should not only be related to the number of visitors, but also to changes in the biological state of deer: even a small number of visitors can cause disturbance, in winter.
Acknowledgements
This study could not have been carried out without the help of the wardens of the WWF Monte Arcosu Reserve and the personnel of Il Caprifoglio Coop., especially G. Paulis and B. Pillittu. C. Calò and F. Fraticelli encouraged us to undertake our study. G. Puddu, L. Mozzo, A.L. Balzano and E. Carboni provided extensive help in data collection and we are indebted to them. A.L. Balzano helped also greatly in data analysis (browsing assessment). R. Fico, P. Meneguz and L. Rossi provided expertise in deer trapping and handling. I. Minder and L. Cimino translated a first draft of this manuscript. We also thank A. Bocci, L. Pedrotti, S. Focardi, A. Monaco and an anonymous referee for their useful suggestions on previous drafts of this paper. Our study has been financially supported to S.L. by WWF‐Italy, within a LIFE project of the European Union.
References
- Baines , D. , Sage , R. B. and Baines , M. M. 1994 . The implications of red deer grazing to ground vegetation and invertebrate communities of Scottish native pinewoods. . Journal of Applied Ecol , 31 : 776 – 783 .
- Beccu , E. 1989 . Il cervo sardo , Sassari : Delfino .
- Carranza , J. , Alvarez , F. and Redondo , T. 1990 . Territoriality as a mating strategy in red deer. . Animal Behaviour , 40 : 79 – 88 .
- Carranza , J. , Hidalgo , S. J. , Medina , R. , Valencia , J. and Delgado , J. 1991 . Space use by red deer in a Mediterranean ecosystem as determined by radio‐tracking. . Applied Animal Behaviour Science , 30 : 363 – 371 .
- Catt , D. C. and Staines , B. W. 1987 . Home range use and habitat selection by red deer (Cervus elaphus) in a Sitka spruce plantantion as determined by radio‐tracking. . Journal of Zoology, London , 211 : 681 – 693 .
- Clutton‐Brock , T. H. , Guinness , F. E. and Albon , S. D. 1982 . Red Deer. Behaviour and ecology of two sexes , Edinburgh : University of Chicago & Edinburgh University Press .
- Gebert , C. and Verheyden‐Tixier , H. 2001 . Variations of diet composition of red deer (Cervus elaphus L.) in Europe. . Mammal Review , 31 : 189 – 201 .
- Georgii , B. 1980 . Home range patterns of female red deer (Cervus elaphus L.) in the Alps. . Oecologia , 47 : 278 – 285 .
- Harper , J. A. 1985 . Ecology and management of Roosevelt elk in Oregon , Portland, , OR, USA : Oregon Department of Fish and Wildlife .
- Hooge , P. N. and Eichenlaub , B. 2000 . Animal movement extension to Arcview, ver. 2.0 , Anchorage, , AK, USA : Alaska Science Center—Biological Science Office, U.S. Geological Survey .
- I.N.F.S . 2002 . Gli Ungulati in Italia—Status, distribuzione, consistenza, gestione e prelievo venatorio , Ozzano Emilia (BO) : Istituto Nazionale per la Fauna Selvatica ‘Alessandro Ghigi’ .
- IUCN. 2004. 2004 IUCN red list of threatened species. Available from: http://www.iucnredlist.org .
- Ivlev , V. S. 1961 . Experimental ecology of the feeding of fishes , New Haven, , USA : Yale University Press .
- Jacob , J. 1974 . Quantitative measurement of food selection. A modification of the forage ratio and Ivlev's selectivity index. . Oecologia , 14 : 413 – 417 .
- Johnson , D. H. 1980 . The comparison of usage and availability measurements for evaluating resource preference. . Ecology , 61 : 65 – 71 .
- Lovari , S. 1996 . Studio sul cervo sardo Cervus elaphus corsicanus: stato di avanzamento. , Rome : WWF‐Italy .
- Luccarini , S. , Mauri , L. , Ciuti , S. , Lamberti , P. and Apollonio , M. 2006 . Red deer (Cervus elaphus) spatial use in the Italian Alps: Home range patterns, seasonal migrations, and effect of snow and winter feeding. . Ethology Ecology & Evolution , 18 : 127 – 145 .
- Maillard , D. , Casanova , J. B. and Gaillard , J. M. 1995 . Dynamique de l'abroutissement du cerf de Corse (Cervus elaphus corsicanus) sur la végétation des enclos du parc de Quenza (Corse). . Mammalia , 59 : 363 – 372 .
- Mohr , C. O. 1947 . Table of equivalent populations of North American small mammals. . American Midland Naturalist , 37 : 223 – 249 .
- Murgia , A. , Cocco , F. , Murgia , C. and Deiana , A. M. 2005a . Stime di consistenza del cervo sardo nell'Oasi di M. Arcosu mediante la tecnica del pellet group count. . Rendiconti dei Seminari della Facoltà di Scienze Matematiche Fisiche e Naturali, Università di Cagliari , 75 : 1 – 6 .
- Murgia , A. , Murgia , C. and Deiana , A. M. 2005b . Sedici anni di censimenti del cervo sardo nella Riserva Naturale WWF di M. Arcosu. . Rendiconti dei Seminari della Facoltà di Scienze Matematiche Fisiche e Naturali, Università di Cagliari , 75 : 7 – 12 .
- Papageorgiou , N. K. 1978 . Food preferences, feed intake, and protein requirements of red deer in Central Greece. . Journal of Wildlife Management , 42 : 940 – 943 .
- Putman , R. J. and Staines , B. W. 2004 . Supplementary winter feeding of wild red deer Cervus elaphus in Europe and North America: Justifications, feeding practice and effectiveness. . Mammal Review , 34 : 285 – 306 .
- Southwood , T. R. E. 1989 . Ecological methods , London, , UK : Chapman & Hall . 2nd ed.
- Staines , B. W. 1974 . A review of factors affecting deer dispersion and their relevance to management. . Mammal Review , 4 : 79 – 91 .
- Virtanen , R. , Edwards , G. R. and Crawley , M. J. 2002 . Red deer management and vegetation on the Isle of Rum. . Journal of Applied Ecology , 39 : 572 – 583 .
- Ward , A. I. 2005 . Expanding ranges of wild and feral deer in Great Britain. . Mammal Review , 35 : 165 – 173 .
- White , G. C. and Garrott , R. A. 1990 . Analysis of wildlife radio‐tracking data , San Diego, , CA, USA : Academic Press, Inc .
- Wood , B. 2000 . Room for nature? Conservation management of the Isle of Rhum, UK and prospects for large protected areas in Europe. . Biological Conservation , 94 : 93 – 105 .