Abstract
B chromosomes (Bs) are supernumerary elements to the standard chromosome set, characterized by a dispensable nature. They are maintained like parasites if they possess any mechanism of accumulation. Otherwise, they must confer some selective advantage to the carriers. Some evidence for a beneficial effect led to the dominating opinion that Bs are genomic parasites. Populations of the yellow‐necked mouse, Apodemus flavicollis, are characterized by a frequent presence of Bs, even though no mechanism for their accumulation has been found. Head morphology was compared in three populations of this species with different frequencies of animals with Bs (fB). Two of the localities (Mt. Avala, fB = 0.37 and Mt. Cer, fB = 0.31) are typical forest habitats and are about 100 km far from each other, while the third locality (Ada, fB = 0.19) is a quite different habitat located less than 5 km from Mt. Cer. Discriminant analysis of morphological traits separated the locality Ada from Mt. Avala, while the population from Mt. Cer, besides its internal variation, included variation from both other localities (Ada‐like and Mt. Avala‐like). The frequency of animals with Bs in the Ada‐like group (in the Mt. Cer population) was significantly different from that in the Ada population (0.19 vs. 0.43). Differences in fB, found in phenotypically/genotypically similar groups in different habitats, point to the existence of adaptive effects of Bs at the level of populations.
Introduction
B chromosomes (Bs) are distributed across a wide range of species of almost all taxonomic groups and it is estimated that up to 15% of species possess them (Jones Citation1985). Being supernumerary to the standard karyotype, these dispensable chromosomes do not obey the laws of Mendelian inheritance and so they can evolve more or less independently from the rest of the genome. Maintenance of Bs in natural populations is generally explained by two models, both requiring equilibrium frequencies of B carriers through generations. The parasitic model proposed by Östergren (Citation1945) claims that Bs are maintained by meiotic drive alone, reaching a stable equilibrium determined by contrasting effects of fertility and drive (Jones Citation1991). The opposing heterotic model of White (Citation1973) suggests that Bs without drive can be mentioned due to beneficial effects on carriers of small number of Bs, while a large number could be deleterious. Failure in attempts to uncover the adaptive significance of the presence of Bs in natural populations, except in a few cases, has contributed to the current dominating view that Bs are genomic parasites.
Mammals harbour Bs in only 1.2% of species, so the genus Apodemus is an exception with six species found to have Bs (Vujošević & Blagojević Citation2004). Bs occur across large proportions of the ranges of the yellow‐necked mouse, Apodemus flavicollis (summarized in Kartavtseva Citation2002). Frequencies of animals with Bs range from 0.11 in Slovenia (Vujošević et al. Citation1991) up to 0.96 in the Czech Republic (Zima & Macholán Citation1995). Besides A. flavicollis, animals with Bs are frequent in populations of Apodemus argenteus and A. peninsulae. In the last species, Bs occurred in 100% of the animals in many populations (Kartavtseva & Roslik Citation2004). Contrary to that, in populations of A. sylvaticus, A. agrarius and A. mystacinus, animals with Bs occur rarely (Vujošević & Živković Citation1987; Belcheva et al. Citation1988; Kartavtseva Citation1994). The restriction of Bs to a few individuals in populations of a species may reflect the recent origin of B chromosomes, so a low frequency is a transient condition (Jones & Rees Citation1982).
It should be emphasized that the effects of Bs depend on environmental influences acting upon a population, and can be characterized by both temporal and spatial variation. Consequently, before any effect is ascribed to the presence of Bs it is necessary to check and confirm this in several populations of a particular species from different habitats and during different seasons. This is true for both phenotypic and physiological features and also for mechanisms of accumulation, which could all be under the influence of different selection pressures. All this makes detailed studies on natural populations very scarce. Clinal variation in the frequency of Bs was found in many cases. The most frequent explanation is that clines result from a greater occurrence of Bs in the optimal habitat of the species, where Bs could be tolerated more easily. However, this explanation does not apply to beneficial Bs. It also neglects the effects of site of B origin and subsequent geographic spread. In the absence of other evidence for the parasitic nature of Bs, increased frequencies of B carriers in the optimal habitat are used as a proof of parasitism. Increased frequency of B carriers could be a consequence of different selection pressures, so the true nature of Bs remains covered. This is illustrated by the fact that in some cases the frequency of B carriers is correlated (positively or negatively) with different ecological parameters and is not necessarily highest in optimal conditions. In chive, Allium schoenoprasum, B chromosomes improve survival during the early stage of the life cycle (Holmes & Bougourd Citation1989). This is the only widely accepted example of a heterotic model claiming that Bs could be beneficial in small numbers, but there are some other examples no less convincing. In the Australian plant Dampiera linearis (Bousefield & James Citation1976), Bs are advantageous for polyploids, which, contrary to diploids, are able to colonize the coastal plain. In Lolium perenne, plants with Bs have a clear advantage over those without under conditions of severe competition and stress (Hutchinson Citation1975; Toeh et al. Citation1976). Confalonieri (Citation1995) analysed a large number of populations of grasshopper Trimerotropis pallidipenis from Argentina, and found a negative association of frequencies of B‐carriers with altitude, and a positive association with longitude. A positive correlation between fB and altitude in populations of characid fish in Brazilian river basins was noticed by Porto‐Foresti et al. (Citation1997). In Apodemus flavicollis, the frequency of animals with Bs was positively correlated with altitude and average number of subzero days (Vujošević & Blagojević Citation2000), but negatively with average temperature. Zima et al. (Citation2003) found a positive correlation between body mass of males and number of Bs per animal. They proposed that Bs could positively influence growth rate giving bigger animals a higher chance of winter survival.
Geographical variation exists in all species and can be caused by adaptation to local conditions. Phenotypic diversity between individuals, populations and species is usually described in terms of the variation in external morphology. The aim of the present work was a comparison of the phenotypic variability of populations of A. flavicollis in the context of the presence of B chromosomes.
Materials and methods
Study sites
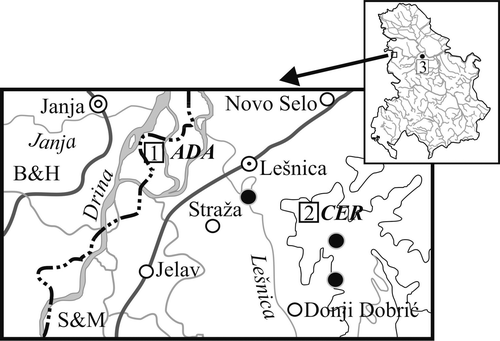
Specimens of Apodemus flavicollis were collected in Longworth traps at three localities in Serbia in the period 1989–2000 (UTM coordinates are given in brackets): Mt. Cer (CQ84), 121 animals; Ada (CQ82), 65 animals; and Mt. Avala (DQ64), 62 animals. The localities Mt. Cer (altitude 400 m) and Mt. Avala (altitude 450 m) are very alike, both being forests composed of sessile oak and hornbeam (Querco‐Carpinetum frainetto‐cerris) and Hungarian oak and Turkey oak (Quercetum frainetto‐cerris), respectively. The locality Ada (altitude 130 m) is near the river Drina and covered by forests of poplars and willows (Salici‐Populetum). The distance between Ada and Mt. Cer is less than 5 km, while Mt. Avala is about 100 km far from both (Figure ).
Figure 1 Geographic location of the three examined populations(1, Adal; 2, Mt. Cer; 3, Mt. Avala).
Sample determination
Animals were sampled according to current taxonomical determinants and knowledge of the geographic distribution of Apodemus species in Serbia (Petrov Citation1992). Since the species A. flavicollis and A. sylvaticus can occur sympatrically, even syntopically, and are morphologically indistinguishable, species determination was confirmed using acrylamide electrophoresis at four diagnostic loci, namely lactate dehydrogenase (Ldh‐1 and Ldh‐2), superoxide dismutase (Sod) and albumin (Alb) (Britton‐Davidian et al. Citation1991; Zima et al. Citation1997; Filippucci et al. Citation2002). Homogenates were made from previously frozen kidneys (−80°C) and electrophoresis was carried out according to Pasteur et al. (Citation1988).
Chromosomes were prepared directly from bone marrow using the standard procedure. The presence of Bs was confirmed by analysing 30 metaphase figures. All animals with more than 48 chromosomes were considered to have Bs.
Measurements and statistics
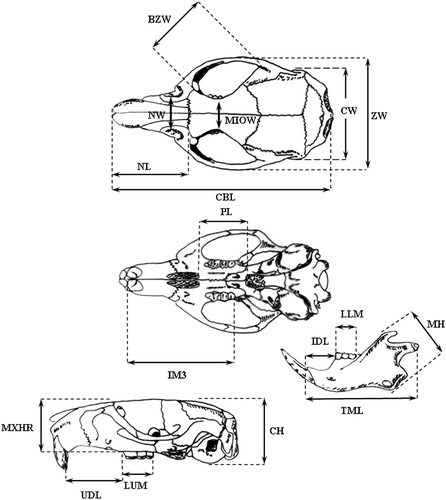
The skulls were removed and biologically prepared using Dermestes beetles. Seventeen linear mandibular and cranial variables (Figure ) are measured on each specimen using digital calipers accurate to 0.01 mm: condylobasal length (CBL); zygomatic width (ZW); nasal length (NL); cranial width (CW); bizygomatic width (BZW); nasal width (NW); minimum inter‐orbital width (MIOW); distance from the 3rd upper molar to the upper incisor (IM3); palatal length (PL); upper diastema length (UDL); length of upper molars (LUM); maximum height of rostrum (MXHR); cranial height (CH); total mandible length (TML); inferior diastema length (IDL); mandible height (MH); and length of lower molars (LLM).
Figure 2 Linear measurements taken on each skull ofApodemus flavicollis (CBL, condylobasal length; ZW, zygomatic width; NL, nasal length; CW, cranial width; BZW, bizygomatic width; NW, nasal width; MIOW, minimum inter‐orbital width; IM3, distance from the 3rd upper molar to the upper incisor; PL, palatal length; UDL, upper diastema length; LUM, length of upper molars; MXHR, maximum height of rostrum; CH, cranial height; TML, total mandible length; IDL, inferior diastema length; MH, mandible height; LLM, length of lower molars).
The error of measurement was calculated as the average percentage departure in three independent measurements in the sample of 50 randomly chosen specimens for all traits. The estimated measurement error was under 5% (range from 1.1 to 3.8%).
To homogenize variances across the size range for covariance analysis, all data were log‐transformed. Multivariate analysis of covariance (MANCOVA) was used for intrapopulational comparison between the groups of animals with (B+) and without (B0) B chromosomes.
The first step in analysing the data was to calculate linear regression against CBL for all the other measured characters. This method effectively removed allometric variation due to differences in size. The standardized residuals were then applied in multivariate statistical analyses. Principal Component Analysis (PCA), based on the correlation matrix, was carried out. Population differences in principal component scores were tested using one‐way ANOVA, and post‐hoc pairwise tests. The standardized residuals were further subjected to Discriminant Functional Analysis (DFA), exploring the variable most useful for discriminating among populations.
Results
No analysed samples showed any variation for any discriminative loci. From that and the external phenotypic features we identified all animals as yellow‐necked mice, A. flavicollis.
A total of 248 adult animals (with complete eruption of the third molar) were analysed at three localities. The frequency of animals with Bs was 0.31 on Mt. Cer, 0.19 in Ada, and 0.37 on Mt. Avala. At the Ada locality the frequency of animals with Bs was significantly lower than on Mt. Avala (χ (1) 2 = 4.82, p<0.03). The sex ratio varied between localities, but overall it was approximately one.
For each locality differences between the B0 and B+ groups for the analysed traits were tested separately using multivariate analysis of covariance (MANCOVA) with CBL as covariant. MANCOVA revealed no significant differences in cranial traits (Wilk's lambda 0.880, F = 0.84, p = n.s. for the Mt. Cer population; Wilk's lambda 0.645, F = 1.51, p = n.s. for the Ada population; Wilk's lambda 0.773, F = 0.87, p = n.s. for the Mt. Avala population).
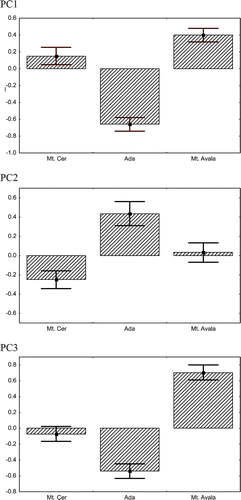
In the PCA, the first three principal component axes explained 46.2% (23.4, 13.7 and 9.1%, respectively) of total variation (Table ). All variables showed a positive loading in the first axis. This axis was assumed to represent overall size variation, while the other two probably included a shape factor and summarized 22.8% of the variation. In the second axis LLM and LUM had large positive loadings, while in the third axis MXHR and IDL had high positive loadings.
Table I. Eigenvectors of the first three principal component (PC) scores based on 16 cranial and mandible variables in Apodemus flavicollis. The variables are arranged after their principal component loadings.
Principal component scores for first three PC were significantly different between the populations (Figure ). For PC1 (ANOVA: F2,245 = 24.35; p<0.001) and PC2 (ANOVA: F2,245 = 10.81; p<0.001), Mt. Cer and Mt. Avala were not significantly different from one another but all other pairwise post‐hoc tests showed significant differences. For PC3 (ANOVA: F2,245 = 31.38; p<0.001) all populations differed significantly in post‐hoc pairwise tests. The population from Ada was significantly different from the two other populations for all principal scores.
Figure 3 Principal component scores(mean±SE with 95% confidence limits) for the three populations studied.
We used discriminant analysis to look in more detail for variables, which most explicitly differentiate between the three populations. Partial λ is associated with the unique contribution of the respective variable to the discriminatory power of the model (Table ). Seven out of 16 traits significantly discriminated among the analysed populations. The degree of differences can be clearly seen in Figure . The localities Ada and Mt. Avala, which are geographically distinct, were clearly separated by this analysis. On Mt. Cer, besides the typical main part, one part of the population is Mt. Avala‐like and another one is Ada‐like. The classification matrix (Table ) gives information about the number and proportion of correctly classified cases in each group. The highest percentage of correctly classified animals was in Ada (about 85%), and the lowest was on Mt. Cer (67%).
Table II. Canonical discriminate function (DC) and results of Discriminant Function Analysis.
Figure 4 Scatterplot of the scores for pairs of discriminant functions.
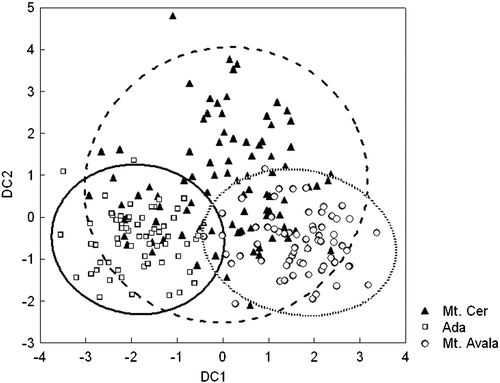
Table III. The classification matrix and percent of correctly classified cases in each population (proportional to the respective group size).
The population on Mt. Cer was composed of three groups of animals, according to DFA, and these groups differed in frequency of animals with Bs (typical Mt. Cer fB = 0.25, Ada‐like group fB = 0.43, and Avala‐like group fB = 0.29). Among these three morphologically different groups, only the Ada‐like group was significantly different in frequency of animals with Bs in comparison to the original Ada (χ (1) 2 = 5.67 p = 0.017) group, indicating that frequency of Bs varied with change of habitat type.
Discussion
The frequency of animals with Bs in a population depends on the average rate of transmission, their effects (detriment or benefit) and random changes. The main requirement for Bs to be parasitic is the existence of an accumulating mechanism. No accumulating mechanism was found in A. flavicollis, but only an imperfect equilibrium, sensu White (Citation1973). Namely, the frequencies of Bs through the year could be significantly different (Blagojević & Vujošević Citation1995) or the same (Vujošević & Blagojević Citation1995), but their values between years remained stable (Vujošević Citation1992). Besides that, it was found that expression of three genes is altered in genomes with Bs (Tanić et al. Citation2005). In the absence of an accumulation mechanism, it is logical to postulate that Bs confer a selective advantage in populations which are at equilibrium.
The localities Mt. Cer and Ada are very close to one another. Mt. Cer is of volcanic origin in the middle of a plain. It is a typical forest system with dominating beech and oak. Ada is less than 5 km far from Mt. Cer and is surrounded by two rivers and their meanders. These two localities, which were connected in the recent past by forest, are now separated by agricultural fields and rivers (Figure ). These barriers are unstable. While they are present these barriers diminish migration between the two localities. Discriminant analysis showed that on Mt. Cer there are three morphological groups of animals, one more similar to the Ada population, the other Mt. Avala‐like, while the third group represents the typical Mt. Cer population. These three groups, which are pools of similar genotypes, differ in frequency of B carriers. However, the Ada‐like group has a significantly higher frequency of B carriers in comparison to the Ada population. The fact that Ada is a quite different habitat, indicates possible adaptive effects of Bs. These effects can be positive in a certain environment (Vujošević & Blagojević Citation2000) but negative in others. If Bs are maintained as parasites, and are stowaways of certain genotypes, then their frequency would stay the same in these groups despite differences in local environments. However, this is not the case.
The degree of difference between populations of species ranges from almost complete identity to distinctness almost at the species level (Mayr Citation1963). The morphological differences observed between the Mt. Avala and Ada populations are almost at the level that Barčiová and Macholán (Citation2005) found between the species A. flavicollis and A. sylvaticus in the Czech Republic. The amount of genetic variability for the traits under selection represents essential information for evaluation of a population's potential for evolutionary change. Charmantier and Garant (Citation2005) provide evidence for significantly increased heritability in wild populations for morphometric traits in more favourable conditions, but not for traits more closely related to fitness.
Laboratory and field observations suggest that A. flavicollis, a woodland rodent, may restrict its sympatric congener A. sylvaticus to grassland in northern Europe (Hoffmeyer Citation1973). We excluded the presence of A. sylvaticus in the analysed localities by allozyme analysis, so A. flavicollis inhabited all available habitats. Different local environmental conditions through different selection pressures can alter phenotypic characters and can produce phenotypic diversity between individuals, populations and species. Morphology reflects an adaptation to the habitat and feeding niche. Therefore, the differences obtained for traits that could be connected with feeding, namely, maximum height of rostrum (MXHR) and length of lower molar (LLM) and distance from the 3rd upper molar to the upper incisor (IM3) could be the result of different food sources available in the Ada locality. The other possibilities are that these changes are connected with olfactory function or differences in behaviour. In A. flavicollis, interpopulation variability at the phenotypic level is great and according to our findings is dependent upon type of habitat (Vujošević et al. Citation2007). Based on allozyme analysis of 121 populations from 10 species of the genus Apodemus, Filippucci et al. (Citation2002) found that A. flavicollis has the highest genetic diversity after A. mystacinus which has fragmented areal. The high phenotypic substructuring of populations of A. flavicollis found by us could explain the high genetic diversity obtained by allozyme analyses.
Several studies showed that genetic variation and genetic correlations vary across environments (reviews by Hoffmann & Parsons Citation1991; Stearns et al. Citation1991; Hoffmann & Merilä Citation1999), indicating that environment‐specific evolutionary responses to the same selection pressures may occur. The adaptive effects of Bs could result from their influence on the overall genetic variability in populations, so it could be said that Bs are affecting adaptability rather than producing adaptation.
Acknowledgements
This work was supported by the Ministry of Science of Serbia, Contract No. 143011.
References
- Barčiová , L. and Macholán , M. 2005 . Morphometric study of two species of wood mice Apodemus sylvaticus and A. flavicollis (Rodentia: Muridae): Traditional and geometric morphometric approach. . Acta Theriologica , 51 : 15 – 27 .
- Belcheva , R. G. , Topashka‐Ancheva , M. N. and Atanassov , N. 1988 . Karyological studies of five species of mammals from Bulgarian fauna. . Comptes rendus de l'Académie bulgare des Sciences , 42 : 125 – 128 .
- Blagojević , J. and Vujošević , M. 1995 . The role of B chromosomes in to the population dynamics of yellow‐necked wood mice Apodemus flavicollis (Rodentia, Mammalia). . Genome , 38 : 472 – 478 .
- Bousefield , R. L. and James , S. H. 1976 . The behaviour and possible cytoevolutionary significance of B chromosomes in Dampiera linearis (Angiospermae: Goodeniaceae). . Chromosoma , 55 : 309 – 323 .
- Britton‐Davidian , J. , Vahrnouch , M. , Benmehdi , F. , Gros , P. , Nancé , V. , Croset , H. , Guerassimov , S. and Triantaphyllidis , C. 1991 . Genetic differentiation in four species of Apodemus from Southern Europe: A. sylvaticus, A. flavicollis, A. agrarius and A. mystacinus (Muridae, Rodentia). . Zeitschrift für Säugetierkunde , 56 : 25 – 33 .
- Charmantier , A. and Garant , D. 2005 . Environmental quality and evolutionary potential: lessons from wild populations. Proceedings of the Royal Society of London. . Series B: Biological Sciences (London) , 275 : 1415 – 1425 .
- Confalonieri , V. A. 1995 . Macrogeographic patterns in B‐chromosome and inversion polymorphisms of the grasshopper Trimerotropis pallidipenis. . Genetics Selection Evolution , 27 : 305 – 311 .
- Filippucci , M. G. , Macholán , M. and Michaux , R. J. 2002 . Genetic variation and evolution in the genus Apodemus (Muridae: Rodentia). . Biological Journal of Linnean Society , 75 : 395 – 419 .
- Hoffman , A. A. and Merilä , J. 1999 . Heritable variation and evolution under favourable and unfavourable conditions. . Trends in Ecology & Evolution , 14 : 96 – 101 .
- Hoffman , A. A. and Parsons , P. A. 1991 . Evolutionary genetics and environmental stress , Oxford : Oxford University Press .
- Hoffmeyer , I. 1973 . Interaction and habitat selection in the mice Apodemus flavicollis and A. sylvaticus. . Oikos , 24 : 108 – 116 .
- Holmes , D. S. and Bougourd , S. M. 1989 . B‐chromosome selection in Allium schenoprasum. I. Natural populations. . Heredity , 63 : 83 – 87 .
- Hutchinson , J. 1975 . Selection of B chromosomes in Secale cereale and Lolium perenne. . Heredity , 34 : 39 – 52 .
- Jones , R. N. 1985 . “ Are B‐chromosomes selfish? ” . In The evolution of genome size , Edited by: Cavalier‐Smith , T . 397 – 425 . London : John Wiley & Sons .
- Jones , R. N. 1991 . B‐chromoseome drive. . American Naturalist , 137 : 430 – 442 .
- Jones , R. N. and Rees , H. 1982 . B chromosomes , 241 London : Academic Press .
- Kartavtseva , I. V. 1994 . Description of B‐chromosomes in karyotype of field mouse Apodemus agrarius. . Tsitologiia i Genetika (Kiev) , 28 : 96 – 97 .
- Kartavtseva , I. V. 2002 . Karyosystematics of wood and field mice (Rodentia, Muridae) , 140 Vladivostok : Dalnauka .
- Kartavtseva , I. V. and Roslik , G. V. 2004 . A complex B chromosome system in the Korean field mouse, Apodemus peninsulae. . Cytogenetic and Genome Research , 106 : 271 – 279 .
- Mayr , E. 1963 . Animal species and evolution , Cambridge, MA : Harvard University Press .
- Östergren , G. 1945 . Parasitic nature of extra fragment chromosomes. . Bot Notiser , 2 : 157 – 163 .
- Pasteur , N. , Pasteur , G. , Bonhomme , F. , Catalan , J. and Britton‐Davidian , J. 1988 . Practical isoenzym genetics , Chichester, , UK : Ellis Horwood Limited .
- Petrov , M. B. 1992 . Mammals of Yugoslavia – insectivores and rodents. . National History Museum , Suppl. 37, Beograde : 3 – 31 .
- Porto‐Foresti , F. , Oliveira , C. , Maistro , E. L. and Foresti , F. 1997 . Estimated frequency of B‐chromosomes and population density of Astyanax scabripinnis paranea in a small stream. . Brazilian Journal of Genetics , 20 : 377 – 380 .
- Stearns , S. , de Jong , G. and Newman , B. 1991 . The effects of phenotypic plasticity on genetic correlations. . Trends in Ecology & Evolution , 6 : 122 – 126 .
- Tanić , N. , Vujošević , M. , Dedović‐Tanić , N. and Dimitrijević , B. 2005 . Differential gene expression in yellow‐necked mice Apodemus flavicollis (Rodentia, Mammalia) with and without B chromosomes. . Chromosoma , 113 : 418 – 427 .
- Toeh , S. B. , Rees , H. and Hutchinson , J. 1976 . B chromosome selection in Lolium. . Heredity , 37 : 207 – 213 .
- Vujošević , M. 1992 . B‐chromosome polymorphism in Apodemus flavicollis (Rodentia, Mammalia) during five years. . Caryologia , 3–4 : 347 – 352 .
- Vujošević , M. and Blagojević , J. 1995 . Seasonal changes of B‐chromosome frequencies within the population of Apodemus flavicollis (Rodentia) on Cer mountain in Yugoslavia. . Acta Theriologica , 40 : 131 – 137 .
- Vujošević , M. and Blagojević , J. 2000 . Does environment affect polymorphism of B chromosomes in the yellow‐necked mouse Apodemus flavicollis? . Zeitschrift für Säugetierkunde , 65 : 313 – 317 .
- Vujošević , M. and Blagojević , J. 2004 . B chromosomes in populations of mammals. . Cytogenetic and Genome Research , 106 : 247 – 256 .
- Vujošević , M. , Blagojević , J. , Radosavljević , J. and Bejaković , D. 1991 . B chromosome polymorphism in populations of Apodemus flavicollis in Yugoslavia. . Genetica , 83 : 167 – 170 .
- Vujošević , M. , Jojić , V. , Bugarski Stanojević , V. and Blagojević , J. 2007 . Habitat quality and B chromosomes in the yellow‐necked mouse Apodemus flavicollis. . Italian Journal of Zoology , 74 : 313 – 316 .
- Vujošević , M. and Živković , S. 1987 . Numerical chromosome polymorphism in Apodemus flavicollis and A. sylvaticus (Mammalia: Rodentia) caused by supernumerary chromosomes. . Acta Veterinaria (Beograd) , 37 : 81 – 92 .
- White , M. J. D. 1973 . Animal cytology and evolution , Cambridge : Cambridge University Press . 3rd ed
- Zima , J. and Macholán , M. 1995 . B chromosomes in the wood mice (genus Apodemus). . Acta Theriologica , 3 : 75 – 86 .
- Zima , J. , Macholán , M. and Slivkova , L. 1997 . Conformation of the presence of B chromosomes in the wood mice Apodemus sylvaticus. . Folia Zooogica , 46 : 217 – 221 .
- Zima , J. , Piálek , J. and Macholán , M. 2003 . Possible heterotic effects of B chromosomes on body mass in a population of Apodemus flavicollis. . Cannadian Journal of Zoology , 81 : 1312 – 1317 .