
Abstract
Our study focuses on the morphological parameters of bone growth and bone formation in Sprague–Dawley (SD) rats of different ages, using fluorochrome labeling in vivo. We concluded that bone longitudinal growth rate (LGR) and bone mineral apposition rate (MAR) were significantly increased in both the 1- and 3-month-old rats compared with the 6- and 14-month-old rats, and that of the parameters were significantly decreased in both the 6- and 14-month-old rats. Meanwhile, bone formation rate (BFR) and percent labeled perimeter (%L.Pm) peaked in 3-month-old rats, and were followed by remarkable decrease with aging. In the present study, static parameters including percent trabecular area (%Tb.Ar), trabecular thickness (Tb.Th) and trabecular number (Tb.N), contrary to previous reports, progressively increased, whereas trabecular separation (Tb.Sp) reduced with increasing age. Furthermore, bone mass increased for 14-month-old rats due to the significantly decreased bone turnover rate.
Introduction
Jilka (Citation2003) has previously reported that bones are renewed throughout life through bone remodeling, but bone growth and metabolism tend to be stable along with decreases in bone length and bone formation in female rats aged from 6 to 10 months (Berg & Harmison Citation1957). There were further signs of diminished osteogenesis and irregular trabeculae in rats older than 10 months, and the changes were more remarkable, including the progressive closure of epiphyses, with increasing age (Berg & Harmison Citation1957; Wronski et al. Citation1989; Trudel et al. Citation2001). Although bone mass and bone turnover in rats of different ages have been reported (Stark et al. Citation1996; Wolfe & Klein Citation1996; Hefferan et al. Citation2003; Nissen-Meyer et al. Citation2007), the changes in bone growth parameters, especially longitudinal growth rate (LGR), mineral apposition rate (MAR), bone formation rate (BFR) and bone turnover rate in rats different ages such as 1, 3, 6 and 14 months old, have not yet been systematically documented. In the present study, morphological parameters of bone formation in different ages of Sprague–Dawley (SD) rats were evaluated by in vivo fluorochrome labeling with tetracycline hydrochloride and calcein, which can form chelates with calcium ions and can be deposited in osteoid mineralization zones to form new bone surface; ample fluorescence sedimentary zones meant abundant local bone formation (Erben Citation1997). Obvious yellow (tetracycline) and green (calcein) fluorescence sedimentary zones can be found under ultraviolet light using a fluorescence microscope, and dynamic parameters of bone formation can be measured in this way according to the previous data. Static parameters of percent trabecular area (%Tb.Ar), trabecular thickness (Tb.Th), trabecular number (Tb.N) and trabecular separation (Tb.Sp), and dynamic parameters of LGR, percent labeled perimeter (%L.Pm), MAR and BFR were measured using a bone histomorphometric measurement system. Using the dynamic/static parameters, we can evaluate the changes in morphological parameters of bone growth and bone formation in different ages of SD rats in a more detailed and intuitive fashion.
Materials and methods
Materials
Tetracycline hydrochloride and calcein were purchased from Sigma Co., Inst, China. Sodium pentobarbital was purchased from Hubei Far City Pharmaceutical Co., Hubei, China. Methylmethacrylate was purchased from Tianjin Damao Chemical Factory, China. Silver nitrate was obtained from Tianjin Tian Gan Chemical Industry Technology Development Co., Ltd., China.
Animals
Twenty-four SD rats of different ages were supplied by the Laboratory Animal Center of Guangdong Medical College [Permit Number: SYXK (GUANGDONG) 2008–0007]. The rats were housed individually at 23 ± 2°C with a 12 h/12 h light/dark cycle; food and water were provided ad libitum to the animals. Animals were acclimatized for 1 week before the experiment started.
All procedures were implemented in accordance with the criterion for the Care and Use of Laboratory Animals of Guangdong Laboratory Animal Monitoring Institute under the National Laboratory Animal Monitoring Institute of China, and approved by the Academic Committee on the Ethics of Animal Experiments of the Guangdong Medical College, Zhanjiang, China.
Bone histomorphometry
Twenty-four SD rats at ages of 1, 3, 6 and 14 months were divided into four groups of six animals each according to their respective ages. Fluorochrome labeling was administered on days 13 and 14 with tetracycline hydrochloride (25 mg/kg), and on days 3 and 4 with calcein (5 mg/kg) before the rats sacrificed, respectively. At autopsy, all rats were killed by cardiac puncture under sodium pentobarbital anesthesia. The right tibia was dissected and the marrow cavity was exposed using an isomet low-speed saw (Buechler Ltd., USA). The proximal tibial metaphyses (PTM) were fixed in 10% phosphate buffer formalin for 24 h, then dehydrated in graded ethanols, defatted in xylene and embedded undecalcified in modified methylmethacrylate (Baron et al. Citation1983; Dehority et al. Citation1999). Undecalcified frontal sections (8 μm thickness) were cut with a microtome (Leica RM2155, Germany), followed by silver nitrate staining for static histomorphometric analysis; dynamic histomorphometric analysis of fluorochrome labeling was performed on unstained sections. Static and dynamic histomorphometric indices were performed in the tibial secondary spongiosa of the PTM between 1 and 4 mm distal to the growth plate–epiphyseal junction according to the methods of Jee et al. (Citation1983) and Parfitt et al. (Citation1987), with a digitizing image analysis system (Nikon eclipse 80i, Japan) used for quantitative bone histomorphometric measurements. Static measurements included tissue area (T.Ar), trabecular area (Tb.Ar) and trabecular perimeter (Tb.Pm). Dynamic measurements included trabecular single-labeled perimeter (sL.Pm), double-labeled perimeter (dL.Pm), interlabel width (Int.Wi) and interlabel width in growth plate (G-Int.Wi). The static and dynamic histomorphometric parameter measurements and their abbreviations are listed in . The static parameters were used to determine %Tb.Ar, Tb.Th, Tb.N and Tb.Sp. The dynamic parameters were used to determine %L.Pm, MAR, LGR and bone formation rate per unit of bone surface (BFR/BS), per unit of bone volume (BFR/BV) and per unit of tissue volume (BFR/TV) (Cui et al. Citation2001a, Citation2012). The static and dynamic parameters formulas are listed in (Cui et al. Citation2001b).
Table I. Measurements of proximal tibial metaphyseal cancellous bone.
Table II. Static- and dynamic-parameter formulas.
Statistical analysis
Data are expressed as mean ± standard deviation (SD). Statistically significant differences were determined using analysis of variance (ANOVA) with the two-tailed Student’s t-test, and P < 0.05 was considered to be the level of significance.
Results
Effect of LGR in the growth plate on PTM
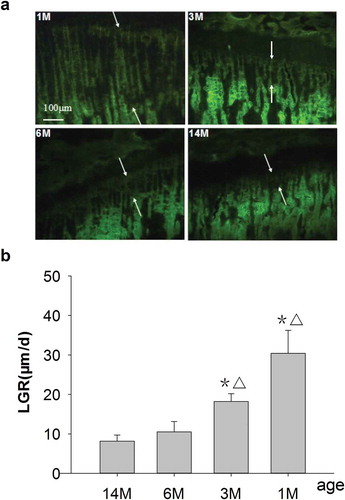
As shown in , both the 1- and 3-month-old rats exhibited wider interlabel width and higher LGR, 30.4 and 18.2 μm/d, respectively, and all changes were statistically significant compared with 6- and 14-month-old rats. For the 6-month-old rats, the interlabel width of the growth plate was narrower and LGR was 10 μm/d, which decreased by 66.7% compared to that 1-month-old rats; however, there were no differences compared to 14-month-old rats (8 μm/d). The interlabel width of the growth plate was narrowest for 14-month-old rats.
Figure 1. (a) Representative fluorescence micrographs of G-Int.Wi on PTM (undecalcified sections, 8 μm, 10×). 1M: 1 month old, 3M: 3 months old, 6M: 6 months old, 14M: 14 months old. Arrows point to interlabel width after fluorochrome labeling with tetracycline hydrochloride and calcein. The interlabel width in the growth plate for 1-month-old rats was obviously wider than that for other groups, and it declined progressively with increasing age and was narrowest for 14-month-olds. The interlabel width in the growth plate was used to determine LGR. Quantitative measurements of LGR are shown in Figure 1b. (b) Changes of LGR in different ages rats. Data are expressed as means ± SD (n = 6) in each group. LGR was significantly increased in 1- and 3-month-old rats vs. 6- and 14-month-old rats, respectively, and with no differences for 6-month-old rats versus 14-month-old rats. Vs. 14-month-old,*P < 0.01; vs. 6-month-old, ▵P < 0.01, Student’s t-test. PTM, the proximal tibial metaphyses; LGR, longitudinal growth rate; G-Int.Wi, interlabel width in growth plate; 1M: 1-month-old, 3M: 3-month-old, 6M: 6-month-old, 14M: 14-month-old.
Effect of single fluorescence on PTM
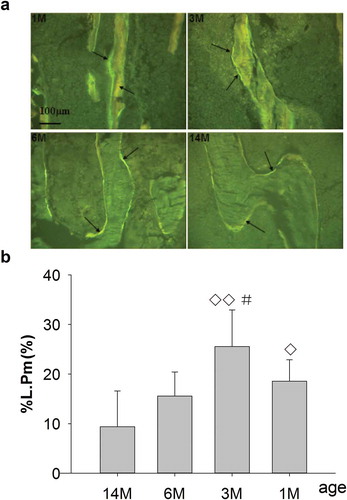
The clear and abundant single fluorescence as well as slender trabeculae were shown in both 1- and 3-month-old rats. With aging, the trabecular fluorescence quantity reduced and darkened gradually, accompanied by progressive broadening and coarsening of trabeculae (). %L.Pm were 18.6% for 1-month-old rats, which was significantly increased by 49.6% versus 14-month-old rats (only 9.37%); however, there were no distinct differences versus 6-month-old rats (dropped to 15.6%). And %L.Pm peaked at 25.6% for 3-month-old rats, which was significantly increased by 39.1% versus 6-month-old rats and by 63.4% versus 14-month-old rats, respectively, but with no differences in %L.Pm for 6-month-old rats versus 14-month-old rats ().
Figure 2. (a) Representative single-fluorescence micrographs of PTM in different ages rats (undecalcified sections, 8 μm, 20×). 1M: 1 month old, 3M: 3 months old, 6M: 6 months old, 14M: 14 months old. The clear and abundant single fluorescence could be seen in 1- and 3-month-old rats. There was less single fluorescence for 6-month-old rats and the minimum for 14-month-old rats, compared with 1- and 3-month-old rats. Arrows point to single fluorescence after fluorochrome labeling with tetracycline hydrochloride and calcein. Quantitative measurements of single fluorescence are shown in Figure 2b. (b) Changes of %L.Pm in rats of different ages. Data are expressed as means ± SD (n = 6) in each group. There were no significant differences in %L.Pm for 1-month-old rats vs. 6-month-old rats; however, this was significantly increased vs. 14-month-old rats, and significantly increased for 3-month-old vs. 6- and 14-month-old rats, respectively. Furthermore, there were no differences in %L.Pm for 6-month-old rats vs. 14-month-old rats. Vs. 14-month-old, ◊P < 0.05, ◊◊P < 0.01; vs. 6-month-old, #P < 0.05, Student’s t-test. PTM, the proximal tibial metaphyses; %L.Pm, percent labeled peri meter; 1M: 1-month-old, 3M: 3-month-old, 6M: 6-month-old, 14M: 14-month-old.
Effect of double fluorescence on PTM
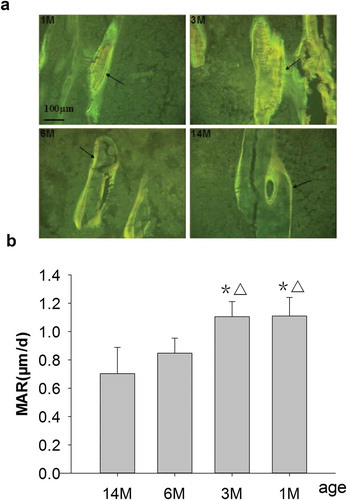
As shown in , a wider and longer double-fluorescence interval as well as an obvious yellow and green fluorescent strip was seen for 1- and 3-month-old rats. MAR, at 1.1 μm/d in both 1- and 3-month-old rats, was significantly increased compared with 6- and 14-month-old rats, respectively. The double-fluorescence interval, narrower and shorter than in 1- and 3-month-old rats, exhibited an obvious yellow and green fluorescent strip for 6-month-old rats. MAR was 0.85 μm/d for 6-month-old rats, which decreased by 23% versus 1- and 3-month-old rats, but without significant differences versus 14-month-old rats. For the 14-month-old rats, the double-fluorescence interval was narrowest and shortest, and MAR was only 0.7 μm/d, which decreased by 36.4% as compared to 1- and 3-month-old rats ( and ).
Figure 3. (a) Representative double-fluorescence micrographs of PTM in rats of different ages (undecalcified sections, 8 μm, 20×). 1M: 1 month old, 3M: 3 months old, 6M: 6 months old, 14M: 14 months old. A wider and longer double-fluorescence interval as well as an obvious yellow and green fluorescent strip could be seen in both 1- and 3-month-old rats, and these were narrower and shorter for 6-month-old rats and narrowest and shortest for 14-month-old rats. Arrows point to double fluorescence after fluorochrome labeling with tetracycline hydrochloride and calcein. Quantitative measurements of double fluorescence are shown in Figure 3b. (b) Changes of MAR in rats of different ages. Data are expressed as means ± SD (n = 6) in each group. MAR was significantly increased in 1- and 3-month-old rats vs. 6- and 14-month-old rats, respectively, and there were no differences for 6-month-old rats vs. 14-month-old rats. Vs. 14-month-old, *P < 0.01; vs. 6-month-old, ▵P < 0.01, Student’s t-test. PTM, the proximal tibial metaphyses; MAR, mineral apposition rate; 1M: 1-month-old, 3M: 3-month-old, 6M: 6-month-old, 14M: 14-month-old.
Effect of BFR on PTM
As shown in , Bone formation rates (BFR/BS, BFR/BV, BFR/TV) were 20.48 μm/d*100, 290.86%/year, 28.80%/year for 1-month-old rats, peaked at 28.67 μm/d*100, 335.20%/year, 33.08%/year for 3-month-old rats, and decreased by 52.6, 61.9 and 43.3% for 6-month-old rats and by 73.5, 80.1 and 65.5% for 14-month-old rats compared to 3-month-old rats. Both BFR/BS and BFR/BV were significantly increased in the 1- and 3-month-old rats compared with the 6- and 14-month-old rats, respectively. There were non-significant increases in BFR/TV for 1- and 3-month-old rats compared to 6-month-old rats, but with significant increases compared with 14-month-old rats, respectively. Furthermore, no significant differences in BFR/BS, BFR/BV or BFR/TV were found in 6-month-old rats compared with 14-month-old rats.
Figure 4. Changes in bone formation, including BFR/BS, BFR/BV, BFR/TV, on PTM in rats of different ages. 1M: 1 month old, 3M: 3 months old, 6M: 6 months old, 14M: 14 months old. (a) Changes of BFR/BS on PTM. (b) Changes of BFR/BV on PTM. (c) Changes of BFR/TV on PTM. BFR/BS and BFR/BV, which peaked for 3-month-old rats, were significantly increased in 1- and 3-month-old rats compared with 6- and 14-month-old rats, respectively. Also, BFR/TV were significantly increased for 1- and 3-month-old rats compared to 14-month-old rats, whereas there were no differences compared to 6-month-old rats, respectively. Data are expressed as means ± SD (n = 6) in each group. Vs. 14-month-old, ◊P < 0.05, ◊◊ P < 0.01; vs. 6-month-old, #P < 0.05, ##P < 0.01, Student’s t-test. PTM, the proximal tibial metaphyses; bone formation rate per unit of bone surface (BFR/BS), per unit of bone volume (BFR/BV) and per unit of tissue volume (BFR/TV). 1M: 1-month-old, 3M: 3-month-old, 6M: 6-month-old, 14M: 14-month-old.
Effect of static parameters on PTM
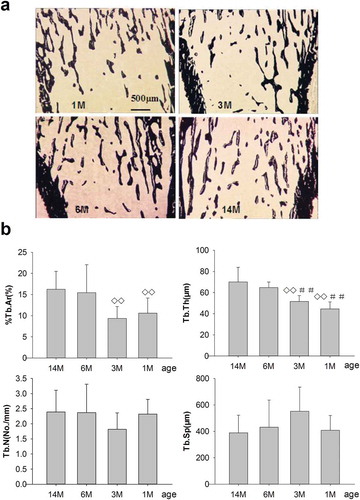
%Tb.Ar for 1- and 3-month-old rats showed no differences compared with 6-month-old rats, but were significantly increased compared with 14-month-old rats. Meanwhile, Tb.Th was significantly increased in 1- and 3-month-old rats compared with 6- and 14-month-old rats, respectively. However, non-significant increases in Tb.N and decreases in Tb.Sp were shown for 1- and 3-month-old rats versus 6- and 14-month-old rats, respectively. All of the static parameters including %Tb.Ar, Tb.Th, Tb.N, and Tb.Sp showed no significant differences for 6-month-old rats compare to 14-month-old rats. To summarize, %Tb.Ar, Tb.Th and Tb.N increased progressively whereas Tb.Sp reduced gradually with aging, as shown in .
Figure 5. (a) Effects of bone structure and trabecular mass on PTM in rats of different ages. 1M: 1 month old, 3M: 3 months old, 6M: 6 months old, 14M: 14 months old. Slender and interlacing trabeculae were found in 1- and 3-month-old rats. Cancellous bone mass was increased and trabeculae were thickened in 6-month-old rats compared with 1- and 3-month-old rats. Meanwhile, slight increases in cancellous bone mass were seen for 14-month-old rats compared to 6-month-old rats (silver nitrate stain, 4×; trabecular in black stain). Quantitative measurements of static parameters are shown in . (b) Static parameters of %Tb.Ar, Tb.Th, Tb.N and Tb.Sp, on the proximal tibia in rats of different ages. Data are expressed as means ± SD (n = 6) in each group. %Tb.Ar, percent trabecular area; Tb.Th, trabecular thickness; Tb.N, trabecular number; Tb.Sp, trabecular separation. %Tb.Ar, Tb.Th and Tb.N increased progressively, whereas Tb.Sp reduced gradually with aging. Vs. 14-month-old, ◊◊ P < 0.01; vs. 6-month-old, ##P < 0.01, Student’s t-test. PTM, the proximal tibial metaphyses; Tb.Ar, trabecular area; Tb.Th, trabecular thickness; Tb.N, trabecular number; Tb.Sp, trabecular separation. 1M: 1-month-old, 3M: 3-month-old, 6M: 6-month-old, 14M: 14-month-old.
Discussion
It is well known that LGR of growth plate represents longitudinal bone growth. Li et al. (Citation1991) reported that LGR sharply dropped to 10 μm/d in female rats aged from 3–7 months, and further declined between 8 and 11 months old; more importantly, it stopped growing altogether in rats older than 12 months. Sontag (Citation1986) assumed that at least in male rats, longitudinal growth continues throughout life, but Stark et al. (Citation1996), found that in some of the male rats they studied, longitudinal growth was almost completed at the age of 34 weeks (Stark et al. Citation1996). The present study showed that LGR was as high as 30.4 μm/d for 1-month-old rats, which indicated that longitudinal bone growth was fast, and that was reduced to 18.2 μm/d along with slower longitudinal bone growth for 3-month-old rats; furthermore, it dropped markedly to 10.5 μm/d for 6-month-old and 8.1 μm/d for 14-month-old rats, respectively. These results are in agreement with those of Li (Citation1991).
Interlabel width, indicating bone calcium deposition rate in a certain time, reflects osteoblast formation activity, i.e. wider interlabel width and higher osteoblast activity. The wider and longer interlabel width along with the obvious fluorescent strip for 1- and 3-month-old rats meant higher osteoblast activity. Our study has demonstrated that bone mineralization was high and osteoblast activities were active for 1-month-old rats, and this peaked in 3-month-old rats, contributing to fast bone growth. The remarkable decrease of %L.P m and MAR for 6-month-old rats, compared with 1- and 3-month-old rats, indicated that bone mineralization and osteoblast activity had declined, therefore leading to slower bone growth, and all of which further declined, nevertheless, indistinctive in 14-month-old rats compared to 6-month-old rats.
The relationship between bone formation and bone turnover reflected the balance between bone formation by osteoblasts and bone absorption by osteoclasts, and the balanced actions of these two cell types are very important for the normal homeostasis of the skeletal system in adults (Kim et al. Citation2009). High BFR/BS for 1- and 3-month-old rats suggested that bone surface and bone formation were active. High BFR/BV, peaking in 3-month-old rats, indicated a positive balance between bone formation and bone absorption so as to increase bone mass, which is consistent with previous reports (Nissen-Meyer et al. Citation2007). The formation of new bone was supported by ample bone mass that provided abundant trabecular surfaces; meanwhile, more new bone formation on the unit length was supported by active bone formation. BFR/TV, affected by bone mass and bone formation activity, was high in 1- and 3-month-old rats, implying ample new bone formation and more active osteoblasts. For the 6-month-old rats, decreases in bone surface activity, bone formation and bone turnover as well as the balance between bone formation and bone absorption suggests that bones kept growing slowly. And the lowest BFR/BS, BFR/BV and BFR/TV in 14-month-old rats led to the slowest bone growth.
Slender and interlacing trabeculae could be seen in 1- and 3-month-old rats by silver nitrate staining. With increasing age, bone trabecular number increased gradually, accompanied by progressive broadening and coarsening trabeculae as well as narrowing trabecular space. Quantitative measurements showed that trabecular thickness and bone mass increased along with declining trabecular separation for 6-month-old rats, which was consistent with the results shown by silver nitrate staining. Static parameters showed that trabecular thickness and bone mass kept increasing slowly; however, with non-significant changes for 14-month-old rats compared to 6-month-old rats.
In this study, greater bone mineralization and higher bone formation rates as well as active osteoblast activity were seen in 1-month-old rats and these peaked in 3-month-old rats; however, bone mass kept increasing slowly with aging. For 6-month-old rats, bone mass was greater than that of 1- and 3-month-old rats, whereas bone grew slowly due to a lower bone formation rate that resulted from the lower bone surface activity and bone turnover rate. A slight increase in bone mass was shown for 14-month-old rats compared to 6-month-old rats; furthermore, bone surface activity and bone turnover rate further declined, which, eventually led to the lowest bone formation rate and slowest bone growth.
In conclusion, our study strongly suggests that osteoblast activity was highest, and bone mineralization, bone formation rate as well as bone growth were greatest, in 3-month-old rats, but all of these declined with aging. It was reported that bone mass tended to be stable in female SD rats aged from 4 to 12 months, and, following a remarkable decrease in rats older than 12 months, there were corresponding increases in trabecular separation with aging (Wronski et al. Citation1989; Li et al. Citation1991). Stark et al. stated that bone mass doubled in male rats at the age of 5–12 months (Stark et al. Citation1996). In our study, there were increases but not reductions in bone mass for 14-month-old rats resulting from the lowest bone turnover rate.
Acknowledgements
This project was supported by the Science & Technology Innovation Fund of Guangdong Medical College (STIF201112). The authors wish to thank Dr. Yunsheng Huang for his contributions to the English language editing and grammar correction of the manuscript; thanks are also due for his suggestions on preparing the manuscript.
References
- Baron R, Vignery A, Neff L, Silverglate A, Santa Maria A. 1983. Processing of undecalcified bone specimens for bone histomorphometry. Bone Histomorphometry: Techniques and Interpretation 1:13–35.
- Berg BN, Harmison CR. 1957. Growth, disease, and aging in the rat. Journal of Gerontology 12:370–377. doi:10.1093/geronj/12.4.370.
- Cui L, Li T, Liu Y, Zhou L, Li P, Xu B, Huang L, Chen Y, Liu Y, Tian X, Jee WS, Wu T. 2012. Salvianolic acid B prevents bone loss in prednisone-treated rats through stimulation of osteogenesis and bone marrow angiogenesis. PLoS One 7:e34647. doi:10.1371/journal.pone.0034647.
- Cui L, Ma YF, Yao W, Zhou H, Setterberg RB, Liang TC, Jee WS. 2001a. Cancellous bone of aged rats maintains its capacity to respond vigorously to the anabolic effects of prostaglandin E2 by modeling-dependent bone gain. Journal of Bone and Mineral Metabolism 19:29–37. doi:10.1007/s007740170057.
- Cui L, Wu T, Li Q, Lin L, Liang N. 2001b. Preventive effects of ginsenosides on osteopenia of rats induced by ovariectomy. Acta Pharmacologica Sinica 22:428.
- Dehority W, Halloran BP, Bikle DD, Curren T, Kostenuik PJ, Wronski TJ, Shen Y, Rabkin B, Bouraoui A, Morey-Holton E. 1999. Bone and hormonal changes induced by skeletal unloading in the mature male rat. American Journal of Physiology 276:E62–E69.
- Erben RG. 1997. Embedding of bone samples in methylmethacrylate: an improved method suitable for bone histomorphometry, histochemistry, and immunohistochemistry. Journal of Histochemistry and Cytochemistry 45:307–313. doi:10.1177/002215549704500215.
- Hefferan T, Evans G, Lotinun S, Zhang M, Morey-Holton E, Turner RT. 2003. Effect of gender on bone turnover in adult rats during simulated weightlessness. Journal of Applied Physiology 95:1775–1780.
- Jee W, Inoue J, Jee K, Haba T. 1983. Histomorphometric assay of the growing long bone. Handbook of Bone Morphology. Niigata City: Nishimura. pp. 101.
- Jilka RL. 2003. Biology of the basic multicellular unit and the pathophysiology of osteoporosis. Medical and Pediatric Oncology 41:182–185. doi:10.1002/mpo.10334.
- Kim T, Kim K, Lee SH, So H-S, Lee J, Kim N, Choi Y. 2009. Identification of LRRc17 as a negative regulator of receptor activator of NF-κB Ligand (RANKL)-induced osteoclast differentiation. Journal of Biological Chemistry 284:15308–15316. doi:10.1074/jbc.M807722200.
- Li X, Jee W, Ke H, Mori S, Akamine T. 1991. Age-related changes of cancellous and cortical bone histomorphometry in female Sprague-Dawley rats. Cells and Materials (Suppl) 1:25–35.
- Nissen-Meyer LS, Jemtland R, Gautvik VT, Pedersen ME, Paro R, Fortunati D, Pierroz DD, Stadelmann VA, Reppe S, Reinholt FP, Del Fattore A, Rucci N, Teti A, Ferrari S, Gautvik KM. 2007. Osteopenia, decreased bone formation and impaired osteoblast development in Sox4 heterozygous mice. Journal of Cell Science 120:2785–2795. doi:10.1242/jcs.003855.
- Parfitt AM, Drezner MK, Glorieux FH, Kanis JA, Malluche H, Meunier PJ, Ott SM, Recker RR. 1987. Bone histomorphometry: Standardization of nomenclature, symbols, and units: Report of the ASBMR histomorphometry nomenclature committee. Journal of Bone and Mineral Research 2:595–610. doi:10.1002/jbmr.5650020617.
- Sontag W. 1986. Quantitative measurements of periosteal and cortical-endosteal bone formation and resorption in the midshaft of male rat femur. Bone 7:63–70. doi:10.1016/8756-3282(86)90153-5.
- Stark C, Kahrmann B, Walzel E. 1996. Epi- and metaphyseal morphology in the long bones of BDIX/Han rats. Laboratory Animals 30:35–41. doi:10.1258/002367796780744965.
- Trudel G, Kilborn SH, Uhthoff HK. 2001. Bone growth increases the knee flexion contracture angle: A study using rats. Archives of Physical Medicine and Rehabilitation 82:583–588. doi:10.1053/apmr.2001.21947.
- Wolfe M, Klein L. 1996. Sex differences in absolute rates of bone resorption in young rats: Appendicular versus axial bones. Calcified Tissue International 59:51–57. doi:10.1007/s002239900085.
- Wronski TJ, Dann LM, Scott KS, Cintrón M. 1989. Long-term effects of ovariectomy and aging on the rat skeleton. Calcified Tissue International 45:360–366. doi:10.1007/BF02556007.