
Abstract
Orphan receptor GPR103, a pyroglutamylated RFamide peptide receptor (QRFPR), is a class A G protein-coupled receptor (GPCR) and it is coupled to a Gi alpha subunit (Gi/0) and/or to a Gq protein. Synteny analysis revealed the existence of paralogous genes of QRFPR in mouse, zebrafish and coelacanth. These paralogous genes emerged along with species-specific gene or genome duplications that occurred during vertebrate evolution. 26RFa/QRFP is the high-affinity endogenous ligand for QRFPR and in fish it has been suggested as an orexigenic action of 26RFa/QRFP. The structure, tissue-specific expression and biochemical activity of the 26RFa/QRFP–QRFPR system are conserved across the Chordata phylum, from fish to mammals. In order to study the molecular evolution of mammal QRFPR, we searched for the presence of natural selection on the qrfpr genes using a bioinformatic approach. Overall, the results clearly indicate that mammal QRFPRs are under positive selection, but the majority of positively selected amino acids did not alter the biochemical properties of these proteins.
Introduction
Neuropeptides that possess the Arg-Phe-NH2 motif at their C-terminus (i.e., RFamide peptides) have been characterized in invertebrates and vertebrates. The first identified RFamide peptide was the cardioexcitatory peptide Phe-Met-Arg-Phe-amide (FMRFamide), which was isolated from ganglia of the Venus clam Macrocallista nimbosa (Price & Greenberg Citation1977). Since then, many RFamide peptides have been identified in invertebrates, and these peptides seem to act as neurotransmitters and neuromodulators (Walker et al. Citation2009). Immunohistochemical studies that used antisera against FMRFamide suggested that nervous systems of vertebrates also contain neuropeptides immunologically related to FMRFamide (Raffa Citation1988; Rastogi et al. Citation2001). In fact, several neuropeptides harboring the RFamide sequence at their C-terminus have been characterized in the brains of various vertebrates. In the past, the existence of five groups within the RFamide peptide family was recognized in vertebrates, namely the neuropeptide FF (NPFF) group, the prolactin-releasing peptide (PrRP) group, the gonadotropin-inhibitory hormone (GnIH) group, the kisspeptin group and the 26RFa/QRFP group (Chartrel et al. Citation2011; Leprince et al. Citation2013). These RFamide peptides have been shown to exert important neuroendocrine, behavioral, sensory and autonomic functions (Ukena & Tsutsui Citation2005; Tsutsui & Ukena Citation2006). Among those, NPFF is well known as a morphine modulatory peptide (Panula et al. Citation1999). In addition, GnIH and kisspeptin appear to play key roles in the regulation of the reproductive axis (Tsutsui et al. Citation2010).
In humans, 26RFa/QRFP has been found to be an endogenous ligand for the orphan receptor, GPR103-QRFPR (a class A G protein-coupled receptor or GPCR; Jiang et al. Citation2003). QRFPR shares relatively high sequence similarity with other RFamide receptors, notably those for NPFF, PrRP, kisspeptin and GnIH, and to a lesser extent with the other peptidergic receptors for neuropeptide Y (NPY), galanin, orexin and cholecystokinin (Jiang et al. Citation2003). In addition, QRFPR possesses several features characteristic of class A GPCRs, such as: (1) a disulfide bridge between the two Cys residues located in the first and second extracellular loops (EL1 and EL2); (2) the existence of an Asp residue within the second transmembrane domain (TM2), that seems to play a pivotal role in G protein coupling; (3) a conserved Glu-Arg doublet sequence at the N-terminus of the second intracellular loop (IL2); (4) three conserved residues, i.e. Phe, Pro and Asn, within TM6 and TM7, which are crucial for receptor activation (Ukena et al. Citation2014). Previous results suggested that QRFPR is coupled to a Gi/0 and/or to a Gq protein (Fukusumi et al. Citation2003). Furthermore, it has been reported that 26RFa/QRFP enhances corticosteroid secretion in human adrenocortical cells by regulating key steroidogenic enzymes involving MAPK/PKC (mitogen-activated protein kinase/protein kinase C) and Ca2+ (calcium ions) signaling pathways via QRFPR (Ramanjaneya et al. Citation2013).
In mammals, 26RFa/QRFP has been found to be a high-affinity endogenous ligand for the previously identified QRFPR. In rodents and monkeys, 26RFa/QRFP exerts diverse biological actions, including regulation of food intake and energy homeostasis, hormone secretion, nociception and bone formation. Recently, the mature sequences of 26RFa/QRFP have been identified by structural analysis in quail and zebra finch. In birds, as in mammals, 26RFa/QRFP-producing neurons are located in the hypothalamus, while QRFPR is widely distributed throughout the brain. In birds, 26RFa/QRFP also exerts an orexigenic action, and a similar effect has been suggested in fish (Ukena et al. Citation2014).
Synteny analysis has revealed the existence of paralogous genes of QRFPR in mouse, zebrafish and coelacanth. These genes may have emerged along with the species-specific gene or genome duplications that occurred during the evolution of vertebrates. Phylogenetic analysis data are consistent with synteny analysis. Although in the genome database there are homologous sequences of QRFPR in Xenopus, zebrafish, coelacanth and lamprey (Ukena et al. Citation2014), qrfpr has been studied only in mammals and birds.
In contrast to a recent study (Ukena et al. Citation2014) that proposed three ancestral vertebrate QRFPR subtypes, analyses by Larhammar and colleagues (Citation2014) identified four ancestral vertebrate QRFP receptor genes. Furthermore, they proposed a likely scenario for the gene duplications in early vertebrate evolution in relation to the vertebrate tetraploidization, which showed that mammals have lost much of the QRFP system. Possibly, this explains why the single QRFP peptide found in mammalian genomes seems to have diverged from other vertebrates, which still retain more extensive QRFP receptor repertoires. However, the structure, distribution pattern and biological actions of the 26RFa/QRFP–QRFPR system have been conserved across the vertebrate phylum, from fish to mammals (Ukena et al. Citation2014). Thus, in order to have further information on the molecular evolution of these proteins in relation to the functional significance of 26RFa/QRFP–QRFPR pair in vertebrates, we verify the presence of natural selection on mammals’ qrfpr gene.
Materials and methods
Coding region and amino acid sequences of mammal QRFPRs were available in EMBL/GenBank database ().
Table I. QRFPR sequences used for phylogeny and their EMBL (European Molecular Biology Laboratory)/GenBank accession numbers.
The T-Coffee multiple sequence alignment package was used to obtain multiple sequence alignment (Notredame et al. Citation2000). We decided to use the T-Coffee program in order to align QRFPR sequences, because even though the method is based on the popular progressive approach to multiple alignment, it is characterized by a dramatic improvement in accuracy with a modest sacrifice in speed, as compared to the most commonly used alternatives (Notredame et al. Citation2000).
jModelTest 2.0 (Darriba et al. Citation2012) was used to carry out the statistical selection of the best-fit model of nucleotide substitution. Analyses were performed using 88 candidate models and three types of criteria [Akaike information criterion (AIC), corrected Akaike information criterion (cAIC) and Bayesian information criterion (BIC)].
We used ProtTest 3 to select the best-fit model for the analysis of protein evolution (Darriba et al. Citation2011). One hundred and twenty-two candidate models and the three previously mentioned criteria were used in these statistical analyses.
A Bayes factor comparison was performed using Mr. Bayes 3.2 to test the strict clock model against the non-clock (unconstrained) model using QRFPR cDNA coding region sequences.
Phylogenetic trees were built using the Bayesian inference (BI) method implemented in Mr. Bayes 3.2 (Ronquist et al. Citation2012). Four independent runs, each with four simultaneous Markov Chain Monte Carlo (MCMC) chains, were performed for 1,000,000 generations sampled every 1000 generations. FigTree (http://tree.bio.ed.ac.uk/software/figtree/) software was used to display the annotated phylogenetic trees.
Genetic algorithm recombination detection (GARD) and single breakpoint recombination (SBP) programs (Kosakovsky Pond et al. Citation2006) were used to identify possible breakpoints in the QRFPR codon sequences.
In order to detect the presence of positive selection in QRFPR molecular evolution, we used statistical methods implemented in HyPhy package (Pond et al. Citation2005); single likelihood ancestor (SLAC), fixed effects likelihood (FEL), random effect likelihood (REL) and fast unconstrained Bayesian approximation (FUBAR) programs are useful to detect the presence of possible positive selection, and mixed effects model evolution (MEME) is an excellent program to detect sites under episodic diversifying selection (Murrell et al. Citation2012).
The property informed models of evolution (PRIME) program (http://hyphy.org/w/index.php/PRIME) was used to detect the variation of QRFPR biochemical properties, which drive the amino acid substitutions. Furthermore, we employed the mechanistic empirical model (MEC; Doron-Faigenboim & Pupko Citation2007) that accounts for the different amino acid replacement probabilities based on the JTT (Jones, Taylor and Thornton) empirical substitution matrix (Jones et al. Citation1992), while estimating the codon rate matrix, thus allowing for positions undergoing radical amino acid exchanges to acquire higher dN rates than those with less radical exchanges. The codon-wise x estimates were mapped onto human predicted protein tertiary structure using the Selecton-3D web server (http://selecton.tau.ac.il). The human QRFPR tertiary structure was predicted using the I-TASSER (Iterative Threading ASSEmbly Refinement) server (Zhang Citation2008), which is known to be one of the most accurate methods for protein three-dimensional structure prediction.
Results
Molecular clock tests
We performed a Bayes factor comparison using Mr. Bayes 3.2 to test the strict clock model against the non-clock (unconstrained) model using QRFPR cDNA coding region sequences. Furthermore, we used the same approach to test all three relaxed clock models implemented in MrBayes 3.2. The models are the Thorne–Kishino Citation2002 (TK02) model (Thorne & Kishino Citation2002), the compound Poisson process (CPP) model (Huelsenbeck et al. Citation2000) and the independent gamma rates (IGR) model (Lepage et al. Citation2007). We used an accurate assessment of the marginal model likelihoods using the stepping-stone method. It estimates the model likelihood by sampling a series of distributions that represent different mixtures of the posterior distribution and the prior distribution (Xie et al. Citation2011). The stepping-stone method was applied to the QRFPR data set using 510,000 generations with a diagnostic frequency of 2,500 in two independent runs for each of the tested models. The marginal likelihood values are shown in .
Table II. Marginal likelihood values in each of the two independent runs and the resulting mean values for each of the tested models using the stepping-stone method.
Mammal QRFPR sequences analyses
The multiple alignment of mammal QRFPR amino acid sequences is reported in .
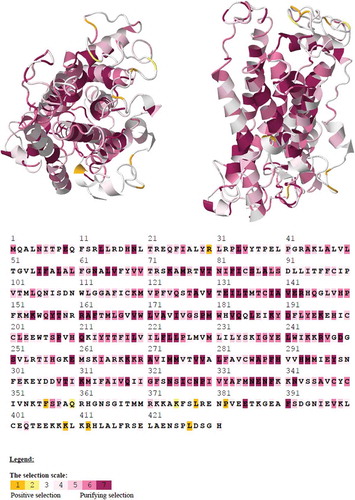
Figure 1. Multiple alignment of QRFPR amino acid sequences from mammal species using the T-coffee program. The gray background alignment regions refer to the TMDs. Boxed letters refer to the amino acids that play a crucial role in G protein coupling and receptor activation. The disulfide bridge between the two C residues located in the first and second extracellular loops is indicated by the letter “B”.
Figure 1. (Continued) The gray colored letters in the TMD2, TMD3 and TMD7 and the letters marked by a black background refer to the positively selected amino acid sites. In the sequence of Homo sapiens QRFPR1, the letters marked by the black background refer to the positively selected amino acids estimated using MEC. The symbols at the bottom of the QRFPR sequences correspond to the definitions of the T-coffee program: (*) fully conserved; (:) highly conserved; (.) conserved substitution.
Figure 1. (Continued).
The total score value was 97, indicating that the multiple alignment was characterized by a high level of similarity among the different sequences. Furthermore, all the mammal QRFPRs exhibit the characteristics of class A GPCRs, represented by the putative Transmembrane Domains (TMDs), a disulfide bridge between two Cys residues located in the first and second extracellular loops, the Asp residue in TMD2 involved in G protein coupling, the conserved Glu-Arg residues in the second intracellular loop and the conserved Phe, Pro and Asn residues in TMD6 and TMD7.
Phylogeny of mammal QRFPR
The IGR molecular clock model was used as an evolutionary model in cDNA and amino acid phylogenetic tree building. All cDNA coding region sequences were aligned using T-Coffee in combined libraries of local and multiple alignments, which are known to induce high accuracy and performance in sequence alignments. jModelTest 2.0 software indicated that the GTR + I + G model is the best-fit model to analyze the evolution of QRFPR coding sequences, with a gamma shape value (four rate categories) of 0.974 using all statistical criteria: AIC, cAIC and BIC (–lnL = 18091.61). BI analyses generated the mammal QRFPR phylogeny based on cDNA data ().
Figure 2. Phylogenetic relationships among different mammal QRFPRs reconstructed on the basis of cDNA coding region sequences and using the BI method (arithmetic mean = −18130.57; harmonic mean = −18175.65). Bayesian posterior probability values higher than 50% are indicated on each node. The scale for branch length (0.02 substitution/site) is shown below the tree.
ProtTest3 statistical results determined the JTT + G model was the best one to apply for the phylogenetic analysis of QRFPR amino acid sequences, with a gamma shape value (four rate categories) of 0.767 using all statistical criteria (–lnL = –8820.04). shows a mammal QRFPR phylogenetic tree generated by the application of the BI method to the amino acid sequences data set.
Figure 3. Phylogenetic relationships among different fish QRFPRs reconstructed on the basis of amino acid sequences and using the BI method (arithmetic mean = −8841.54; harmonic mean = −8882.94). Bayesian posterior probability values higher than 50% are indicated on each node. The scale for branch length (0.08 substitution/site) is shown below the tree.
The cladogram based on amino acid sequences () is equally resolved in comparison to that obtained with open reading frames (ORFs) and is supported by high posterior probabilities of the BI analyses. In both phylogenetic trees, almost all Primates QRFPRs are separated from the other sequences, which were grouped together in a big clade, in the nucleotide phylogenetic tree, while in the amino acid phylogenetic tree Otolemur garnettii (Ogilby, 1838) QRFPR is positioned in a separate clade. A notable difference is observed in the relative positions of bovines, rodents, primates and the other analyzed organisms’ QRFPRs: in the ORF phylogenetic tree bovine QRFPRs are grouped together, while in the amino acid phylogenetic tree there are mixed clades of bovine and rodent QRFPRs. However, the greatest difference is due to the positioning of the Tupaia chinensis (Raffles, 1821) QRFPRs, which are localized outside the big clade containing all the remaining QRFPR amino acid sequences.
Positively selected sites and conserved/altered biochemical property identifications
We used existing computational techniques (FUBAR, SLAC, FEL and REL) implemented in HyPhy package (Pond et al. Citation2005), which are designed to identify sites subject to pervasive selection (a large proportion of positively selected sites). These techniques may fail to recognize sites where selection is episodic (Messier & Stewart Citation1997). Consequently, we used the MEME program, which is capable of identifying instances of both episodic and pervasive positive selection at the level of an individual site (Murrell et al. Citation2012). In order to investigate the presence of positive selection, we applied all the previously mentioned bioinformatic methods to the mammal QRFPR codon sequences alignment. presents the identified positively selected codon sites. FUBAR, REL and MEME tests were statistically significant for a p-value < 0.05.
Table III. Positively selected codon sites identified using random effect likelihood (REL), mixed effects model evolution (MEME) and fast unconstrained Bayesian approximation (FUBAR), and their calculated statistics. dN – number of nonsynonymous substitutions for site; dS – number of synonymous substitutions for site; their difference must be a positive value in order to have positive selection at a given site. Posterior pr. – posterior probability is a measure of the probability of having ω = dN/dS > 1 at a given site; p-value – the number of false positive tests.
All other program results (SLAC and FEL) were not statistically significant. Kosakovsky Pond and Frost (Citation2005) noted that if all QRFPR codon sequences had not been screened for recombination, selection analyses of alignments with recombinants in them by using a single tree could generate misleading results. Thus, we used GARD and SBP programs (Kosakovsky Pond et al. Citation2006) to identify possible breakpoints in the QRFPR consensus codon sequence. GARD and SBP applications did not find evidence of breakpoints in the QRFPR consensus codon sequence. In order to know which biochemical properties are driving substitutions at different sites in the QRFPR codon sequences alignment, and which properties are being selected for the advantageous change in our previously identified positively selected sites, we performed another bioinformatics analysis using the PRIME program. In this analysis we used both predefined sets of five amino-acid properties, which are the five empirically measured properties used by Conant et al. (Citation2007) and the five composite properties proposed by Atchley et al. (Citation2005). PRIME builds on the same conceptual frameworks as FEL (Kosakovsky Pond & Frost Citation2005) and MEME (Murrell et al. Citation2012), but allows the non-synonymous substitution rate (dN) to depend not only on the site in question (like FEL and MEME), but also on which residues are being exchanged (e.g. I-V would be different from K-R). Furthermore, shows the positively selected sites based on a mechanistic empirical combination model approach, which are also mapped on a hypothetical human QRFPR tertiary structure.
Figure 4. Detection of selective pressure on QRFPR using the mechanistic empirical combination model mapped on protein tertiary structure (transversal view of the left and lateral view on the right), where the yellow areas indicate the positively selected sites. The color scale illustrates the intensity of selective constraints. The codon-wise x estimates were mapped onto predicted human protein tertiary structure. Figure available in colour in online version.
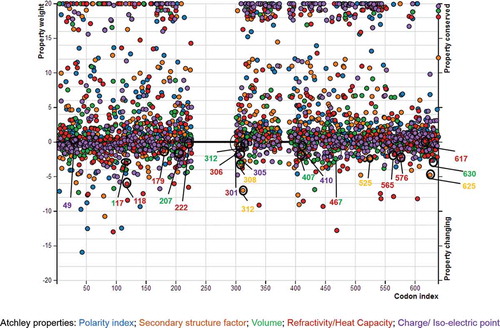
and show conserved and altered biochemical properties, which drive amino acid substitutions in the mammal QRFPR molecular evolution, based on Conant–Stadler and Atchley properties, respectively.
Table IV. Conserved and altered biochemical properties, which are driving amino acid substitutions in the mammal QRFPR molecular evolution. These PRIME analyses were based on Conant–Stadler properties, and the results were statistically significant for p-values < 0,05. α is a measure of the importance of the alteration or conservation; for lower (negative) α values, the level of conservation of the corresponding property is higher at a given site, and for higher (positive) values of the α value, the alteration of the corresponding property is more radical at a given site. Altered property results are shown on a dark grey background, while conserved property results are shown on a light grey background.
Table V. Conserved and altered biochemical properties, which are driving amino acid substitutions in the mammal QRFPR molecular evolution. These PRIME analyses were based on Atchley properties and the results are statistically significant for p-values < 0.05.
Some of the amino acid sites (codon 142, 207, 222, 312 and 617) corresponding to the positively selected codon sites previously identified by our analyses seem to be significantly conserved in at least one Conant-Stadler property (142, 207 and 312 in polarity, 222 in chemical composition and 617 in isoelectric point) of the five considered biochemical properties. On the contrary, at the positively selected codon sites 118, 306, 308, 407 and 565, the analysis based on Atchley (118, 306 and 565 in refractivity or heat capacity, and 407 in volume) and Conant–Stadler properties (308 in chemical composition) indicated that the corresponding properties were significantly altered. However, some “biochemically conserved” codon sites such as 312 and 617 even showed altered properties (312 in Conant–Stadler chemical composition and 617 in Conant–Stadler chemical composition and volume). and show the property importance plots of Conant–Stadler and Atchley properties, respectively.
Figure 5. Importance plot of the altered and conserved properties at different codon sites, identified by PRoperty Informed Models of Evolution (PRIME) analyses based on Conant–Stadler properties. The color of each of the circles refers to the color of a specific biochemical property shown on the bottom of the graphic. For higher vertical distance from 0, the property alterations or conservations become more radical. The altered properties of the positively selected sites are indicated by empty circles. Figure available in colour in online version.
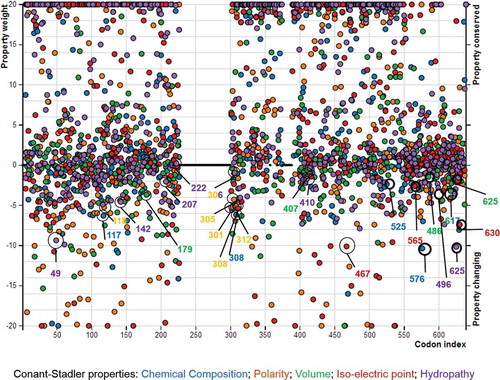
Figure 6. Importance plot of the altered and conserved properties at different codon sites, identified by PRoperty Informed Models of Evolution (PRIME) analyses based on Atchley properties. The altered and conserved properties of the positively selected sites are indicated by empty circles. Figure available in colour in online version.
Generally, although the level of importance for at least one of the Conant–Stadler or Atchley properties was higher than 5 in some of the positively selected codon sites, these alterations were not supported by p-value < 0.05.
Discussion
Mammal QRFPRs differentiate according to a relaxed molecular clock model (compound Poisson process model)
The molecular clock has become an indispensable tool within evolutionary biology, enabling independent timescales to be placed on evolutionary events (Loewe & Scherer Citation1997). In its most extreme form, the molecular clock hypothesis postulates that homologous stretches of DNA evolve at essentially the same rate along all evolutionary lineages for as long as they maintain their original function. It was shown that the substitution rate of proteins encoded in the mitochondrion genome increased in fish, amphibians, birds and mammals, and that this rate in mammals is at least six times, probably an order of magnitude, higher with respect to fish. In general, a higher evolutionary rate is present in birds and mammals than in amphibians and fish, and this datum has been attributed to the relaxation of selective constraints operating on proteins of endotherm vertebrates, and to a high mutation rate of bird and mammalian mitochondrial DNAs (Adachi et al. Citation1993). Since the assumption of rate constancy is violated even within mammalians, a truly universal molecular clock that applies to all organisms cannot be assumed to exist (Powell & Caccone Citation1989). As shown in , the non-clock model (−18655.4) is almost 12 log likelihood units better than the strict-clock model (−18668.02). A difference exceeding 5 log likelihood units is usually considered very strong evidence in favor of the better model (Kass & Raftery Citation1995). However, in phylogenetics, the unrooted model of phylogeny and the strict molecular clock model are two extremes of a continuum. Despite their dominance in phylogenetic inference, it is evident that both are biologically unrealistic, and therefore the real evolutionary process lies between these two extremes (Drummond et al. Citation2006).
Local molecular clocks are another alternative to the global molecular clock. A local molecular clock permits different regions in the tree to have different evolutionary rates, but within each region the rate must be the same (Drummond & Suchard Citation2010). This new method conveniently allows a comparison of the strict molecular clock against a large array of alternative local molecular clock models (Drummond & Suchard Citation2010). The TK02 model is a continuous autocorrelated model similar to the one implemented in multidivtime (Thorne et al. Citation1998; Thorne & Kishino Citation2002). The CPP model is a discrete autocorrelated model similar to the model implemented in PhyloBayes (Lartillot & Philippe Citation2004). The IGR model is a continuous uncorrelated model, where branch rates are drawn independently from a gamma distribution (Lepage et al. Citation2007). The marginal likelihood value () comparisons between the different models suggest that QRFPR molecular evolution seems to be best described by the local/relaxed molecular clock model (IGR).
Mammal QRPFR molecular evolution
Although cDNA coding region and amino acid sequence alignments are characterized by a high level of similarity between the corresponding sequences, the amino acid sequence alignment quality turned out to be better than that of the coding sequences, because its alignment quality score value (97) was higher than the corresponding value (96) of the coding sequence alignment. The high score values suggest a high level of homology between the various mammal sequences, also supported by the high level of conservation of the putative TMDs (). A similar level of conservation was observed in the QRFPR amino acid alignment of Homo sapiens, Rattus norvegicus, Gallus domesticus (Linnaeus, 1758), Taeniopygia guttata (Vieillot, 1817), Xenopus laevis (Daudin, 1802) and Danio rerio (Hamilton, 1822), reported by Ukena et al. (Citation2014).
In the eutherian mammal phylogeny proposed by Song et al. (Citation2012), the tree shrew (T. chinensis) is positioned near the clade of Primates, similarly to the QRFPR phylogenetic tree based on ORF sequences. Although in the eutherian mammal molecular phylogeny (Song et al. Citation2012) elephant (Loxodonta africanaafricana Blumenbach, 1797) and armadillo (Dasypus novemcinctus) are localized in a separated clade and far away from the bovine species (Bos and Bubalus) and pig (Sus scrofa Linnaeus, 1758), in the QRFPR phylogeny (based on the nucleotide sequences data set) we observed a big clade composed by all of them. Even in the QRFPR phylogenetic tree (based on amino acid sequences data set) the Lagomorpha QRFPRs, represented by rabbit and pika (Oryctolagus cuniculus Linnaeus, 1758 and Ochotona princeps Richardson, 1828, respectively) are positioned near Chiroptera QRFPRs (Eptesicus fuscus Beauvois, 1796 and Myotis davidii Peters, 1869), but this is different from the mammal molecular phylogeny proposed by Song et al. (Citation2012); bats are grouped together with members of Certartiodactyla, Carnivora, Prissodactyla and Eulipotyphyla in a unique clade, far away from the clade composed by Logomorpha members. Thus, the phylogenetic relationships among mammal QRFPRs are not compatible with the mammal phylogeny reported by Song et al. (Citation2012) and Murphy et al. (Citation2007).
As previously mentioned, many discordances emerged from the comparison between the topologies obtained with the analyses performed with coding regions and amino acids, especially in relation to the position of T. chinensis QRFPRs. We hypothesized that they might be the result of the differences in substitution rates, supported by the great difference in the branch lengths of the two phylogenetic trees. The estimated amino acid substitution mean rate (0.170 substitution/site) is comparable to the (0.184 substitution/site) base substitution mean rate estimated using MEGA 6 (Tamura et al. Citation2013), but generally the estimated evolutionary divergence between nucleotide sequences is much higher than the evolutionary divergence between amino acid sequences. Probably, it could be explained only by a situation where the nonsynonymous substitution rates (dN) were higher than synonymous substitution rates (dS). A statistically significant excess of nonsynonymous substitution (dN > dS) could be interpreted as positive selection (Kosakovsky Pond & Frost Citation2005). Another point to highlight is the phenomenon of gene duplication, that seems to be related to the evolutionary history of these proteins. This is evident in some species, such as mouse as well as rat, which have two receptor genes as a result of a recent gene duplication (Takayasu et al. Citation2006). Probably this is a characteristic of the rodent lineage and it does not seem to be a generalized phenomenon, although we cannot exclude that other species may have isoforms not yet identified.
The presence of four QRFPR clades naturally (Larhammar et al. Citation2014) suggests origin by duplications resulting from the two basal tetraploidizations, 1R and 2R, thus forming a paralogon (a set of chromosome regions containing members of the same gene families as a result of the duplication of a large block or an entire chromosome). However, due to the many losses of QRFPR genes in the different species or lineages, sequence-based analyses may be skewed due to uneven selection pressures. Therefore, some additional types of information should be considered.
Positive selection in mammal QRFPR molecular evolution
Evolutionary biologists have typically invoked two types of selective forces that shape the evolution of species. One of them is purifying selection, which favors the conservation of existing phenotypes. The other is positive selection (also known as Darwinian selection), which promotes the emergence of new phenotypes. Positive selection can leave a set of telltale signatures in the genes under its influence, such as the rapid divergence of functional sites between species, and the depression of polymorphism within species (Bamshad & Wooding Citation2003). The imprint of natural selection (positive selection) on protein coding genes is often difficult to identify, because selection is frequently transient or episodic, i.e. it affects only a subset of lineages. As shown in , MEME was the most successful of all the programs used, because its results were the most abundant. MEME can reliably capture the molecular footprints of both episodic and pervasive positive selection, a task to which other program models used are not well suited, because variable levels of purifying selection pressure across different lineages prevented these older methods from detecting instances of episodic positive selection. Thus, MEME is able to peer through the fog of purifying selection. Our results further support the Murrell et al. (Citation2012) hypothesis, that natural selection is predominantly episodic, with transient periods of adaptive evolution masked by the prevalence of purifying or neutral selection on other branches. Previous work on calreticulin (CRT) molecular evolution investigations for positive and purifying selection showed that a significant number of identified codon sites were demonstrated to be functionally or structurally important by other researchers’ wet-lab analyses (Bakiu Citation2014). Only 617 codon sites proved to be positively selected from the MEC analysis results ( and ). However, our results must be confirmed experimentally, using a targeted experimental approach. It could be extremely interesting to do experimental wet-lab analyses using site-specific mutagenesis in order to determine the functional and/or structural importance of the positively selected sites.
Conserved/altered amino acid biochemical properties in mammal QRFPR molecular evolution
Recent studies have shown that amino acid exchangeability varies across organisms (Dunn et al. Citation2013) and across genes (Conant et al. Citation2007), depending on physico-chemical properties, so that the same substitution may sometimes be radical (having a large effect on protein structure and/or function) and sometimes conservative (having little effect on structure or function). Tourasse and Li (Citation2000) found that observed substitution patterns resulted from the unique functional characteristics of individual protein families. Variation can be expected from site to site within a protein: for instance, amino acids with different hydrophobicity may be unchangeable at sites where the protein fold is sensitive to hydrophobicity, but exchangeable at sites where it is insensitive to hydrophobicity. PRIME models were designed to take into account this variation. To understand these models, it is necessary to consider the properties of the various amino acid residues. The properties of Conant et al. (Citation2007) include: (1) the volume of the residue side chain, which varies from three cubic angstroms for glycine to 170 for tryptophan; (2) the iso-electric point of the side chain, which varies from 2.8 for aspartic acid to 10.8 for arginine; (3) the residue polarity, ranging from 13 for aspartic acid to 4.9 for leucine; (4) the chemical composition of the side chain, a measurement from Grantham giving the ratio of the atomic weight of the side-chain non-carbon atoms to the weight of the side-chain carbon atoms and it varies from 0 for amino acids with hydrocarbon side chains such as alanine and valine to 2.8 for cystine (Grantham Citation1974); (5) the hydropathy, taken from Kyte and Doolittle (Citation1982) and ranging from 4.5 for isoleucine to −4.5 for arginine. Conant et al. (Citation2007) determined that each of the five independent amino acid properties significantly influenced the substitution rate on each protein amino acid site. The properties of Atchley et al. (Citation2005) include: (1) the polarity index, which is bipolar (large positive and negative factor coefficients) and reflects simultaneous covariation in the portion of exposed residues versus buried residues, nonbonded energy versus free energy, number of hydrogen bond donors, polarity versus nonpolarity, and hydrophobicity versus hydrophilicity; (2) the secondary structure factor, which is an inverse relationship of relative propensity for various amino acids in various secondary structural configurations, such as a coil, a turn or a bend versus the frequency in an α-helix; (3) the molecular size or volume with high factor coefficients for bulkiness, residue volume, average volume of a buried residue, side chain volume and molecular weight. A large negative factor coefficient occurs for normalized frequency of a left-handed α-helix; (4) the refractivity and heat capacity, which vary inversely with relative amino acid composition in various proteins, number of codons coding for an amino acid and amino acid composition; (5) the electrostatic charge with high coefficients on isoelectric point and net charge.
PRIME analysis results suggest that there are more conserved amino acid biochemical properties than altered ones in mammal QRFPR molecular evolution, although we observed significant alterations. Atchley property results () indicate that refractivity or heat capacity was altered significantly in some of the positively selected sites. A strong evolutionary basis exists for a complex pattern of covarion involving all the polarity index-related attributes. Atchley et al. (Citation2000) described in considerable detail the patterns of variability in buried hydrophobic versus accessible hydrophilic amino acids in the dimerization domain of basic helix–loop–helix (bHLH) proteins. These observed patterns were related to natural selection, evolutionary change and phylogenetic divergence, but none of the identified positively selected sites was altered significantly in polarity. Refractivity and heat capacity, which reflects codon and amino acid diversity, is another property that exhibits significant correlation with positive selection and evolutionary change (Atchley et al. Citation2005). In our analyses, the positively selected sites 118, 306 and 565 exhibited altered refractivity/heat capacity, and this was statistically significant for p-value < 0.05. Probably, this property alteration was functionally significant in the molecular evolution of mammal QRFPRs.
Furthermore, Atchley et al. (Citation2005) demonstrated that the remaining three properties do not indicate a significant association between physiochemical attribute variation and evolutionary patterns of amino acid substitution, and they cannot be ascribed to evolutionary divergence, but rather to non-evolutionary changes in structure and function. Thus, the variation in the propensity to decrease or increase volume in positively selected site 407 cannot be the result of positive selection. In conclusion, our results suggest that in the molecular evolution of mammal QRFPRs, positive selection significantly altered the amino acid biochemical properties of a few positively selected sites, and these alterations probably played an important role in the functionality of QRFPRs.
References
- Adachi J, Cao Y, Hasegawa M. 1993. Tempo and mode of mitochondrial DNA evolution in vertebrates at the amino acid sequence level: Rapid evolution in warm-blooded vertebrates. Journal of Molecular Evolution 36:270–281. doi:10.1007/BF00160483.
- Atchley WR, Wollenberg KR, Fitch WM, Terhalle W, Dress AW. 2000. Correlations among amino acid sites in bHLH protein domains: An information theoretic analysis. Molecular Biology and Evolution 17:164–178. doi:10.1093/oxfordjournals.molbev.a026229.
- Atchley WR, Zhao J, Fernandes AD, Drüke T. 2005. Solving the protein sequence metric problem. PNAS 102:6395–6400. doi:10.1073/pnas.0408677102.
- Bakiu R. 2014. Calreticulin molecular evolution: A strong purifying and episodic diversifying selection result. Biologia 69:270–280. doi:10.2478/s11756-013-0327-7.
- Bamshad M, Wooding SP. 2003. Signatures of natural selection in the human genome. Nature Reviews Genetics 4:99–111. doi:10.1038/nrg999.
- Chartrel N, Alonzeau J, Alexandre D, Jeandel L, Alvear-Perez R, Leprince J, Boutin J, Vaudry H, Anouar Y, Llorens-Cortes C. 2011. The RFamide neuropeptide 26RFa and its role in the control of neuroendocrine functions. Frontiers in Endocrinology 32:387–397.
- Conant GC, Wagner GP, Stadler PF. 2007. Modeling amino acid substitution patterns in orthologous and paralogous genes. Molecular Phylogenetics and Evolution 42:298–307. doi:10.1016/j.ympev.2006.07.006.
- Darriba D, Taboada GL, Doallo R, Posada D. 2011. ProtTest 3: Fast selection of best-fit models of protein evolution. Bioinformatics 27:1164–1165. doi:10.1093/bioinformatics/btr088.
- Darriba D, Taboada GL, Doallo R, Posada D. 2012. jModelTest 2: More models, new heuristics and parallel computing. Nature Methods 9:772. doi:10.1038/nmeth.2109.
- Doron-Faigenboim A, Pupko T. 2007. A combined empirical and mechanistic codon model. Molecular Biology and Evolution 24:388–397. doi:10.1093/molbev/msl175.
- Drummond AJ, Ho SY, Phillips MJ, Rambaut A. 2006. Relaxed phylogenetics and dating with confidence. PLoS Biology 4:88. doi:10.1371/journal.pbio.0040088.
- Drummond AJ, Suchard MA. 2010. Bayesian random local clocks, or one rate to rule them all. BMC Biology 8:114. doi:10.1186/1741-7007-8-114.
- Dunn KA, Jiang W, Field C, Bielawski JP., Salamin N. 2013. Improving evolutionary models for mitochondrial protein data with site-class specific amino acid exchangeability matrices. PLoS One 8:e55816. doi:10.1371/journal.pone.0055816.
- Fukusumi S, Yoshida H, Fujii R, Maruyama M, Komatsu H, Habata Y, Shintani Y, Hinuma S, Fujino M. 2003. A new peptidic ligand and its receptor regulating adrenal function in rats. Journal of Biological Chemistry 278:46387–46395. doi:10.1074/jbc.M305270200.
- Grantham R. 1974. Amino acid difference formula to help explain protein evolution. Science 185:862–864. doi:10.1126/science.185.4154.862.
- Huelsenbeck JP, Larget B, Swofford D. 2000. A compound Poisson process for relaxing the molecular clock. Genetics 154:1879–1892.
- Jiang Y, Luo L, Gustafson EL, Yadav D, Laverty M, Murgolo N, Vassileva G, Zeng M, Laz TM, Behan Jet J, Qiu P, Wang L, Wang S, Bayne M, Greene J, Monsma F, Zhang FL. 2003. Identification and characterization of a novel RF-amide peptide ligand for orphan G-protein-coupled receptor SP9155. Journal of Biological Chemistry 278:27652–27657. doi:10.1074/jbc.M302945200.
- Jones DT, Taylor WR, Thornton JM. 1992. The rapid generation of mutation data matrices from protein sequences. Computer Applications in the Biosciences 8:275–282.
- Kass RE, Raftery AE. 1995. Bayes factors. Journal of the American Statistical Association 90:773–795. doi:10.1080/01621459.1995.10476572.
- Kosakovsky Pond SL, Frost SDV. 2005. Not so different after all: A comparison of methods for detecting amino acid sites under selection. Molecular Biology and Evolution 22:1208–1222. doi:10.1093/molbev/msi105.
- Kosakovsky Pond SL, Posada D, Gravenor MB, Woelk CH, Frost SDW. 2006. Automated phylogenetic detection of recombination using a genetic algorithm. Molecular Biology and Evolution 23:1891–1901. doi:10.1093/molbev/msl051.
- Kyte J, Doolittle R. 1982. A simple method for displaying the hydropathic character of a protein. Journal of Molecular Biology 157:105–132. doi:10.1016/0022-2836(82)90515-0.
- Larhammar D, Xu B, Bergqvist CA. 2014. Unexpected multiplicity of QRFP receptors in early vertebrate evolution. Frontiers in Neuroscience 8:337. doi:10.3389/fnins.2014.00337. Oct 24; eCollection.
- Lartillot N, Philippe H. 2004. A Bayesian mixture model for across-site heterogeneities in the amino-acid replacement process. Molecular Biology and Evolution 21:1095–1109. doi:10.1093/molbev/msh112.
- Lepage T, Bryant D, Philippe H, Lartillot N. 2007. A general comparison of relaxed molecular clock models. Molecular Biology and Evolution 24:2669–2680. doi:10.1093/molbev/msm193.
- Leprince J, Neveu C, Lefranc B, Guilhaudis L, Milazzo-Segalas I, Do Rego JC, Tena-Sempere M, Tsutsui K, Vaudry H. 2013. 26RFa. In: Kastin AJ, editor. Handbook of biologically active peptides. 2nd ed. Amsterdam, The Netherlands: Elsevier. pp. 917–923.
- Loewe L, Scherer S. 1997. Mitochondrial Eve: The plot thickens. Trends in Ecology & Evolution 12:422–423. doi:10.1016/S0169-5347(97)01204-4.
- Messier W, Stewart C-B. 1997. Episodic adaptive evolution of primate lysozymes. Nature 385:151–154. doi:10.1038/385151a0.
- Murphy WJ, Pringle TH, Crider TA, Springer MS, Miller W. 2007. Using genomic data to unravel the root of the placental mammal phylogeny. Genome Research 17:413–421. doi:10.1101/gr.5918807.
- Murrell B, Wertheim JO, Moola S, Weighill T, Scheffler K, Kosakovsky Pond SL, Malik HS. 2012. Detecting individual sites subject to episodic diversifying selection. PLoS Genetics 8:e1002764. doi:10.1371/journal.pgen.1002764.
- Notredame C, Higgins DG, Heringa J. 2000. T-Coffee: A novel method for fast and accurate multiple sequence alignment. Journal of Molecular Biology 302:205–217. doi:10.1006/jmbi.2000.4042.
- Panula P, Kalso E, Nieminen M, Kontinen VK, Brandt A, Pertovaara A. 1999. Neuropeptide FF and modulation of pain. Brain Research 848:191–196. doi:10.1016/S0006-8993(99)02044-2.
- Pond SL, Frost SD, Muse SV. 2005. HyPhy: Hypothesis testing using phylogenies. Bioinformatics 21:676–679. doi:10.1093/bioinformatics/bti079.
- Powell JR, Caccone A. 1989. Intraspecific and interspecific genetic variation in Drosophila. Genome 31:233–238. doi:10.1139/g89-040.
- Price DA, Greenberg MJ. 1977. Structure of a molluscan cardioexcitatory neuropeptide. Science 197:670–671. doi:10.1126/science.877582.
- Raffa RB. 1988. The action of FMRFamide (Phe-Met-Arg-Phe-NH2) and related peptides on mammals. Peptides 9:915–922. doi:10.1016/0196-9781(88)90141-6.
- Ramanjaneya M, Karteris E, Chen J, Rucinski M, Ziolkowska A, Ahmed N, Kagerer S, JöhrenJohren O, Lehnert H, Malendowicz LK, Randeva HS. 2013. QRFP induces aldosterone production via PKC and T-type calcium channel-mediated pathways in human adrenocortical cells: Evidence for a novel role of GPR103. American Journal of Physiology-Endocrinology and Metabolism 305:E1049–E1058. doi:10.1152/ajpendo.00191.2013.
- Rastogi RK, D’Aniello B, Pinelli C, Fiorentino M, Di Fiore MM, Di Meglio M, Iela L. 2001. FMRFamide in the amphibian brain: A comprehensive survey. Microscopy Research and Technique 54:158–172. doi:10.1002/jemt.1130.
- Ronquist F, Teslenko M, van der Mark P, Ayres DL, Darling A, Höhna S, Larget B, Liu L, Suchard MA, Huelsenbeck JP. 2012. MrBayes 3.2: Efficient bayesian phylogenetic inference and model choice across a large model space. Systematic Biology 61:539–542. doi:10.1093/sysbio/sys029.
- Song S, Liub L, Edwardsc SV, Wub S. 2012. Resolving conflict in eutherian mammal phylogeny using phylogenomics and the multispecies coalescent model. Proceedings of the National Academy of Sciences 109:14942–14947. doi:10.1073/pnas.1211733109.
- Takayasu S, Sakurai T, Iwasaki S, Teranishi H, Yamanaka A, Williams SC, Iguchi H, Kawasawa YI, Ikeda Y, Sakakibara I, Ohno K, Ioka RX, Murakami S, Dohmae N, Xie J, Suda T, Motoike T, Ohuchi T, Yanagisawa M, Sakai J. 2006. Aneuropeptide ligand of the G protein-coupled receptor GPR103 regulates feeding, behavioral arousal, and blood pressure in mice. Proceedings of the National Academy of Sciences of the USA 103:7438–7443. doi:10.1073/pnas.0602371103.
- Tamura K, Stecher G, Peterson D, Filipski A, Kumar S. 2013. MEGA6: Molecular Evolutionary Genetics Analysis version 6.0. Molecular Biology and Evolution 30:2725–2729. doi:10.1093/molbev/mst197.
- Thorne JL, Kishino H. 2002. Divergence time and evolutionary rate estimation with multilocus data. Systematic Biology 51:689–702. doi:10.1080/10635150290102456.
- Thorne JL, Kishino H, Painter IS. 1998. Estimating the rate of evolution of the rate of molecular evolution. Molecular Biology and Evolution 15:1647–1657. doi:10.1093/oxfordjournals.molbev.a025892.
- Tourasse NJ, Li WH. 2000. Selective constraints, amino acid composition, and the rate of protein evolution. Molecular Biology and Evolution 17:656–664. doi:10.1093/oxfordjournals.molbev.a026344.
- Tsutsui K, Bentley GE, Kriegsfeld LJ, Osugi T, Seong JY, Vaudry H. 2010. Discovery and evolutionary history of gonadotrophin-inhibitory hormone and kisspeptin: New key neuropeptides controlling reproduction. Journal of Neuroendocrinology 22:716–727.
- Tsutsui K, Ukena K. 2006. Hypothalamic LPXRF-amide peptides in vertebrates: Identification, localization and hypophysiotropic activity. Peptides 27:1121–1129. doi:10.1016/j.peptides.2005.06.036.
- Ukena K, Osugi T, Leprince J, Vaudry H, Tsutsui K. 2014. Molecular evolution of GPCRs: 26Rfa/GPR103. Journal of Molecular Endocrinology 52:T119–131. doi:10.1530/JME-13-0207.
- Ukena K, Tsutsui K. 2005. A new member of the hypothalamic RF-amide peptide family, LPXRF-amide peptides: Structure, localization, and function. Mass Spectrometry Reviews 24:469–486. doi:10.1002/mas.20031.
- Walker RJ, Papaioannou S, Holden-Dye L. 2009. A review of FMRFamide- and RFamide-like peptides in metazoa. Invertebrate Neuroscience 9:111–153. doi:10.1007/s10158-010-0097-7.
- Xie W, Lewis PO, Fan Y, Kuo L, Chen MH. 2011. Improving marginal likelihood estimation for Bayesian phylogenetic model selection. Systematic Biology 60:150–160. doi:10.1093/sysbio/syq085.
- Zhang Y. 2008. I-TASSER server for protein 3D structure prediction. BMC Bioinformatics 9:40. doi:10.1186/1471-2105-9-40.