
Abstract
The examination of the total length (L) vs. body mass (W) relationship in the blackmouth catshark from the southern Adriatic Sea showed the occurrence of two development phases or growth stanzas in females. The passage from the first stanza (L range: 22.8–37.4 cm) to the following one (L range: 39.7–51.4 cm) was marked by an inflection in the power equation correlating body mass to total length, occurring at about 38.6 cm of length (change point). After the change point, growth became positively allometric. This catshark is a lecitotrophic oviparous continuous spawner, and follicles in different stages of development are simultaneously present in the ovary. The histological analysis of the ovary showed that the smallest vitellogenic follicles were about 2 mm in diameter; the diameter of the largest observed oocyte was 18 mm. The change point occurred slightly before the onset of vitellogenesis (smallest vitellogenic female L = 41.0 cm) and appeared to be related to the activation of the reproductive axis.
Introduction
The blackmouth catshark Galeus melastomus Rafinesque, 1810 (Chondrichthyes: Scyliorhinidae) is an elasmobranch fish distributed in the eastern Atlantic Ocean and the Mediterranean Sea. It is a deepwater bottom species mainly found from 200 to 500 m, but occasionally it occurs at depths up to 55 m and down to 2000 m (Ebert & Stehmann Citation2013). The blackmouth catshark is caught as a by-catch of trawl fishing, and its abundance and its role in food webs make it particularly important in the marine ecosystem (Tursi et al. Citation1993). It is a lecitotrophic oviparous species (Hamlett Citation2005), a continuous spawner that, in the Mediterranean Sea, releases eggs throughout the year on muddy bottoms (Capapé & Zaouali Citation1977; Capapé et al. Citation2008).
Several studies have been carried out on the blackmouth catshark growth and reproductive biology in the Mediterranean Sea (Capapé & Zaouali Citation1977; Tursi et al. Citation1993; Rey et al. Citation2005; Rinelli et al. Citation2005; Capapé et al. Citation2008; Ragonese et al. Citation2009) as well as in the northeastern Atlantic Ocean (Costa et al. Citation2005). In all these studies the fish length–mass relationship, LWR, was modelled by a single-phase correlation equation, i.e. only one equation was derived to describe this relationship throughout the fish whole size range, according to the allometric model W = a Lb. The assessment of the female reproductive state was made using macroscopic criteria (e.g. presence/absence of naked-eye visible oocytes in the ovary; presence/absence of encased eggs in the uterus; ovary, oviducal glands and uterus development; ICES Citation2010, Citation2013) as well as by histological analysis of the ovaries (ICES Citation2010). In both cases, a detailed maturity scale for female blackmouth catshark was derived.
The present study was prompted by the detection of a possible change point in the body length–mass correlation of female blackmouth catsharks collected in the southern Adriatic Sea. Its aims were (1) to model the length–mass relationship throughout the size range of both sexes from the southern Adriatic population – the adequate description of all growth phases of a fish is essential to assess animal growth pattern and to model aquatic ecosystems for fishery purposes (Froese Citation2006) – and (2) to verify the concomitance between any ontogenetic change in the LWR and significant biological events such as the activation of the reproductive axis.
Materials and methods
Specimen sampling and measurement
A total of 126 blackmouth catsharks were sampled in December 2009 in seven commercial bottom trawls in the southwestern Adriatic Sea off Mola di Bari, at depths ranging from 420 to 560 m. The following measurements were taken: total body length, L, approximated to 0.1 cm; body mass, W, approximated to 0.1 g (following removal of stomach contents only); gonad mass approximated to 0.1 g; diameter of largest ovarian follicle, approximated to 0.01 cm. The specimen size ranges were: males, L = 22.0–47.8 cm; W = 24.6–298.4 g; females, L = 22.8–51.4 cm; W = 30.3–428.3 g.
Twenty female specimens, encompassing the whole length range in the sample and representative of the various reproductive conditions according to the reproductive apparatus macroscopic appearance, were selected for ovary microscopic examination. The right gonad, the only one developed and functional in the female blackmouth catshark, was removed and destined for histological analysis.
Statistical treatment of data
In order to analyse the LWR, which is best described by the allometric or power equation model W = a Lb, the data were log-transformed (natural logarithms) and fitted to a linear equation. The distribution of residuals was examined in order to verify the linearity of the (lnL, lnW)i data distribution as well as to detect any outliers to omit from the analyses (Sokal & Rohlf Citation1981); data of one previtellogenic anomalously thin female specimen (L = 34.8 cm, W = 72.3 g) were omitted. Since the female residual plot was V-shaped, thus indicating a possible departure from linearity due to an inflection point in the lnL-lnW regression line, the hypothesis of a two-phase regression was tested by the Likelihood Ratio Test by Quandt (Q-test; Diniz & Brochi Citation2005) according to the two-segment model, which is canonically used to describe two-phase LW correlations, and appeared to fit the present data distribution (cf. Katsanevakis et al. Citation2007 about the regression model choice). Following the detection of the change point, the regressions for the two phases, i.e. “small” and “large” females respectively, were examined and their slopes compared by the Student’s t-test.
The LWR parameters for males and pooled “small” and “large” females were compared with literature data by the log a vs. b plot, and the form factor a3.0 was calculated (Froese Citation2006).
Ovary histological analysis
Ovary samples were fixed in 10% buffered formalin, dehydrated in increasing ethanol concentrations, cleared in xylene and embedded in paraffin wax. Five-micrometer-thick sections were cut and stained with haematoxylin and eosin (H&E). The sections were observed under a light microscope (DIAPLAN, Leitz, Wetzlar, Germany) and photographed using a digital camera (DFC 420, Leica, Cambridge, UK). Follicle measurements were performed using image analysis software (Leica Application Suite, version 3.3.0, Cambridge, UK).
Results
Total length–mass relationship
Females
The residual plot of the (lnL, lnW)i data was V-shaped () and the ensuing Likelihood Ratio Test showed the actual departure from linearity of their distribution (see below), i.e. the occurrence of a two-phase regression. The minimum value of the likelihood ratio was found at k = 41, which corresponds to the (L = 37.4 cm, W = 123.2 g) female. The regression equations for the first k females (“small”) and for the remaining (n – k) females (“large”) were, respectively:
Figure 1. Residual distribution of the ln W = ln a + b ln L regression for females (A) and males (B) of blackmouth catshark from the southern Adriatic Sea.
Their slopes were found to differ significantly (tslope = 2.023; df = 57; Pt = 0.024) (), thus corroborating the actual occurrence of two phases in the lnL–lnW relationship. The LW equations for the two phases in the power form were Ws = 0.00431 Ls2.846 and Wl = 0.000874 Ll3.310, respectively, whereas the pooled, i.e. “small” + “large”, female equation was W = 0.00109 L3.247. Following the change in slope, the weight growth rate increases with respect to the length growth rate: d(Wl/Ll)/dt > d(Ws/Ls)/dt, where the variables Wl, Ll, Ws and Ls are the same as in Equations 1 and 2, t is time and d stays for differential. The inflection point separating the allometric relationship into two distinct phases falls in between the k and k + 1 specimens, i.e. the (L = 37.4 cm, W = 123.2 g) and the (L = 39.7 cm, W = 195.0 g) females respectively, at about 38.6 cm of length. In the first development phase, namely “small” females, the slope b is slightly smaller than, but not significantly different from 3 (t = 1.042; Pt = 0.152, n.s.). In the subsequent development phase, the slope is significantly higher than 3 (t = 1.768; Pt = 0.047), which shows that growth is positively allometric.
Figure 2. Double-logarithmic plot of body mass (W) vs. total length (L) for the two development phases of female blackmouth catshark from the southern Adriatic Sea.
Males
The residuals of the (lnL, lnW)i data were distributed symmetrically with respect to the abscise axis (), thus showing that these data do not evidently depart from linearity. The overall regression equation was:
The slope was significantly higher than 3 (t = 2.897; Pt = 0.003), i.e. male growth is positively allometric. The LW equation in the power form was W = 0.00153 L3.145.
Comparison with literature data
Both male and female log a vs. b plots identified an outlier – the (log a, b) points from Rinelli et al. (Citation2005) – and, after its removal, straight lines tightly fitted the other data points (). The estimated form factor a3.0 was 0.00281 and 0.00301 for males and females, respectively. No significant difference between male and female form factors was detected (t = 0.585; Pt = 0.295).
Figure 3. Plot of natural logarithm of intercept (ln a) vs. slope (b) for five weight-length relationships of females (A) and males (B) of blackmouth catshark. Open circle and open lozenge indicate outliers. Female regression line: ln a = 6.242 – 4.016 b, n = 4, r = 0.999; male regression line: ln a = 5.533 – 3.802 b, n = 4, r = 0.993. (The a values reported in Capapé et al. (Citation2008) and Ragonese et al. (Citation2009), computed from length in mm, were converted in order to be compared with other a values computed from length in cm; the a values reported in Tursi et al. (Citation1993), affected by a printing mistake (G. D’Onghia pers. comm.), were corrected by a 10−1x factor).
Ovary histological analysis and sexual maturity
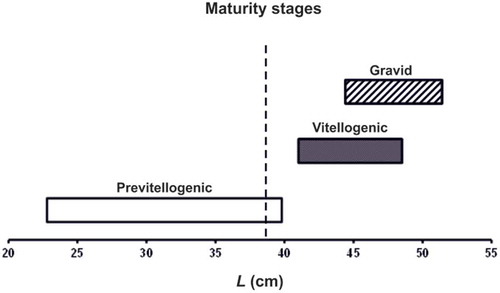
The functional ovary of blackmouth catshark was constituted of numerous follicles in different developing stages. Unyolked follicles () were characterized by oocytes with slightly basophilic, granular ooplasm, a homogeneous zona pellucida and a single layer of flat to isoprismatic follicle cells. Yolked follicles () widely ranged in diameter, from 2 to 18 mm. These follicles showed oocytes progressively filled with acidophilic yolk globules, a zona pellucida with homogeneous appearance and different layers of follicle cells. Mature ovaries () had oocytes in all stages of development, a few of them fully yolked and 18 mm in diameter. Among the females with fully mature oocytes there were some with fertilized, encapsulated eggs in their uteri. As shown in , the largest female with only previtellogenic follicles was 39.8 cm long, and the smallest female with vitellogenic follicles was 41.0 cm long. The ovary mass of previtellogenic females weighed ≤ 0.2 g, whereas the ovary mass of vitellogenic females weighed ≥ 0.3 g. The smallest egg-laying female, i.e. with fertilized and encapsulated eggs in its uteri, was 44.4 cm long; the largest unfertilized female was 48.5 cm long. All egg-laying females bore an equal quantity of eggs in either gonoduct: six females ranging from 44.4 to 50.6 cm in L had one egg per uterus; the two largest specimens (L = 51.0 and 51.4 cm) bore two eggs per uterus. In the egg-laying females, the largest oocyte ranged from 14 to 18 mm in diameter. Moreover, one female (L = 50.3 cm) contained one elongated egg in each nidamental gland that was undergoing the encasing process.
Figure 4. Ovaries of blackmouth catshark from the southern Adriatic Sea in different maturity stages. (A) Section of an immature ovary from an individual with total length (L) 32 cm, showing unyolked oocytes of different size. Haematoxylin and eosin (H&E) staining. (B) Particular of an unyolked oocyte, 1.5 mm in diameter, from an immature specimen 34 cm L. H&E staining. (C) Particular of a yolked oocyte, 4 mm in diameter, from a ripening individual with 48 cm L. H&E staining. (D) Ovary from an individual with 50 cm L showing some mature oocytes 18 mm in diameter. Scale bars: A, 100 µm. B, C, 50 µm. D, 2 cm. Arrowhead, zona pellucida; asterisk, mature oocyte; fc, follicle cell layer; oo, ooplasm; t, theca; uo, unyolked oocyte.
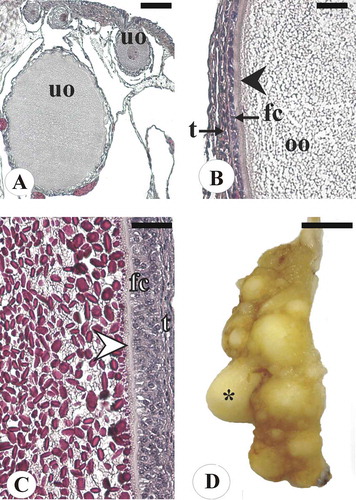
Figure 5. Total length (L) of the female blackmouth catshark from the southern Adriatic Sea at different maturity stages. Vertical broken line: change point.
Discussion
The present study reveals that the relationship between body length and body mass in female blackmouth catshark has two development phases or growth stanzas, which are best described by two distinct power equations. That for “small” females has a slope value slightly smaller than 3 (isometry value) but not significantly different from that. The equation describing the “large” female correlation has a slope significantly larger than 3, which indicates a positively allometric growth, i.e. in this phase there is a faster increase in body mass. The length–mass relationship for blackmouth catshark was already examined by other authors (Tursi et al. Citation1993; Rinelli et al. Citation2005; Capapé et al. Citation2008; Ragonese et al. Citation2009) who, however, did not point out any occurrence of growth disharmony in the correlation between the two variables for either sex. Indeed, most of these authors used large samples collected on wide areas and wide depth ranges, during several years and encompassing different seasons. Hence, each of their LWRs is an average representation of different LWRs for the various biological and ecological situations (cf. Froese Citation2006; Katsanevakis et al. Citation2007, and references therein cited about the variability of LWR according to different bio-ecological parameters). This fact might obscure the change point in the LWR. On the other hand, some authors might have just disregarded a search for discontinuity in the correlation between body mass and length. Conversely, the use of small samples to derive LWR, as long as specimens are evenly distributed along the species size range and collected in a restricted time and geographical range – as in our case – may yield appropriate LWR equations (Froese Citation2006). Besides, the equations shown in the present paper cannot be deemed representative of the whole southern Adriatic Galeus melastomus (sub)population, because of seasonal, depth and sample constraints (for instance, we did not sample nor use specimens smaller than 22 cm, which, however, are often netted during scientific surveys).
The computation of overall LW regression equations is biased by the ontogenetic increase in slope: when small specimens are overrepresented in the sample, b is smaller and a is larger with respect to samples mostly composed by large animals. That is why the parameters of four available pairs of LWR equations (Tursi et al. Citation1993; Capapé et al. Citation2008; Ragonese et al. Citation2009; present results) were fairly different (males: b = 2.79–3.14, a = 0.0015–0.0059; females: b = 2.86–3.25, a = 0.0011–0.0051). Nevertheless they were found to be congruent with each other, as shown by the tightly fitting log a vs. b correlation for either sex (). On the contrary, the LWR equation parameters reported by Rinelli et al. (Citation2005) for samples from the South Tyrrhenian Sea did not fit the general pattern of the plot (); according to Froese (Citation2000), the estimates that are clearly below or above the log a vs. b regression line appear to be questionable.
The estimated form factor a3.0 values (0.00281 and 0.00301 for males and females, respectively) according to Froese (Citation2006) place the blackmouth catshark between “eel-like” and “elongated” forms, and show that females are slightly plumper than males.
The fact that the ontogeny of fishes involves progress through development phases, defined growth stanzas, is widely accepted (Froese Citation2006; Katsanevakis et al. Citation2007). The passage from one stanza to the following one is particularly significant during the fish’s early life, viz. from larval to juvenile stage and from juvenile to adult stage (Peck et al. Citation2005; Froese Citation2006; Nika Citation2013). During these transitions, abrupt modifications in fish somatic growth occur, which may be detected as changes in allometric proportions between pairs of dimensional variables (Katsanevakis et al. Citation2007 and references cited therein). In most of these cases, two-phase LWR models have been described, with the inflection point in the neighborhood of sexual maturity (Peck et al. Citation2005; Froese Citation2006; Nika Citation2013) although Katsanevakis et al. (Citation2007) showed that different models may better describe different situations. Incidentally, changes in somatic proportions at the passage from one growth stanza to the following one is a widespread phenomenon. It has been described in other marine taxa too, including invertebrates (Katsanevakis et al. Citation2007).
The somatic growth of fishes is strongly influenced by environmental factors, such as temperature and food availability (Peck et al. Citation2005; Froese Citation2006; Katsanevakis et al. Citation2007 and references cited therein; Nika Citation2013) as well as by endocrine factors (Blázquez et al. Citation1998; Canosa et al. Citation2007). Moreover, a strict relationship between body growth pattern and the onset of sexual maturity (i.e. puberty) has been reported in fishes (Taranger et al. Citation2010 and references cited therein). In other words, the achievement of puberty itself, which is related to abrupt changes in the hormone profile, affects the growth rate of individuals (Taranger et al. Citation2010).
In the blackmouth catshark from the southern Adriatic Sea as well, the inflection point in the curve correlating body mass to length occurred when females were about 38–39 cm long, i.e. at a size shortly preceding the onset of vitellogenesis (see below); incidentally, Capapé and Zaouali (Citation1977) reported that vitellogenesis starts at about the same size (L = 39 cm) in females from the Tunisian sea. The positive allometric growth in the second phase is likely related to the need to accommodate the sexual products in the abdominal cavity, namely a large ovary and the egg-bearing uteri, and reflects the mass accumulation of these organs, as well as of other organs such as the liver, which plays a role during vitellogenesis (Capapé et al. Citation2008).
No growth disharmony was disclosed in the male LWR, despite the passage of individuals of this sex through growth stanzas, as shown by the modifications in the allometric growth of claspers, i.e. pterygopods (Capapé et al. Citation2008).
The occurrence of LW growth disharmony was also described in both females and males of the smallspotted catshark Scyliorhinus canicula Linnaeus, 1758 (Scyliorhinidae), a species systematically close to the blackmouth catshark, at about the onset of sexual maturity (Jardas Citation1979). This author, however, did not show whether the differences between the regression equations of the two phases were statistically significant, nor did the author calculate any precise change point. As reported in the present results, we did not detect any growth disharmony in male blackmouth catshark.
In female blackmouth catshark, as in other elasmobranchs, in addition to macroscopic scales based on ovary appearance, various parameters have been used as markers of sexual maturity: ovary length, width and mass, oviduct length, uterus length and width, nidamental gland length and width (Wass Citation1973; Castro et al. Citation1988; Yano Citation1993; Conrath Citation2004; Costa et al. Citation2005). In the present work, whose aim was other than assessing the first sexual maturity of the species, the presence of yolked oocytes was considered a marker of the activation of the reproductive axis, based on the well-supported consideration that vitellogenin, the egg yolk precursor, is synthesized in the liver in response to estrogen stimulation (Lubzens et al. Citation2010; Pousis et al. Citation2011, Citation2012).
Oogenesis in blackmouth catshark is morphologically similar to that described in other elasmobranchs (Prisco et al. Citation2007; Serra-Pereira et al. Citation2011). Vitellogenesis intervenes in oocytes with a diameter equal to or greater than 2 mm where large quantities of acidophilic yolk globules are accumulated at seemingly different rates, so that different size oocytes are present at the same time in the ovary. In the ovary of mature fish, the largest oocytes reach 18 mm in diameter, which likely represents about the size at which oocytes are ovulated (Capapé et al. Citation2008; present results).
According to the objective classification criterion of the presence of yolked follicles, the smallest female blackmouth catshark with an active reproductive axis in our samples was 41 cm long, which is slightly more than body length at the inflection point in the length–mass correlation curve. This observation, which is congruous with the general concept that the pattern of body growth in vertebrates is influenced by sexual (and other) hormones, corroborates the reliability of the biphasic length–mass correlation model as well as the estimated inflection point reported in the present study. From an endocrine standpoint, the strict synergy between somatotrophic and reproductive axes, which has been largely documented in fish, can explain the association between the attainment of sexual maturity and the change in growth pattern. In fishes, gonadotropin-releasing hormone (GnRH) released from hypothalamic neurons stimulates the activity of both gonadotropes and somatotropes, which are co-localized in the pituitary proximal pars distalis (Canosa et al. Citation2007). On the other hand, the growth hormone (GH) produced by somatotropes stimulates the gonadal synthesis of steroid hormones, which, in turn, seem to play a role in the activation of the reproductive axis during puberty (Blásquez et al. Citation1998).
To conclude, the female blackmouth catshark LWR is best described by two different equations, one for reproductively immature specimens (i.e. previtellogenic) and the other for reproductively active specimens (i.e. vitellogenic/ripening and mature), rather than by just one for all females regardless of their size and maturity stage. Hence, in the case of female blackmouth catshark, two different correlation equations should be used accordingly for each growth phase. Conversely, the use of a single equation to model the LW correlation throughout the whole size range of females is inappropriate; moreover, it is biased toward either the juvenile or the maturing and mature parameters depending on the quantity of juvenile or adult female specimens that are respectively available to compute that equation.
Despite denigrations of the usefulness of LWR in fishery management (cf. Froese Citation2006), the use of accurate length–mass relationships in fishery applications is quite relevant to modeling aquatic ecosystems (Froese Citation2006). Moreover, apart from LWR applicative usage, the study of correlations between animal body parts and their relative dimensional modifications during ontogeny is essential by itself in biological research, as shown by the centuries-long efforts to model the shapes of living creatures (Froese Citation2006), starting with Galileo Galilei’s Discorsi e dimostrazioni matematiche intorno a due nuove scienze from 1638.
Acknowledgements
We thank Nicola Parente, captain of the trawler Rina III, for providing blackmouth catsharks, and Michele Carrassi for taking microscopic pictures of blackmouth catshark ovaries. We also thank Robert Vassallo-Agius for critically reading the manuscript, and Rainer Froese for providing useful suggestions. We are grateful to an anonymous reviewer whose comments improved our paper.
References
- Blázquez M, Bosma PT, Fraser EJ, Van Look KJW, Trudeau VL. 1998. Fish as models for the neuroendocrine regulation of reproduction and growth. Comparative Biochemistry and Physiology C 119:345–364.
- Canosa LF, Chang JP, Peter RE. 2007. Neuroendocrine control of growth hormone in fish. General and Comparative Endocrinology 151:1–26. doi:10.1016/j.ygcen.2006.12.010.
- Capapé C, Guélorget O, Vergne Y, Reynaud C. 2008. Reproductive biology of the blackmouth catshark, Galeus melastomus (Chondrichthyes: Scyliorhinidae) off the Languedocian coast (southern France, northern Mediterranean). Journal of the Marine Biological Association of the UK 88:415–421. doi:10.1017/S002531540800060X.
- Capapé C, Zaouali J. 1977. Contribution à la biologie des Scyliorhinidae des côtes tunisiennes. VI: Galeus melastomus Rafinesque, 1810. Répartition géographique et bathymétrique, sexualité, reproduction, fécondité. Cahiers de Biologie Marine 18:449–463.
- Castro JI, Bubucis PM, Overstrom NA. 1988. The reproductive biology of the chain dogfish, Scyliorhinus retifer. Copeia 1988:740–746. doi:10.2307/1445396.
- Conrath CL. 2004. Reproductive biology. In: Musick JA, Bonfil R, editors. Elasmobranch fisheries management techniques. Singapore: APEC Fisheries Working Group, Asia-Pacific Economic Cooperation. pp. 133–164.
- Costa ME, Erzini K, Borges TC. 2005. Reproductive biology of the blackmouth catshark, Galeus melastomus (Chondrichthyes: Scyliorhinidae) off the south coast of Portugal. Journal of the Marine Biological Association of the UK 85:1173–1183. doi:10.1017/S0025315405012270.
- Diniz C, Brochi L. 2005. Robustness of two-phase regression test. REVSTAT Statistical Journal 3:1–18.
- Ebert DA, Stehmann MFW. 2013. Sharks, batoids, and chimaeras of the North Atlantic. FAO Species Catalogue for Fishery Purposes. No. 7. Rome: FAO. 523 pp.
- Froese R. 2000. Evaluating length–weight relationships. In: Froese R, Pauly D, editors. FishBase 2000: concepts, design and data sources. Los Banños, Laguna, Philippines: ICLARM. p. 133.
- Froese R. 2006. Cube law, condition factor and weight-length relationships: History, meta-analysis and recommendations. Journal of Applied Ichthyology 22:241–253. doi:10.1111/j.1439-0426.2006.00805.x.
- Hamlett WC. 2005. Reproductive biology and phylogeny of Chondrichthyes: Sharks, batoids and chimaeras. New Hampshire: Sciences Publishers, Inc.
- ICES. 2010. Report of the Workshop on Sexual Maturity Staging of Elasmobranches (WKMSEL), 11-15 October 2010, Valletta, Malta. ICES CM 2010/ACOM:48. 32 pp.
- ICES. 2013. Report of the workshop on Sexual Maturity Staging of Elasmobranchs (WKMSEL), 11-14 December 2012, Lisbon, Portugal. ICES CM 2012/ACOM:59. 66 pp.
- Jardas I. 1979. Morfološke, biološke i ekološke karakteristike populacije mačke bljedice, Scyliorhinus canicula (Linnaeus, 1758), u Jadranskom moru. Izvješća – Reports Ribarstveno-biološka ekspedicija m/b “Hvar” 1948-49, Institut za Oceanografiju i Ribarstvo Split 4:1–104.
- Katsanevakis S, Thessalou-Legaki M, Karlou-Riga C, Lefkaditou E, Dimitriou E, Verriopoulos G. 2007. Information-theory approach to allometric growth of marine organisms. Marine Biology 151:949–959. doi:10.1007/s00227-006-0529-4.
- Lubzens E, Young G, Bobe J, Cerdà J. 2010. Oogenesis in teleosts: How fish eggs are formed. General and Comparative Endocrinology 165:367–389. doi:10.1016/j.ygcen.2009.05.022.
- Nika N. 2013. Change in allometric length–weight relationship of Salmo trutta at emergence from the red. Journal of Applied Ichthyology 29:294–296. doi:10.1111/jai.12008.
- Peck MA, Clemmesen C, Herrmann J-P. 2005. Ontogenic changes in the allometric scaling of the mass and length relationship in Sprattus sprattus. Journal of Fish Biology 66:882–887. doi:10.1111/j.0022-1112.2005.00651.x.
- Pousis C, De Giorgi C, Mylonas CC, Bridges CR, Zupa R, Vassallo-Agius R, De La Gándara F, Dileo C, De Metrio G, Corriero A. 2011. Comparative study of liver vitellogenin gene expression and oocyte yolk accumulation in wild and captive Atlantic bluefin tuna (Thunnus thynnus L.). Animal Reproduction Science 123:98–105. doi:10.1016/j.anireprosci.2010.10.005.
- Pousis C, Santamaria N, Zupa R, De Giorgi C, Mylonas CC, Bridges CR, De La Gándara F, Vassallo-Agius R, Bello G, Corriero A. 2012. Expression of vitellogenin receptor gene in the ovary of wild and captive Atlantic bluefin tuna (Thunnus thynnus). Animal Reproduction Science 132:101–110. doi:10.1016/j.anireprosci.2012.03.014.
- Prisco M, Liguoro A, Ricchiari L, Del Giudice G, Andreuccetti P. 2007. Oogenesis in the spotted ray Torpedo marmorata. Reviews in Fish Biology and Fisheries 17:1–10. doi:10.1007/s11160-006-9013-y.
- Ragonese S, Nardone G, Ottonello D, Gancitano S, Giusto GB, Sinacori G. 2009. Distribution and biology of the blackmouth catshark Galeus melastomus in the Strait of Sicily (central Mediterranean Sea). Mediterranean Marine Science 10:55–72. doi:10.12681/mms.122.
- Rey J, De Sola LG, Massut E. 2005. Distribution and biology of the blackmouth catshark Galeus melastomus in the Alboran Sea (Southwestern Mediterranean). Journal of Northwest Atlantic Fishery Science 35:215–223.
- Rinelli P, Bottari T, Florio G, Romeo T, Giordano D, Greco S. 2005. Observations on distribution and biology of Galeus melastomus (Chondrichthyes, Scyliorhinidae) in the southern Tyrrhenian Sea (central Mediterranean). Cybium 29:41–46.
- Serra-Pereira B, Figueiredo I, Gordo LS. 2011. Maturation of the gonads and reproductive tracts of the thornback ray Raja clavata, with comments on the development of a standardized reproductive terminology for oviparous elasmobranchs. Marine and Coastal Fisheries 3:160–175. doi:10.1080/19425120.2011.555707.
- Sokal RR, Rohlf FJ. 1981. Biometry. 2nd. New York: Freeman & Co.
- Taranger GL, Carrillo M, Schulz RW, Fontaine P, Zanuy S, Felip A, Weltzien F-A, Dufour S, Karlsen Ø, Norberg B, Andersson E, Hansen T. 2010. Control of puberty in farmed fish. General and Comparative Endocrinology 165:483–515. doi:10.1016/j.ygcen.2009.05.004.
- Tursi A, D’Onghia G, Matarrese A, Piscitelli G. 1993. Observations on population biology of the blackmouth catshark Galeus melastomus (Chondrichthyes, Scyliorhinidae) in the Ionian Sea. Cybium 17:187–196.
- Wass RC. 1973. Size, growth and reproduction of the sandbar shark, Carcharhinus milberti, in Hawaii. Pacific Science 27:305–318.
- Yano K. 1993. Reproductive biology of the slender smoothhound, Gollum attenuatus, collected from New Zealand waters. Environmental Biology of Fishes 38:59–71. doi:10.1007/BF00842904.