
Abstract
Natural and semi-natural habitats are declining. However, little is known of the value of artificial and human-altered habitats for biodiversity maintenance in fragmented landscapes. We hypothesized that railway tracks can have great value for butterflies as an alternative habitat. Using 200-m-long transects, we investigated species richness and two main types of β-diversity, i.e. nestedness and community dispersion, for both butterflies and their nectar plants in eight sites under an expected gradient of habitat quality – meadows, railway tracks, forest clearings and degraded meadows. Railway tracks and meadows had higher butterfly species richness than forest clearings and degraded meadow. Butterfly species distribution among sites was strongly related to the gradient of habitat quality that was measured as nectar plant composition. Railway tracks contained the widest pool of butterflies with species of various biotopes as well as a wide pool of nectar plants at a nested subset pattern of β-diversity. However, the pattern of community dispersion was opposite to what had been expected. Meadows and railway tracks, being more heterogeneous sites in terms of composition of nectar plants, supported slightly more homogeneous butterfly communities. This suggests that habitats of low quality, i.e. forest clearings and degraded meadows, have less-stable butterfly communities. We concluded that railway tracks located on sun-warmed embankments containing a reach pool of nectar plants could enable multi-species communities to persist in an environment of good suitability. Conservation managers should therefore focus on enhancing the quality of railway tracks and their vicinity through the preservation of a high abundance of various flowering plants.
Introduction
Habitat fragmentation is one the most relevant causes of rapid and global change in the natural environment. It has led to a decrease in many species populations (Fahrig & Merriam Citation1994; Fahrig Citation2003; Thomas et al. Citation2004; Foley et al. Citation2005) due to habitat degradation and increasing patch isolation (Andrén Citation1994; Fahrig Citation2003). Moreover, in fragmented landscapes, patterns of species distribution often shift towards the nested subset pattern, in which some habitats are a subset of others that contain a wider pool of species (Atmar & Patterson Citation1993; Fischer & Lindenmayer Citation2005; Driscoll Citation2008). In Europe, xerothermic grasslands and meadows are among the most important habitats for biodiversity preservation, and they are inhabited by many species, including butterflies such as umbrella Maculinea (currently Phengaris) butterflies and other species, listed in the Habitats Directive (WallisDeVries et al. Citation2002; Wynhoff et al. Citation2011; Van Swaay et al. Citation2012). However, the aforementioned habitats are declining and therefore endangered (WallisDeVries et al. Citation2002; Wynhoff et al. Citation2011). Attention is usually focused on the conservation of target or rare species with specific requirements (e.g. Schtickzelle et al. Citation2006; Bąkowski et al. Citation2010; Wynhoff et al. Citation2011; Kalarus et al. Citation2013); nevertheless, other common and widespread species also are in decline (Van Dyck et al. Citation2009). Thus, the conservation of multi-species communities has become problematic and particularly challenging (Settele et al. Citation2009).
The above considerations raise the question as to what might be the value of artificial and human-altered habitats for biodiversity conservation. Recently, Yan Chong et al. (Citation2014) revealed that sites with artificial greenery cannot replace natural and semi-natural habitats since they support lower diversity in multi-species communities. However, we expect that some human-created artificial habitats such as railway tracks may have similar value for the persistence of species populations as semi-natural habitats. The building of railways was often associated with felling, and at first glance this may seem to have a negative impact on biodiversity. For instance, species decline was correlated positively with dense railway and highway networks (Konvicka et al. Citation2006). Nevertheless, we predict that railway tracks may successfully function as forest clearings and may support the dispersion of both forest and grassland insects, providing an environment of good suitability.
In accordance with these assumptions, we hypothesized that in fragmented landscapes (1) butterfly β-diversity shows nested subset pattern in species communities; (2) linear landscape elements such as railway tracks contain a wider pool of species than forest clearings and degraded meadows; (3) railway tracks and meadows are characterized by greater community dispersion than are forest clearings and degraded sites.
Methods
Study sites
We selected eight sites located near Ozorków in central Poland. Site I – periodically flooding, lowland hay meadow (ca. 0.4 ha) – was surrounded by field crops and allotment gardens. Site II – a dry, sandy meadow (ca. 0.5 ha) – had partly the character of wasteland and was surrounded by farms, fields and bushes. Site III – railway tracks – was located on a gentle and sun-warmed hill ca. 1.5 km from a large forest complex. The site had a length of ca. 1.2 km. It was surrounded mainly by small patches of trees and shrubs as well as fields and wastelands. Regular domestic lines run on these tracks. Site IV – forest clearing “Grotniki” (ca. 0.3 ha) – was a dry grassland surrounded by forest with a predominant share of pine and silver birch. Site V – forest clearing “Chociszew” (ca. 0.2 ha) – was surrounded mainly by pine forest. Site VI – forest clearing “Pustkowa Góra” (ca. 0.2 ha) – was surrounded by pine forest. Site VII – forest clearing “Sokolniki” (ca. 0.2 ha) – was surrounded by forest with a predominant share of pine as well as with oak and silver birch. Site VIII – degraded meadow – was overgrown with reeds (ca. 0.5 ha).
Fieldwork
The study was carried out from 17 May to 12 September 2004 between 09:00 and 16:00 during rainless days. The interval between consecutive observations on particular sites was approximately 1 week. The duration of the visit to each site was approximately 1.5 hours. In all the sites, 5-m-wide and 200-m-long transects were established, at which the occurrences of butterfly species and nectar plant species were recorded using the standard Pollard walk method (Pollard & Yates Citation1993). We considered as nectar sources all the plants at which nectaring was observed during the study. We adopted a composition of nectar plant species at each site as a relative measure of habitat quality and habitat heterogeneity, as well as availability of resources for butterflies.
Statistical analysis
To test whether meadows and railway tracks, as sites with potentially large suitability for butterflies, have greater species richness than forest clearings and degraded meadows, as sites with potentially low suitability, we performed the bootstrap-t test with a resampling procedure using Rundom Pro 3.14 software (Jadwiszczak Citation2009). An analogous analysis was applied for nectar plants that are considered in all analyses as an index of habitat quality.
The main analysis of our study involved the investigation of β-diversity patterns. Two main types of β-diversity can be recognized (see Anderson et al. Citation2011). Firstly, the composition of a species community can vary along some environmental gradients, e.g. gradient of habitat quality, because of a loss or gain of species. There are several main patterns of species distribution among sites, such as species turnover or nestedness (Leibold & Mikkelson Citation2002). Secondly, the composition of communities can be different within a given set of environmental conditions. We considered the first kind of variation as a nested subset (Atmar & Patterson Citation1993) and the second as community dispersion connecting directly with multivariate dispersion (Anderson et al. Citation2006, Citation2011).
To verify whether the butterfly and nectar plant communities recorded in particular sites represent nested subsets of the same, reach-wide pool of species, the presence-absence matrices of species occurrence were analyzed using a nestedness calculator of Atmar and Patterson (Citation1995). This software compares the unexpected presence/absence of species at particular sites with the null model of maximum disorder of species occurrence at all sites (Atmar & Patterson Citation1993).
The vegan package (Oksanen et al. Citation2013) of software R version 3.0.2 (R Core Team Citation2013) was used for an analysis of community dispersion for butterfly and nectar plant communities, performed with the permutation procedure. However, application of this test is possible only with discrete groups. According to our hypothesis and results from previous analysis, we were able to distinguish two groups of sites: sites with high species richness of both butterflies and nectar plants (sites of high habitat quality), containing meadows and railway tracks, and sites with low species richness (sites of low habitat quality), containing forest clearings and degraded meadow. The analysis was carried out based on both classic and basic Euclidean distance, and Raup–Crick distance. Since the Euclidean distance is not the best measure of ecological distance (Kindt & Coe Citation2005; Anderson Citation2006), we also used the Raup–Crick distance which is a measure of dissimilarity only for presence/absence data. Moreover, it provides a correction of bias caused by difference in α-diversity (see Vellend et al. Citation2007). Community dispersion was measured as the distance in the principal coordinate space of each site from its group centroid. Pairwise permutational F-tests, analogous to Levene's test to compare variance homogeneity, with 999 permutations were applied to find out if multivariate dispersion was the same across the groups (see Anderson Citation2006 for details).
Results
Bootstrap t-tests revealed that the group of sites containing meadows and railway tracks had greater species richness of both butterflies (t = 5.538, P = 0.003) and nectar plants (t = 3.927, P = 0.009) than the group containing forest clearings and degraded meadow. We checked for spatial autocorrelation in species richness with Moran's I using SAM software (Rangel et al. Citation2010). Finally, we found that the species richness of the study sites was spatially independent for both butterflies (P = 0.767) and nectar plants (P = 0.845).
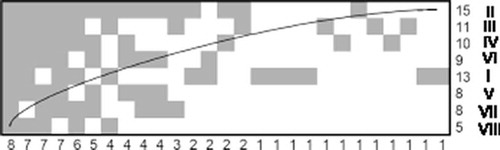
The investigated butterfly communities were significantly nested (Tobserved = 34.1° < Tmean = 54.2° ± 5.94°; P = 0.00036; ), while nectar plant communities only tended to be nested (Tobserved = 35.1° < Tmean = 50.7 ± 7.56°; P = 0.01990; and Supplementary material). In the case of butterfly communities, railway tracks and degraded meadow were idiosyncratic sites (), but communities of forest clearings and degraded meadow contained the most idiosyncratic species, defined mainly by unexpected presence (). In turn, the lowland hay meadow was an idiosyncratic site due to its nectar plant composition (). The order of sites generally revealed that forest clearings and degraded meadow are subsets of railway track and meadows in terms of both butterfly species composition and composition of nectar plant species ( and ). Moreover, in the railway track community there were butterfly species associated with both grasslands and forests ().
Figure 1. Nested subset pattern of butterfly species composition. (a) Matrix of nestedness; columns represent species, rows represent sites. Numbers under the matrix denote number of species occurrences, while numbers next to rows are species richness in particular sites. Species codes are denoted with letters (for figures a and c); roman numerals represent site codes (for figures a and b). (b) Idiosyncratic temperatures by sites; (c) idiosyncratic temperatures by species. Idiosyncratic site or species may be recognized by an idiosyncratic temperature higher than the system temperature of the matrix. The system temperature is presented as a horizontal line. I: lowland hay meadow; II: dry meadow; III: railway track; IV: forest clearing; V: forest clearing; VI: forest clearing; VII: forest clearing; VIII: degraded meadow. A: Coenonympha pamphilus (Linnaeus, 1758), Gonepteryx rhamni (Linnaeus, 1758), Maniola jurtina (Linnaeus, 1758), Pieris napi (Linnaeus, 1758), Pieris rapae (Linnaeus, 1758); B: Polyommatus icarus (Rottemburg, 1775); C: Boloria dia (Linnaeus, 1767); D: Aphantopus hyperantus (Linnaeus, 1758); E: Hyponephele lycaon (Rottemburg, 1775); F: Issoria lathonia (Linnaeus, 1758); G: Melanargia galathea (Linnaeus, 1758); H: Lycaena phlaeas (Linnaeus, 1761); I: Lycaena tityrus (Poda, 1761); J: Argynnis aglaja (Linnaeus, 1758); K: Pieris brassicae (Linnaeus, 1758); L: Lycaena alciphron (Rottemburg, 1775); M: Vanessa atalanta (Linnaeus, 1758); N: Plebejus agestis (Denis & Schiffermüller, 1775); O: Aglais urticae (Linnaeus, 1758); P: Pontia edusa (Fabricius, 1777); Q: Aglais io (Linnaeus, 1758); R: Cupido argiades (Pallas, 1771); S: Lycaena dispar (Haworth, 1802); T: Thymelicus sylvestris (Poda, 1761); U: Thymelicus lineola (Ochsenheimer, 1808); V: Polyommatus coridon (Poda, 1761); W: Araschnia levana (Linnaeus, 1758); X: Papilio machaon (Linnaeus, 1758); Y: Vanessa cardui (Linnaeus, 1758); Z: Celastrina argiolus (Linnaeus, 1758); a: Coenonympha arcania (Linnaeus, 1761); b: Anthocharis cardamines (Linnaeus, 1758); c: Leptidea sinapis (Linnaeus, 1758)/reali Reissinger, 1990; d: Carcharodus alceae (Esper, 1780); e: Polygonia c-album (Linnaeus, 1758); f: Lasiommata megera (Linnaeus, 1767); g: Colias hyale (Linnaeus, 1758); h: Argynnis paphia (Linnaeus, 1758).
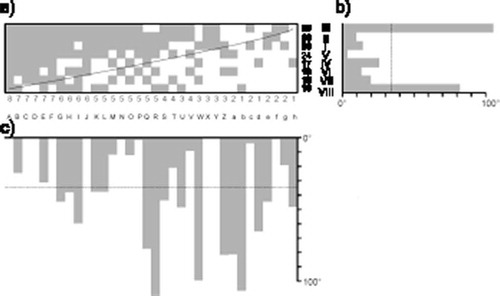
Figure 2. Nested subset pattern of composition of nectar plant species. Columns in the matrix represent species, and rows represent sites. Numbers under the matrix denote number of species occurrences, while numbers next to rows are species richness in particular sites. Roman numerals represent site codes. I: lowland hay meadow; II: dry meadow; III: railway track; IV: forest clearing; V: forest clearing; VI: forest clearing; VII: forest clearing; VIII: degraded meadow.
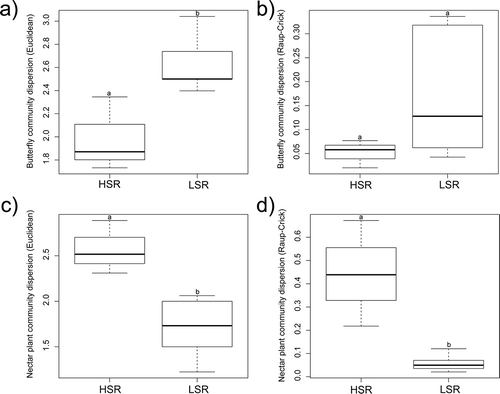
In community dispersion, based on Euclidean distances, we detected significant differences between groups for both butterflies (pseudo-F = 10.089; P = 0.016) and nectar plants (pseudo-F = 12.847; P = 0.034), but after controlling α-diversity with Raup–Crick distances there were differences for nectar plants (pseudo-F = 15.156; P < 0.001), and none were found for butterflies (pseudo-F = 2.204; P = 0.166; ). Finally, sites with high butterfly and nectar plant species richness (sites of good habitat quality) appeared to have slightly lower community dispersion of butterflies than sites with low species richness (sites of low habitat quality; ), while for nectar plants, sites with high species richness (sites of good quality) had significantly higher community dispersion ().
Figure 3. Boxplots of community dispersion measured with Euclidean distances (a, c) and Raup–Crick distances (b, d) for butterflies (a, b) and butterfly nectar plants (c, d), presenting comparisons between sites with high species richness (HSR) containing meadows and railway track, and sites with low species richness (LSR) containing forest clearings and degraded meadow, overgrown with reeds. Letters above represent results from pairwise permutational tests of significance (999 permutations); groups that do not have the same letter are significantly different in their community dispersion.
To verify whether differences in Raup–Crick distances were artefacts of differences in geographical distances (i.e. spatial autocorrelation in community composition), we performed Mantel tests with 999 permutations using R software. Raup–Crick distances were not significantly related with distances between sites for either butterflies (r = 0.1549, P = 0.265) or nectar plants (r = –0.1571, P = 0.648).
Discussion
In fragmented landscapes, artificial and human-created habitats such as railway tracks may have a similar conservation value for butterflies to semi-natural habitats. We detected that species distribution among sites is strongly related to the gradient of habitat quality. Our results indicated that railway tracks contain a reach-wide pool of butterfly species as well as nectar plant species at a nested subset pattern of β-diversity, and consequently they have potential value for both grassland and forest butterflies. These sites seem to enable multi-species communities to persist in an environment of good suitability and quality, as revealed by the nectar plant richness and specific microclimatic conditions. The suitability of railway tracks for butterflies may be expressed in three ways: (1) as a habitat for species that end a complete lifecycle; (2) as a habitat for adult individuals; and (3) as a dispersal corridor. We proved that railway tracks, if they are located in forests, might successfully replace forest clearings. Furthermore, the railway track in our study turned out to be an idiosyncratic site. Thus, we can conclude that specific environmental conditions occur in this site that promote various species with different requirements such as the forest specialist Lasiommata megera, xerothermophilous Polyommatus coridon and even Lycaena dispar. Drier habitats in railway tracks seem to be able to serve as alternative habitats for xerothermophilous butterflies that may live and reproduce at such sites (cf. Konvicka & Kadlec Citation2011).
On the other hand, we detected a pattern in community dispersion that was opposite to what we had expected. Sites that are of good quality (with high nectar plant richness) and are generally heterogeneous in terms of their composition of nectar plants support slightly more homogeneous butterfly communities, in which, in turn, high species richness was found. However, species composition in generally heterogeneous butterfly communities at low-quality sites is to a great extent random due to the occurrence of idiosyncratic species, and consequently it may be shaped by loss and gain of species (cf. Atmar & Patterson Citation1993; Fischer & Lindenmayer Citation2005). An important confirmation of this interpretation is that there were many unexpected presences and absences in the butterfly species matrix at sites of low quality, while more homogeneous butterfly communities at good-quality sites tended to have more stable species composition due to a larger habitat heterogeneity. Sites that are more heterogeneous provide suitable resources, i.e. shelter and forage for many species (Dennis Citation2010; Yan Chong et al. Citation2014). It could be predicted that longer tracks located on sun-warmed embankments are more heterogeneous, e.g. in terms of vegetation height or bare ground cover, which promote other pollinators such as solitary bees (Potts et al. Citation2005). Therefore, the conservation of these sites is necessary for the long-term persistence of species populations on a large landscape scale (Oliver et al. Citation2010). On the other hand, exposure of the tracks may be an important limiting factor. Railway tracks that are not located on embankments may be characterized by extremely different conditions such as lower temperature, high vegetation and a lower source of nectar plants; therefore, their lower value should be expected.
The value of railway tracks may not be so great as that of calcareous xerothermic grassland or wet meadows with Molinion vegetation, characterized by high biodiversity. For instance, we found that hay meadow is in some manner disconnected with the nested pattern in terms of specific plant species composition. The suitability of linear structures depends on the surrounding landscape; the grassland cover and number of plant species positively affect the butterfly abundance and species richness for butterflies inhabiting road verges (Skórka et al. Citation2013). Nevertheless, we confirmed that artificial habitats such as railway tracks seem to be essential for the conservation of biodiversity in fragmented and urban landscapes. The conservation value of other linear structures, e.g. power lines, in landscapes for butterflies and bees has been raised (e.g. Russel et al. Citation2005; Lensu et al. Citation2011), but these habitats are not as greatly altered as railway tracks are, and mainly they constitute natural or semi-natural habitats such as grasslands or mires. Besides, Tryjanowski et al. (Citation2014) showed that power lines have value for some birds due to their providing suitable nesting sites. However, it should be mentioned that in the surroundings of power lines in this study landscape (intensive farmland area), there was a shortage of other suitable habitats. Therefore, the good suitability and quality of power line sites should be expected in these situations. On the other hand, both the aforementioned and further studies (Russel et al. Citation2005; Lensu et al. Citation2011; Berg et al. Citation2013) underline the impact of management regimes on enhancing the suitability of these sites for both particular species and multi-species communities.
Our results revealed that the abundance of various flowering plants is a good indicator of habitat quality for insects at railway tracks. High nectar abundance turns out to be the most important factor in increasing the numbers of meadow butterflies along track verges (Saarinen et al. Citation2005). Consequently, we proved that artificial habitats have potential value if they have rich plant species communities. Additionally, in studies concerning high-speed railway tracks and power lines, the potential value of these linear landscape structures as dispersal corridors has been suggested (Lensu et al. Citation2011; Vandevelde et al. Citation2012). Our results appear to confirm that railway tracks play an important role for butterfly dispersion. We noted butterfly species from various biotopes as well as less mobile and highly mobile species such as Lycaena tityrus or Argynnis aglaja and Vanessa cardui or Pieris brassicae, respectively.
The greatest threat to butterflies inhabiting railway tracks is a lack of management that results in the overgrowing of track verges by shrubs, and consequently in the alteration of plant species communities. However, improper management, e.g. too-frequent mowing, is also a threat. Furthermore, all restoration work along railway tracks should be carried out with conservation aims in view, including the preservation or reconstruction of suitable plant species composition. Track verges should be mown with mowing schemes that are adapted to butterfly requirements. A single stretch of tracks and tracks verges should be mown every 2–3 years in order to increase the abundance of flowering plants, to prevent succession and to provide shelter sites with taller vegetation, as has been suggested (see Saarinen et al. Citation2005; Berg et al. Citation2013). Track verges of good quality, i.e. located on sun-warmed embankments rich in flowering plants, should be kept as wide as possible since the wide verges are inhabited by a greater number of butterflies than narrow ones are (Saarinen et al. Citation2005). The sowing of plant species is also a recommended conservation action for the improved conservation value of railway tracks for butterflies. Another threat for butterflies inhabiting railway tracks is road mortality (cf. Melis et al. Citation2010; Skórka et al. Citation2013). However, the traffic intensity on domestic railway tracks is lower than that on roads; therefore, this factor appears to have less importance. Finally, in order to preserve multi-species communities in fragmented landscapes, conservation managers should focus on enhancing the quality of railway tracks and their verges, because such habitats have potential value for butterflies, and their role in conservation schemes should not be neglected.
Supplemental data
Supplemental data for this article can be accessed here.
Supplementary Material
Download MS Word (14.1 KB)Acknowledgements
We express our gratitude to Agnieszka Król for her assistance in the fieldwork.
References
- Anderson MJ. 2006. Distance-based tests for homogeneity of multivariate dispersions. Biometrics 62:245–253. DOI: 10.1111/j.1541-0420.2005.00440.x.
- Anderson MJ, Crist TO, Chase JM, Vellend JM, Inouye BD, Freestone AL, Sanders NJ, Cornell HV, Comita LS, Davies KF, Harrison SP, Kraft NJB, Stegen JC, Swenson NG. 2011. Navigating the multiple meanings of β diversity: A roadmap for the practicing ecologist. Ecology Letters 14:19–28. DOI: 10.1111/j.1461-0248.2010.01552.x.
- Anderson MJ, Ellingsen KE, McArdle BH. 2006. Multivariate dispersion as a measure of beta diversity. Ecology Letters 9:683–693. DOI: 10.1111/ele.2006.9.issue-6.
- Andrén H. 1994. Effects of habitat fragmentation on birds and mammals in landscapes with different proportions of suitable habitat: A review. Oikos 71:355–366. DOI: 10.2307/3545823.
- Atmar W, Patterson BD 1993. The measure of order and disorder in the distribution of species in fragmented habitat. Oecologia 96:373–382. DOI: 10.1007/BF00317508.
- Atmar W, Patterson BD 1995. The nestedness temperature calculator: A visual basic program, including 294 presence–absence matrices. University Park: AICS Research.
- Bąkowski M, Filipiak A, Fric Z. 2010. The foraging behaviour of Lycaena dispar [Haworth, 1802] (Lepidoptera, Lycaenidae). Entomologica Fennica 21:49–57.
- Berg A, Karin Ahrne K, Öckinger E, Svensson R, Wissman J. 2013. Butterflies in semi-natural pastures and power-line corridors – effects of flower richness, management, and structural vegetation characteristics. Insect Conservation and Diversity 6:639–657. DOI: 10.1111/icad.12019.
- Dennis RLH. 2010. A resource-based habitat view for conservation: butterflies in the British landscape. Chichester, UK: Wiley-Blackwell.
- Driscoll DA. 2008. The frequency of metapopulations, metacommunities and nestedness in a fragmented landscape. Oikos 117:297–309. DOI: 10.1111/oik.2008.117.issue-2.
- Fahrig L. 2003. The effects of habitat fragmentation on biodiversity. Annual Review of Ecology Evolution, and Systematics 34:487–515. DOI: 10.1146/annurev.ecolsys.34.011802.132419.
- Fahrig L, Merriam G. 1994. Conservation of fragmented populations. Conservation Biology 8:50–59. DOI: 10.1046/j.1523-1739.1994.08010050.x.
- Fischer J, Lindenmayer DB. 2005. Nestedness in fragmented landscapes: A case study on birds, arboreal marsupials and lizards. Journal of Biogeography 32:1737–1750. DOI: 10.1111/jbi.2005.32.issue-10.
- Foley JA, De Fries R, Asner GP, Barford C, Bonan G, Carpenter SR, Chapin FS, Coe MT, Daily GC, Gibbs HK, Helkowski JH, Holloway T, Howard EA, Kucharik CJ, Monfreda C, Patz JA, Prentice IC, Ramankutty N, Snyder PK. 2005. Global consequences of land use. Science 309:570–574. DOI: 10.1126/science.1111772.
- Jadwiszczak P. 2009. Random Pro 314 Software for classical and computer-intensive statistics. Available: http://pjadwtripodcom. Accessed Apr 2014 5.
- Kalarus K, Skórka P, Nowicki P. 2013. Resource use in two contrasting habitat types raises different challenges for the conservation of the dryad butterfly Minois dryas. Journal of Insect Conservation 17:777–786. DOI: 10.1007/s10841-013-9560-1.
- Kindt R, Coe R. 2005. Tree diversity analysis A manual and software for common statistical methods for ecological and biodiversity studies. Nairobi: World Agroforestry Centre (ICRAF).
- Konvička M, Fric Z, Beneš J. 2006. Butterfly extinctions in European states: Do socioeconomic conditions matter more than physical geography?. Global Ecology & Biogeography 15:82–92. DOI: 10.1111/j.1466-822X.2006.00188.x.
- Konvička M, Kadlec T. 2011. How to increase the value of urban areas for butterfly conservation? A lesson from Prague nature reserves and parks. European Journal of Entomology 108:219–229. DOI: 10.14411/eje.2011.030.
- Leibold MA, Mikkelson GM. 2002. Coherence, species turnover, and boundary clumping: Elements of meta-community structure. Oikos 97:237–250. DOI: 10.1034/j.1600-0706.2002.970210.x.
- Lensu T, Komonen A, Hiltula O, Päivinen J, Saari V, Kotiaho JS. 2011. The role of power line rights-of-way as an alternative habitat for declined mire butterflies. Journal of Environmental Management 92:2539–2546. DOI: 10.1016/j.jenvman.2011.05.019.
- Melis C, Bjerk Olsen C, Hyllvang M, Gobbi M, Stokke BG, Røskaft E. 2010. The effect of traffic intensity on ground beetle (Coleoptera: Carabidae) assemblages in central Sweden. Journal of Insect Conservation 14:159–168. DOI: 10.1007/s10841-009-9240-3.
- Oksanen J, Blanchet FG, Kindt R, Legendre P, O’Hara RB, Simpson GL, Solymos P, Stevens MHH, Wagner H. 2013. Vegan: Community ecology package R package v 20-10. Available: http://CRANR-projectorg/package=vegan/. Accessed Apr 2014 5.
- Oliver T, Roy DB, Hill JK, Brereton T, Thomas CD 2010. Heterogeneous landscapes promote population stability. Ecology Letters 13:473–484. DOI: 10.1111/ele.2010.13.issue-4.
- Pollard E, Yates TJ. 1993. Monitoring butterflies for ecology and conservation. London: Chapman & Hall.
- Potts SG, Vulliamy B, Roberts S, O’Toole C, Dafni A, Ne’eman G, Willmer P. 2005. Role of nesting resources in organising diverse bee communities in a Mediterranean landscape. Ecological Entomology 30:78–85. DOI: 10.1111/j.0307-6946.2005.00662.x.
- R Core Team. 2013. R: A language and environment for statistical computing R foundation for statistical computing, Vienna, Austria. Available: http://wwwR-projectorg/. Accessed Apr 2014 5.
- Rangel TFLVB, Diniz-Filho AF, Bini LM. 2010. SAM: A comprehensive application for spatial analysis in macroecology. Ecography 33:46–50. DOI: 10.1111/j.1600-0587.2009.06299.x.
- Russel KN, Ikerd H, Droege S. 2005. The potential conservation value of unmowed powerline strips for native bees. Biological Conservation 124:133–148. DOI: 10.1016/j.biocon.2005.01.022.
- Saarinen K, Valtonen A, Jantunen J, Saarnio S. 2005. Butterflies and diurnal moths along road verges: Does road type affect diversity and abundance? Biological Conservation 123:403–412. DOI: 10.1016/j.biocon.2004.12.012.
- Schtickzelle N, Mennechez G, Baguette M. 2006. Dispersal depression with habitat fragmentation in the bog fritillary butterfly. Ecology 87:1057–1065. DOI: 10.1890/0012-9658(2006)87[1057:DDWHFI]2.0.CO;2.
- Settele J, Dover J, Dolek M, Konvicka M. 2009. Butterflies of European ecosystems: Impact of land use and options for conservation management. In: Settele J, Shreeve T, Konvicka A, Van Dyck H, editors. Ecology of butterflies in Europe. Cambridge: Cambridge University Press. pp. 353–370.
- Skórka P, Lenda M, Moroń D, Kalarus K, Tryjanowski P. 2013. Factors affecting road mortality and the suitability of road verges for butterflies. Biological Conservation 159:148–157. DOI: 10.1016/j.biocon.2012.12.028.
- Thomas JA, Telfer MG, Roy DB, Preston CD, Greenwood JJD, Asher J, Fox R, Clarke RT, Lawton JH. 2004. Comparative losses of British butterflies, birds, and plants and the global extinction crisis. Science 303:1879–1881. DOI: 10.1126/science.1095046.
- Tryjanowski P, Sparks TH, Jerzak L, Rosin ZM, Skórka P 2014. A paradox for conservation: Electricity pylons may benefit avian diversity in intensive farmland. Conservation Letters 7:34–40. DOI: 10.1111/conl.2014.7.issue-1.
- Van Dyck H, Van Strien AJ, Maes D, Van Swaay CAM. 2009. Declines in common, widespread butterflies in a landscape under intense human use. Conservation Biology 23:957–965. DOI: 10.1111/j.1523-1739.2009.01175.x.
- Van Swaay C, Collins S, Dušej G, Maes D, Munguira ML, Rakosy R, Ryrholm N, Šašić M, Settele J, Thomas J, Verovnik R, Verstrael T, Warren M, Wiemers M, Wynhoff I. 2012. Dos and don’ts for butterflies of the habitats directive of the European Union. Nature Conservation 1:73–153.
- Vandevelde J-C, Penone C, Julliard R. 2012. High-speed railways are not barriers to Pyronia tithonus butterfly movements. Journal of Insect Conservation 16:801–803. DOI: 10.1007/s10841-012-9513-0.
- Vellend M, Verheyen K, Flinn KM, Jacquemyn H, Kolb A, Van Calster H, Peterken G, Graae BJ, Bellemare J, Honnay O, Brunet J, Wulf M, Gerhadt F, Hermy M. 2007. Homogenization of forest plant communities and weakening of species-environment relationships via agricultural land use. Journal of Ecology 95:565–573. DOI: 10.1111/jec.2007.95.issue-3.
- WallisDeVries MF, Poschlod P, Willems JH. 2002. Challenges for the conservation of calcareous grasslands in northwestern Europe: Integrating the requirements of flora and fauna. Biological Conservation 104:265–273. DOI: 10.1016/S0006-3207(01)00191-4.
- Wynhoff I, Gestel R, Swaay C, Langevelde F. 2011. Not only the butterflies: Managing ants on road verges to benefit Phengaris (Maculinea) butterflies. Journal of Insect Conservation 15:189–206. DOI: 10.1007/s10841-010-9337-8.
- Yan Chong K, Teo S, Kurukulasuriya B, Fei Chung Y, Rajathurai S, Tan HTW. 2014. Not all green is as good: Different effects of the natural and cultivated components of urban vegetation on bird and butterfly diversity. Biological Conservation 171:299–309. DOI: 10.1016/j.biocon.2014.01.037.