
Abstract
We modelled the population biology of Oestrus sp. parasitising the Iberian ibex (Capra pyrenaica), using a system dynamics approach. Levels included in the model were as follows: first-instar larvae, third-instar larvae, pupae and resilient pupae. The values used for flows and auxiliary variables were obtained from the scientific literature, including research on both Oestrus ovis and O. sp.; we assumed that these two species are closely related, both morphologically and from a biological point of view. Simulations provided by our model allowed us to estimate the minimum monthly production of first-instar larvae and thus to establish periodic population dynamics, together with predictions for the number of larval generations. The model predicted 3–4 larval generations per year. The model proved to be very sensitive to minimal changes in a number of variables, especially the first-instar larval production rate. Despite its limitations, this methodology could be a versatile tool for studying the population dynamics of this kind of parasites, and for simulating the effects of control programmes.
Introduction
Oestrids (Diptera: Oestridae) are obligate parasites that remain for weeks or months in the naso-pharyngeal tract, frontal and horn sinuses (Oestrus spp.) (), stomach (Gasterophilus spp.), inner organs or subcutaneous tissues (Hypoderma spp.) of their respective hosts. They cause important economic loses in livestock in both developing and developed countries (Otranto & Stevens Citation2002), and under certain conditions can also infect humans (Anderson Citation2006b).
Figure 1. The life cycle of Oestrus sp.
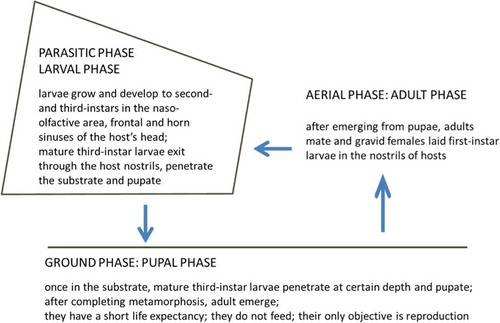
Beyond the mechanical damage caused by Oestrus ovis Linnaeus, 1758 larvae in host mucosae, other alterations may appear, including dilatations, degenerative changes and squamous metaplasia in nasal passages, as well as leukocyte infiltration – mainly eosinophils – or submucosal edema (Jagannath et al. Citation1989). Chronic sinusitis, probably due to secondary infections associated to these myasis, has often been reported in bighorn sheep (Ovis canadensis Shaw, 1804) and may affect host crania and even cause death (Allen & Bunch Citation1982).
Oestrus ovis parasitises livestock (mainly sheep) the world over and has also been reported in bighorn sheep, European mouflon (Ovis aries Linnaeus, 1758), argali (Ovis ammon (Linnaeus, 1758)), Alpine ibex (Capra ibex ibex Linnaeus, 1758), Asiatic ibex (Capra sibirica (Pallas, 1776)) and white-tailed deer (Odocoileus virginianus (Zimmermann, 1780)) (Grunin Citation1957; Capelle Citation1966; Wetzel & Bauristhene Citation1970; Moreno et al. Citation1999; Colwell et al. Citation2006). In Eurasia Oestrus caucasicus Grunin, 1948 is known to parasitise the Kuban tur (Capra caucasica Güldenstaedt and Pallas, 1783), the Asiatic ibex, and also was reported infesting the Iberian ibex (Capra pyrenaica Schinz, 1838) (Grunin Citation1957; Minar et al. Citation1985; Pérez et al. Citation1996). Recent molecular studies based on Cytochrome Oxidase I (COI) and 28S rDNA sequences confirmed that the species infesting Iberian ibex is other than O. ovis (Moreno et al. Citationin press). Nevertheless, since we have not yet obtained and genetically characterised larvae from Kuban tur, Daghestan tur (Capra cylindricornis (Blyth, 1841)) and Asiatic ibex, we cannot conclude that the species infesting Iberian ibex is O. caucasicus or, even, a new species. For this reason, hereafter, we call it Oestrus sp. Regarding morphological and biological features, this latter parasite species is very similar to O. ovis (Grunin Citation1957; Zumpt Citation1965; Colwell Citation2001; Guitton et al. Citation2001; Pérez et al. Citation2006).
Monitoring populations of these parasites when working on infected wild hosts is a difficult, time-consuming task. Several non-invasive methods are available for diagnosing oestrosis in wild hosts, such as Enzyme-Linked Immunosorbent Assay (ELISA) (Arias et al. Citation2014), pharyngeal endoscopy (Oksanen et al. Citation1992) or computed tomography (Fidalgo et al. Citation2015). Nevertheless, for epidemiological studies and a proper identification of the parasite species involved, larvae are usually obtained after necropsy (invasive method). In addition, pupae develop in the substrate at a certain depth and the behaviour of adult flies makes it extremely difficult to observe them in vivo, taking into account that the life cycle of the species involved in our study occurs in high mountain habitats. Therefore, our knowledge of the life cycle and demographic patterns of oestrids infesting wild hosts is scarce and fragmented, to the point that most of their demographic parameters are still unknown.
System dynamics (SD) modelling is a methodology used for simulating and analysing the behaviour of complex models (Aracil & Gordillo Citation1997). SD acts as an intermediate stage between reality and its mathematical representation and can be used to predict by means of simulations important temporal variations (Martín-García Citation2003). From a mathematical point of view, a SD model consists of a set of first-order ordinary differential equations. Under the circumstances described above, models or simulations may help to obtain a structured vision of the infestation process and its critical aspects, and provide possible approaches for managing these infections. Within this context, the basic goal of a model is to understand how the different variables involved keep the system in a balanced stationary state, and how the system will react if a variable is modified.
There are some antecedents in the literature regarding the modelling population dynamics of Diptera using data obtained experimentally, although most refer to the Calliphoridae and Muscidae families. Some of these studies have been focused on constructing life tables that allow important demographic parameters such as the net reproductive rate (R0), the generation time and the instantaneous growth rate to be derived, and to predict the future structure of the studied population (Chi & Liu Citation1985; Chi Citation1988, Citation1997; Gabre et al. Citation2005).
Given that insect developmental and survival rates are determined by environmental factors such as temperature, it is not surprising that most insect population models try to quantitatively extrapolate a rate of population increase using available climate data (Atzeni et al. Citation1994; Wall et al. Citation2000). However, it must be taken into account that these models usually include the calculation of degree-days under the assumption that above a minimum threshold (basal temperature) developmental rates are directly proportional to temperature, and that beyond this threshold development does not occur (Moon Citation1983; Preuss KP Citation1983).
Nevertheless, the control of the common green bottle fly, Lucilia sericata (Meigen, 1826), has been approached with the help of both deterministic (assuming no inter-individual variability) and stochastic models, which assume a certain degree of variability between individuals and cohorts (Wall et al. Citation1992, Citation1993a,b; French & Morgan Citation1996; Fenton & Wall Citation1997; Fenton et al. Citation1997, Citation1998a,b). Within the context of integrated insect-pest management, the monitoring of insect populations has also been performed by using mixed generalised lineal models (Candy Citation2000).
Little life cycle modelling has been carried out in oestrid research. In order to predict critical periods with the greatest numbers of attacks on hosts (larvipositions) and to design preventive and control strategies, the degree-days and the monitoring of the prevalence and intensity of oestrosis in sheep caused by O. ovis from Namibia have been used to address the question of development and/or survival of different parasite stages (adult, larva and pupa) (Biggs et al. Citation1998). On the other hand, recent work has reported a life table for an O. ovis population and predicted a rate of population growth of 1.25 per generation, under natural conditions (Cepeda-Palacios et al. Citation2011).
In our study, the life cycle of Oestrus sp. infesting Iberian ibex (Capra pyrenaica) is modelled using a SD approach. Given the similarity of this species to O. ovis, we integrated available information for both species from larvae (parasitic phase), pupae and adult flies (free-living phases). The goal of our study is to estimate the minimum number of first-instar larvae produced by gravid females which is needed to maintain stable (periodic) population dynamics, assuming high rates of larval and pupal mortality. This information, after being validated empirically, could become crucial within control programmes for this parasitosis.
Material and methods
Elements and structure of the system dynamics model
In SD, a flow diagram (or Forrester’s diagram) consists of three main elements: (i) levels, the state variables of the system with their respective values in each situation as the difference between input and output flows; (ii) flows, used to establish the relationship between the different levels; and (iii) auxiliary variables, which integrate information channels between levels and flows and help to define the flow variables, thereby making the model more manageable and easier to understand. Our model includes four levels: L1 (first-instar larvae), L3 (third-instar larvae), pupae and resilient pupae; eight flows: new L1, L1 death, from L1 to L3, L3 death, from L3 to pupae, pupae death, resilience and unmeeting; and 20 auxiliary variables: larviposition, L1 death rate, L1 number, delay 1, control cycle L1 to L3, delay control cycle L1 to L3, time L1 to L3, L3 death rate, L3 number, control cycle L3 to pupae, delay 2, delay control cycle L3 to pupae, time L3 to pupae, pupae number, pupae death rate, delay 3, resilient time, control cycle pupae to resilient pupae, unmeeting rate, and offspring potential. From these auxiliary variables, larviposition (that is, the rate at which gravid females laid first-instar larvae within the host nostrils) is one of the most important with regards to the population dynamics of this fly, taking into account the very short life expectancy of adults.
Values assigned to the relationships between levels and auxiliary variables of the model were obtained from the literature. Adult life expectancy was considered as the mean obtained for males and females: 0.31 ± 0.13 months (Pérez et al. Citation2006). The biotic potential for Oestrus sp. gravid females was considered to be the same as previously described for O. ovis (500 larvae), but, taking into account that only 30–50 larvae are laid in each larviposition (Cobbett & Mitchell Citation1941; Zumpt Citation1965), we included the auxiliary variable “Larviposition”, which was parameterised after making the model periodic. In addition, we have taken into account two larval instars (L1 and L3) in order to simplify the system. Assuming overall larval mortality of 90% (Rogers & Knapp Citation1973) and depending on climatic conditions (mainly temperature), the complete larval phase (L1–L3) lasts from 20 days to a number of months (Dorchies et al. Citation1999; Tabouret et al. Citation2001). Thus, even if it is included, the intermediate L2 instar does not become informative or significant to the model. In the model, we assumed a long larval period of 25 days (0.83 months): “Time L1 to L3”, which is also an auxiliary variable, as the arithmetic mean of the values obtained by Dorchies et al. (Citation1999) and Tabouret et al. (Citation2001). In addition, in vitro culture experiments showed that Oestrus sp. post-feeding third-instar larvae have a mortality rate of 10.6% and that they take 1.28 days (“Time L3 to Pupae”) on average to pupate, the pupal stage then lasting for 30 days (Pérez et al. Citation2006); all of these values were included in the model.
The emergence rate of adult flies reaches 43.6% (assuming a mortality rate of 56.4% during the pupal phase) with a sex ratio not differing significantly from 1:1 (Pérez et al. Citation2006). However, we assumed that 17.9% of adult flies emerged with vestigial wings and would probably not reproduce (Pérez et al. Citation2006). Because we have no information about the natural mortality of adults (e.g. by predation) nor regarding the success of mating and the rate of larviposition by gravid females (e.g. the success regarding different larviposition attempts), we have integrated the mortality rate of the pupal phase, the sex ratio, and the rate of vestigial adults into the level “resilient pupae”. The offspring potential reaches a value of 250 (since only about the 50% of adult flies are females).
In order to emulate the seasonal fluctuations in the life cycle, particularly those regarding the number of larvae belonging to each instar (Pérez et al. Citation1996), we have introduced different fixed delays in the model, just prior to passing to the next level, and three control cycles as well. These control cycles are defined as step functions and are also important auxiliary variables of the model.
The time unit used in this work was the month. The model of the life cycle for Oestrus sp. was developed with the software Vensim PLE 6.2 (Ventana Systems, Inc. Citation2003). In the first simulation, using an initial value of eight L1, 18 L3, 16 pupae and eight resilient pupae, we looked for the conditions that guaranteed the periodic behaviour of the population – that is, a rate of increase over time equal to or very near to zero (Caughley & Gunn Citation1996). These initial values are based on data on intensity of parasitation described by Pérez et al. (Citation1996). The time length for the simulation was 25 years, for which we used the Runge Kutta method for numerical integration, with a step of h = 0.015625.
Finaly, after estimating the value of larviposition which makes the model stable, we carried out a sensitivity analysis of the model based on 200 simulations using a random–uniform probability distribution for larviposition rate values between 0.25 and 12.5 larvae/gravid female/month.
Results
The general structure of the model implemented with Vensim PLE 6.2 is represented by the equations of the model () and depicted in .
Table I. Equations describing the model. L1: first-instar larvae; L3: third-instar larvae; INTEG: integral.
Figure 2. A Forrester’s diagram representing the elements of the model together with their relationships. L1: first-instar larvae; L3: third-instar larvae.
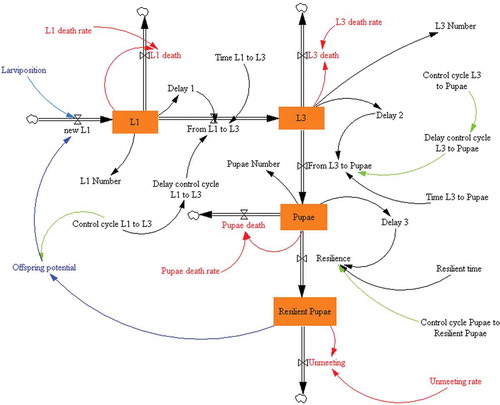
Each of the level variables represents a sector of the population and has an input flow (births) and two output flows (deaths); the velocities or rates at which these flows operate are density dependent. These rates are regulated by the control variable “delay control cycle L1 to L3” to pupae” for the period L3 pupa.
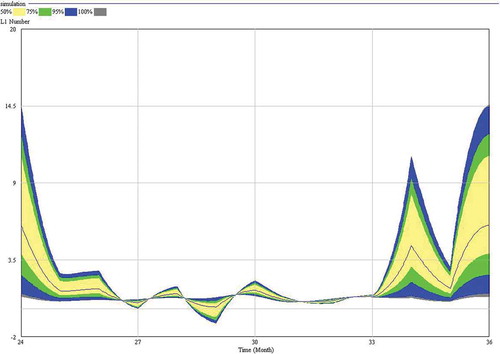
Starting from a given initial population as described below, we obtain a stable or stationary population (system) dynamics when the mean monthly rate reaches a value of five larvae per adult gravid female and month. Moreover, the model proved to be very sensitive to small changes in the value of different auxiliary variables, especially that for larviposition ().
Figure 3. The sensitivity of the model, obtained after 200 simulations (larviposition ranging from 0.25 to 12.5 larvae/gravid female/month) regarding L1 (first-instar larvae) numbers (y-axis). On the x-axis, 24 and 36 represent December, and 25 to 35 represent January to November, respectively.
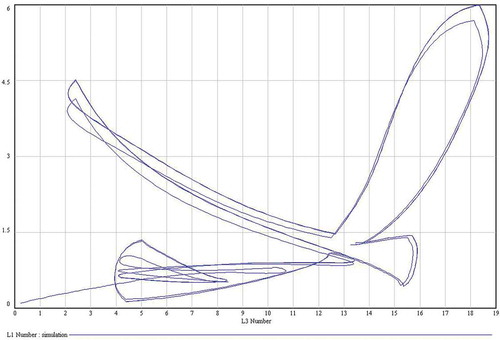
The model predicts 3–4 larval generations per year (–). In general, the values of both L1 and L3 predicted by the model are very similar to those described by Pérez et al. (Citation1996). The model has a cyclic behaviour and, then, the predicted dynamics of the population is periodic ().
Figure 4. Dynamics of L1 (first-instar larvae) numbers. In red (bottom legend), number of L1 observed (Pérez et al. Citation1996). In blue (upper legend), number of L1 predicted by the model. In the x-axis, 24 and 36 represent December, and 25 to 35 represent January to November, respectively.
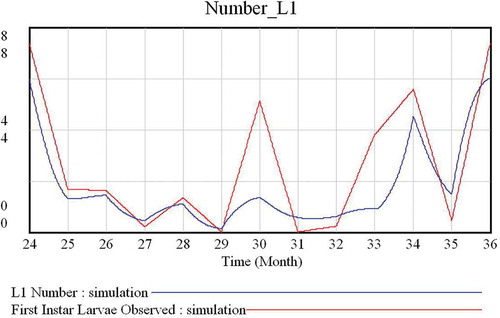
Figure 5. Dynamics of L3 (third-instar larvae) numbers. In red (bottom legend), number of L3 observed (Pérez et al. Citation1996). In blue (upper legend), number of L3 predicted by the model. In the x-axis, 24 and 36 represent December, and 25 to 35 represent January to November, respectively.
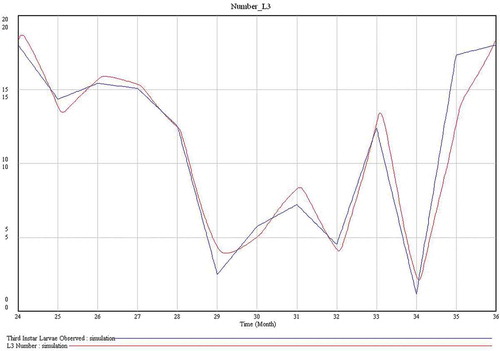
Figure 6. Limit cycle of the model. As the curve is closed, the long-term behaviour of the model is periodic. L1: first-instar larvae; L3: third-instar larvae.
Discussion
Monitoring oestrosis throughout the entire life cycle of these parasites would be extremely difficult. Thus, studies usually focus on larval-parasitic (epidemiology) or adult phases in the laboratory (after larval culture), or study adult biology in the field (Anderson Citation2006a). However, simulation gives us an opportunity to relate all the different phases of an oestrid’s life cycle in order to obtain predictive values under specific conditions or values for each parameter.
Matrix population models (Caswell Citation2001) have many applications in population dynamics. They basically operate with a matrix including the age population structure for each sex class and two parameters: one including the survival rate and the other the reproductive rate for each sex and age class. Nevertheless, in our case: (i) we don’t know the sex of the larvae; (ii) they do not participate in reproduction (therefore, the matrix would contain many zeros); and (iii) we don’t know the mating success, the reproductive rate or the survival rate of adult flies.
SD allows us to better understand the system under study and the way in which its different elements are related each other. Validation of models, when empirical data are available, can be achieved easily. SD permits obtaining the value of one of its variables or elements indirectly. Moreover, there is specific software available for working with SD.
The seasonal pattern of prevalence and intensity of parasitation by Oestrus sp. larvae in Iberian ibex from the southern Iberian Peninsula included three generations of first-instar larvae per year (May, July and October), followed by successive generations of L2 and L3 (Pérez et al. Citation1996). In this paper, the highest values of mean intensity of parasitisation were achieved during the months December–January, and this could explain the “presumable” fourth peak in L1 production observed in these months, since it is not probable that adults would be active in a high mountain habitat during this period. The prediction made by our model () agrees with results obtained by Pérez et al. (Citation1996).
On the other hand, under SD we cannot simulate levels that reach a value of zero, since this will cause the system to collapse. In real life in a high mountain habitat, we would not expect to find adult flies in the period between autumn and the following spring. During this period, the parasite population is maintained by larvae within their respective hosts and by pupae at a certain profundity in the substrate, both phases showing a certain degree of diapause. In the Ebro Valley (northeast Spain), Oestrus ovis adults were present and active between May and November, and a larval diapause from October to February was observed (Gracia et al. Citation2006). This is a subject that must be studied in greater detail.
Other important factors that are difficult to model because they are not fully understood are related to parasite embryonic development, its reproductive success (generally below its biotic potential; Colwell Citation2001), the behaviour of adult flies during reproduction, host seeking and larviposition related to the defensive behaviour of hosts (Anderson Citation2006a), the immune response of hosts (Arias et al. Citation2014), the influence of the programmes for treating and controlling oestrosis (Colwell et al. Citation2009), and even the number of hosts present in a given area. All of these factors will determine in each case the parasite carrying capacity and the density or abundance of adult flies in a given area. In other words, basic epidemiological variables such as prevalence and incidence (including reinfestations) also need to be included in models.
Therefore, we consider that this is only a first step towards predicting certain demographic values for parasites, which would otherwise be very difficult to obtain in the field or laboratory. Nevertheless, the results obtained in this work – e.g. the minimum larval production rate (five larvae per adult female and per month) required to maintain population periodicity – suggest interesting hypotheses that need to be tested experimentally. This kind of information could become essential for oestrosis control programmes.
Future research could be focused on each phase of the parasite’s cycle in order to discover how factors affecting both host and parasite – and internal and external to the system as a whole – operate and could generate more precise predictions. On the other hand, we should also consider the potential of stochastic models, which are more realistic but generate more uncertainty when predictions are made in the mid- or long term.
Aside from the host species involved, the geographical location and the respective climatological variables play an important role in the epidemiology of oestrosis. Other exogenous factors not taken into account in the model include the programmes developed for the treatment and control of these myiases in different parts of the world (Louw Citation1989; Pandey Citation1989).
Acknowledgements
The research activities of the authors are partially supported by the Junta de Andalucía: RNM118 research group. Comments by Dr. D. Colwell allowed us to greatly improve a preliminary version of our manuscript. The authors are also indebted to Michael Lockwood for his revision of the English style.
References
- Allen SD, Bunch TD. 1982. Cranial lesions attributable to chronic sinusitis in bighorn sheep. Journal of the American Veterinary Medicine Association 181:1418–1419.
- Anderson JR. 2006a. Adult biology. In: Colwell DD, Hall MJR, Scholl PJ, editors. The oestrid flies: Biology, host-parasite relationships, impact and management. Wallingford: CABI Publishing. pp. 141–166.
- Anderson JR. 2006b. Oestrid myiasis of humans. In: Colwell DD, Hall MJR, Scholl PJ, editors. The oestrid flies: Biology, host-parasite relationships, impact and management. Wallingford: CABI Publishing. pp. 201–209.
- Aracil J, Gordillo F. 1997. Dinámica de sistemas. Madrid: Alianza Universidad.
- Arias MS, Moreno V, Sarasa M, Paz-Silva A, Sánchez-Andrade R, Morrondo P, Díez-Baños P, Granados JE, Sánchez A, Pérez JM. 2014. Reliability of an ELISA test for diagnosing oestrosis in Iberian ibex. Journal of Parasitology 100:235–238. doi:10.1645/13-190.1
- Atzeni MG, Mayer DG, Spradbery JP, Anaman KA, Butler DG. 1994. Comparison of the predicted impact of a screwworm fly outbreak in Australia using a growth index model and a life-cycle model. Medical and Veterinary Entomology 8:281–291. doi:10.1111/j.1365-2915.1994.tb00510.x
- Biggs HC, McClain E, Muller GL, Anthonissen M, Hare KM. 1998. A prediction model for strike in the sheep nasal fly, Oestrus ovis, in Namibia. Preventive Veterinary Medicine 33:267–282. doi:10.1016/S0167-5877(97)00015-9
- Candy SG. 2000. The application of generalized linear mixed models to multi-level sampling for insect population monitoring. Environmental and Ecological Statistics 7:217–238. doi:10.1023/A:1009662915320
- Capelle KJ. 1966. The occurrence of Oestrus ovis L. (Diptera: Oestridae) in the bighorn sheep from Wyoming and Montana. The Journal of Parasitology 52:618–621. doi:10.2307/3276337
- Caswell H. 2001. Matrix population models: construction, analysis, and interpretation. Sunderland: Sinauer Associates, Inc.
- Caughley G, Gunn A. 1996. Conservation biology in theory and practice. Oxford: Blackwell Science.
- Cepeda-Palacios R, Angulo Valadez CE, Scholl JP, Ramírez-Orduña R, Jacquiet P, Dorchies P. 2011. Ecobiology of the sheep nose bot fly (Oestrus ovis L.): A review. Revue de Médecine Vétérinaire 162:503–507.
- Chi H. 1988. Life table analysis incorporating both sexes and variable development rates among individuals. Environmental Entomology 17:26–34. doi:10.1093/ee/17.1.26
- Chi H. 1997. Computer program for age-stage, two-sex life table analysis. Taichung, Taiwan: National Chung Hsin University. Available: http://140.120.197.173/ecology/. Accessed Mar 2015 10.
- Chi H, Liu H. 1985. Two new methods for the study of insect population ecology. Academia Sinica, Bulletin of the Institute of Zoology 24:225–240.
- Cobbett NG, Mitchell WC. 1941. Further observations on the life-cycle and incidence of the sheep bot, Oestrus ovis, in New Mexico and Texas. American Journal of Veterinary Research 2:358–379.
- Colwell DD. 2001. Bot flies and warble flies (Order Diptera: Family Oestridae). In: Samuel WM, Pybus MJ, Kocan AA, editors. Parasitic diseases of wild mammals. 2nd ed. London: Manson Publishing/The Veterinary Press. pp. 46–71.
- Colwell DD, Hall MJR, Scholl PJ. 2006. A synopsis of the biology, hosts, distribution, disease significance and management of the genera. In: Colwell DD, Hall MJR, Scholl PJ, editors. The oestrid flies: biology, host-parasite relationships, impact and management. Wallingford: CABI Publishing. pp. 220–305.
- Colwell DD, Otranto D, Stevens JR. 2009. Oestrid flies: Eradication and extinction versus biodiversity. Trends in Parasitology 25:500–504. doi:10.1016/j.pt.2009.07.011
- Dorchies P, Tabouret G, Duranton CH, Jacquiet PH. 1999. Relations hôte-parasite: I’exemple d’Oestrus ovis (Linné 1761) chez le mouton et la chèvre. Revue de Médecine Vétérinaire 150:511–516.
- Fenton A, Wall R. 1997. Sensitivity analysis of a stochastic model for the sheep blowfly Lucilia sericata. The Journal of Applied Ecology 34:1023–1031. doi:10.2307/2405291
- Fenton A, Wall R, French N. 1997. Sensitivity analysis of deterministic and stochastic simulation models of populations of the sheep blowfly, Lucilia sericata. Journal of Theoretical Biology 184:139–148. doi:10.1006/jtbi.1996.0255
- Fenton A, Wall R, French N. 1998a. The incidence of sheep strike by Lucilia sericata on sheep farms in Britain: A simulation model. Veterinary Parasitology 76:211–228. doi:10.1016/S0304-4017(97)00163-5
- Fenton A, Wall R, French N. 1998b. The effect of farm management strategies on the incidence of sheep strike in Britain: A simulation analysis. Veterinary Parasitology 79:341–357. doi:10.1016/S0304-4017(98)00174-5
- Fidalgo LE, López-Beceiro AM, Vila-Pastor M, Martínez-Carrasco C, Barreiro-Vázquez JD, Pérez JM. 2015. Use of computed tomography as a non-invasive method for diagnosing cephenemyiosis in roe deer (Capreolus capreolus). Medical and Veterinary Entomology 29:110–113. doi:10.1111/mve.12087
- French NP, Morgan KL. 1996. A model of ovine cutaneous myosis using the predicted abundance of Lucilia sericata and a pattern of sheep susceptibility. Preventive Veterinary Medicine 26:143–155. doi:10.1016/0167-5877(95)00528-5
- Gabre RM, Adham FK, Chi H. 2005. Life table of Chrysomya megacephala (Fabricius) (Diptera: Calliphoridae). Acta Oecologica, International Journal of Ecology 27:179–183. doi:10.1016/j.actao.2004.12.002
- Gracia MJ, Lucientes J, Peribáñez MA, Calvete C, Ferrer LM, Castillo JA. 2006. Kinetics of Oestrus ovis infection and activity of adult flies. Parasite 13:311–313. doi:10.1051/parasite/2006134311
- Grunin KY. 1957. Nasal Botflies (Oestridae). Fauna USSR. Vol. 19, nº 3. Insecta: Diptera. Moscow: USSR Academy of Sciences. [In Russian].
- Guitton C, Pérez JM, Dorchies P. 2001. Scanning electron microscopy of larval instars and imago of Oestrus caucasicus (Grunin, 1948) (Diptera: Oestridae). Parasite 8:155–160. doi:10.1051/parasite/2001082155
- Jagannath MS, Cozab N, Vijayasarathi SK. 1989. Histopathological changes in the nasal passages of sheep and goats infested with Oestrus ovis (Diptera: Oestridae). Indian Journal of Animal Science 59:87–91.
- Louw JP. 1989. Overberg research projects. VI. The biology and control of Oestrus ovis in sheep in the winter rainfall areas of the Southern Cape. Onderst. Journal of Veterinary Research 56:239–244.
- Martín-García J. 2003. Teoría y ejercicios prácticos de Dinámica de Sistemas. Barcelona, edited by the author.
- Minar J, Lobachev S, Kiefer M, Bazardorh D. 1985. New findings of warble flies (Hypodermatidae, Oestridae) of wild animals in Mongolia. Folia Parasitologica 32:89–91.
- Moon RD. 1983. Simulating developmental time of preadult face flies (Diptera: Muscidae) from air temperature records. Environmental Entomology 12:943–948. doi:10.1093/ee/12.3.943
- Moreno V, Pérez JM, Moreno PA, Granados JE, Ruiz-Martínez I, Soriguer RC, De Simón MA. 1999. Oestrid myiasis in European mouflon from Spain. Journal of Wildlife Diseases 35:78–81. doi:10.7589/0090-3558-35.1.78
- Moreno V, Romero-Fernández I, Marchal JA, Beltrán M, Granados JE, Habela MA, Tamadon A, Rakhshandehroo E, Sarasa M, Pérez JM, Sánchez A. in press. Molecular characterization of bot flies, Oestrus spp., (Diptera, Oestridae) from domestic and wild Bovidae hosts. Veterinary Parasitology Accepted for publication. doi:10.1016/j.vetpar.2015.08.002.
- Oksanen A, Soveri T, Nieminen M. 1992. Fibreoptic pharyngoscopy for diagnosing throat bots in the reindeer. Bulletin of the Scandinavian Society of Parasitology 2:30–32.
- Otranto D, Stevens JR. 2002. Molecular approaches to the study of myiasis causing larvae. International Journal for Parasitology 32:1345–1360. doi:10.1016/S0020-7519(02)00095-4
- Pandey VS. 1989. Epidemiology of Oestrus ovis infection of sheep in the Highveld of Zimbabwe. Veterinary Parasitology 31:275–280. doi:10.1016/0304-4017(89)90077-0
- Pérez JM, Granados JE, Moreno V, Calabuig G, Moço G, Serrano E. 2006. In vitro rearing Oestrus caucasicus third-instar larvae and pupae (Diptera: Oestridae) from naturally-infested Iberian ibex, Capra pyrenaica (Artiodactyla: Bovidae). Parasite 13:305–310. doi:10.1051/parasite/2006134305
- Pérez JM, Granados JE, Soriguer RC, Ruiz I. 1996. Prevalence and seasonality of Oestrus caucasicus Grunin, 1948 (Diptera: Oestridae) parasitizing the Spanish ibex, Capra pyrenaica (Mammalia: Artiodactyla). Journal of Parasitology 82:233–236. doi:10.2307/3284152
- Preuss KP. 1983. Day-degree methods for pest management. Environmental Entomology 12:613–619. doi:10.1093/ee/12.3.613.
- Rogers CE, Knapp FW. 1973. Bionomics of the sheep bot fly Oestrus ovis. Environmental Entomology 2:11–23. doi:10.1093/ee/2.1.11
- Tabouret G, Jacquiet P, Scholl P, Dorchies P. 2001. Oestrus ovis in sheep: Relative third-instar populations, risks of infection and parasitic control. Veterinary Research 32:525–531. doi:10.1051/vetres:2001144
- Ventana Systems, Inc. 2003. Vensim PLE32 Version 5.3. Harvard, Ventana Systems, Inc.
- Wall R, French NP, Fenton A. 2000. Sheep blowfly strike: A model approach. Research in Veterinary Science 69:1–9. doi:10.1053/rvsc.2000.0383
- Wall R, French NP, Morgan KL. 1992. Effects of temperature on the development and abundance of the sheep blowfly Lucilia sericata (Diptera: Calliphoridae). Bulletin of Entomological Research 82:125–131. doi:10.1017/S0007485300051531
- Wall R, French NP, Morgan KL. 1993a. Predicting the abundance of the blowfly Lucilia sericata (Diptera: Calliphoridae). Bulletin of Entomological Research 83:431–436. doi:10.1017/S0007485300029345
- Wall R, French NP, Morgan KL. 1993b. Sheep blowfly population control: Development of a simulation model and analysis of management strategies. The Journal of Applied Ecology 30:743–751. doi:10.2307/2404252
- Wetzel H, Bauristhene E. 1970. The identity of the third larval stage of Oestrus ovis Linnaeus (1758) (Diptera: Oestridae). Zoologischer Anzeiger 184:87–94.
- Zumpt F. 1965. Myiasis in man and animals in the old world. London: Butterworths.