
Abstract
Phylogenetic inference and molecular taxonomy are becoming increasingly important approaches to classical morphological systematics and marine ecology. The number of molecular markers suitable for such goals is quite high, but general use restricts the list to a few of them, mainly mitochondrial (namely cytochrome c oxidase subunit I, COI and Cytochrome b), especially in copepods. The ribosomal cistronic regions have been widely used for broad phylogenetic analyses in different taxa. Among them, the internal transcribed spacers (ITS rDNA) are powerful tools for phylogenetic reconstructions at the different taxonomic levels, although not yet extensively used for copepods. In the present work, we tested the suitability of ITS2 rDNA marker to reconstruct the phylogenetic relationships of calanoid copepods using sequences retrieved from GenBank, complementing the phylogenetic positions of the species studied with their morphological and ecological traits. Through ITS2 rDNA we provided the first molecular evidence for the invasive calanoid Pseudodiaptomus marinus from the Mediterranean Sea (Lake Faro, Sicily, Italy), and compared it with the GenBank ITS2 sequences for P. marinus from Korea and other calanoid species. The divergence of the sequences of our P. marinus from those of Korean specimens was quite prominent (4.4%) and allowed us to hypothesise either a new forma living in the Mediterranean or a cryptic species. This study highlights the appropriateness of ITS2 for phylogenetic reconstructions and species identification, as well as for barcoding, meta-barcoding and phylogeographic approaches, and evidences the need for a more thorough knowledge of ribosomal regions in copepods from different sites.
Introduction
The “insects of the sea”, as copepods are colloquially called (Huys & Boxshall Citation1991), are the most abundant metazoans on Earth (Hardy Citation1970; Wiebe et al. Citation1992), outnumbering insects, which outdo copepods only in species number (Schminke Citation2007). Recent estimates set the number of species at 14,710 (Walter & Boxshall Citation2016). They inhabit any aquatic environment, from deep-ocean trenches to mountain lakes (Huys & Boxshall Citation1991), and are a key component of the pelagic food web (Bradford-Grieve et al. Citation1999).
Owing to their ecological role, it is thus of paramount importance to properly identify copepod species and investigate their phylogenetic relationships. However, due to the abundance and extreme diversity of this class, and considering the possibility of a large number of cryptic species (Blanco-Bercial et al. Citation2014 and references therein), the morphological identification is often difficult to accomplish. Classical taxonomic identification analyses are now being increasingly supported by molecular techniques, providing an invaluable contribution to the exact assessment of species boundaries (e.g. Bucklin et al. Citation2010, Citation2011; Blanco-Bercial et al. Citation2014). To date, the integration of these two methods represents the most complete approach for taxonomical identification (Blanco-Bercial et al. Citation2014).
Copepod phylogeny and species identification have been proficiently carried out using molecular markers from mitochondria (partial mitochondrial cytochrome c oxidase subunit I, mtCOI; cytochrome b, Cyt b; 12S rRNA; 16S rRNA) and regions from the nuclear ribosomal cistron (18S rRNA; 28S rRNA) (for applications and reviews see e.g. Bucklin et al. Citation2010, Citation2011; Wyngaard et al. Citation2010, Citation2011; Figueroa Citation2011; Blanco-Bercial et al. Citation2011a,Citationb; Hirai et al. Citation2013; Zagoskin et al. Citation2014). Among them, mtCOI is currently considered a gold standard for metazoan barcoding (Hebert et al. Citation2003; Bucklin et al. Citation2011), even though some authors have pointed out potential technical limitations in its use (Hirai et al. Citation2013; Zagoskin et al. Citation2014). Valid alternatives to mtCOI are the internal transcribed spacers of the nuclear ribosomal DNA (ITS1/ITS2 rDNA) (Bucklin et al. Citation2011). These regions sit between the ribosomal genes, identified as 35S in plants and 45S in animals. 45S is composed of the 18S (the small subunit of the ribosome, SSU), the 5.8S and the 28S (large subunit, LSU) and is spaced by ITS1 (between 18S and 5.8S) and ITS2 (between 5.8S and 28S). The ribosomal cistrons are present in the genomes in multicopy, from thousands to tens of thousands (Naidoo et al. Citation2013), and can occur on different chromosomes (Heslop-Harrison & Schwarzacher Citation2011). Between each copy of 45S regions, intergenic regions are present (intergenic spacers, IGS). Each of the cistron components varies at a different pace and hence can be used for different purposes including phylogenetics, barcoding and population genetics. Being multicopy, the possibility of point mutations and/or insertions/deletions (indels) that would lead to sequence heterogeneity is very high. This phenomenon is balanced by concerted evolution, which tends to homogenise the different copies of the ribosomal cistron (Dover Citation1982; Rooney & Ward Citation2005; Eickbush & Eickbush Citation2007).
In this contribution, we focused on ITS2 sequences in copepods. Ribosomal regions have been successfully used for phylogenetic analyses over a wide range of taxonomical groups, including plants (e.g. Álvarez & Wendel Citation2003), insects (e.g. Wiemers et al. Citation2009), mammals (e.g. Coleman Citation2013) and algae (e.g. Orive et al. Citation2010), as well as copepods (Wyngaard et al. Citation2010; Figueroa Citation2011; Hirai et al. Citation2013; Zagoskin et al. Citation2014). ITS rDNA presents some advantages compared to mtCOI, namely: (i) it returns good results in the amplification process, even in the case of small DNA amounts, because of the high number of copies in the genomes (Naidoo et al. Citation2013); (ii) the ribosomes are present in every living organism; thus, extensive phylogenies can be produced with different portions of the ribosomal cistron (Baldauf Citation2008).
In the present contribution, we aim at further investigating the usefulness of the ITS2 marker as a reliable molecular tool for the reconstruction of phylogenetic relationships and the identification of copepod species. In particular, attention will be focused on the order Calanoida, the most effective colonisers of the pelagic environment (Bradford-Grieve Citation2002), comprising more than 1800 species in the marine environment (Mauchline Citation1998) and approximately 550 species in freshwater ecosystems (Boxshall & Defaye Citation2008). To achieve our goal, we used calanoid ITS2 sequences available in GenBank to infer phylogeny. The phylogenetic tree thus built was then compared with morphological and ecological descriptors of the species investigated in order to evaluate the agreement with molecular classification. In addition, we produced the first ITS2 rDNA sequence of the invasive calanoid Pseudodiaptomus marinus Sato, Citation1913 from the Mediterranean Sea (Lake Faro, Sicily, Italy; ), compared it with specimens from Korean waters, and studied its phylogenetic relationships with other Pseudodiaptomus species. Native to Japan (Sato, Citation1913), P. marinus started a global colonisation in the 1950s (Sabia et al. Citation2015), becoming the representative of the genus occupying the highest number of different areas in the world (Sabia et al. Citation2015). In this context, this species was found in Mediterranean waters in 2007 for the first time (Northern Adriatic Sea) (De Olazabal & Tirelli Citation2011), with rapidly increasing records in other sites in the western Mediterranean Sea, along the European Atlantic coasts, in the English Channel and in the southern North Sea (Lučić et al. Citation2015; Sabia et al. Citation2015). Our results validate the appropriateness of ITS2 rDNA as an informative tool for examining phylogenetic relationships in copepods, providing a valid alternative to other molecular markers, while the sequence for P. marinus represents a benchmark for future studies on the taxonomy, invasion ecology and phylogeography of this species in European waters and more generally in the worldwide ocean.
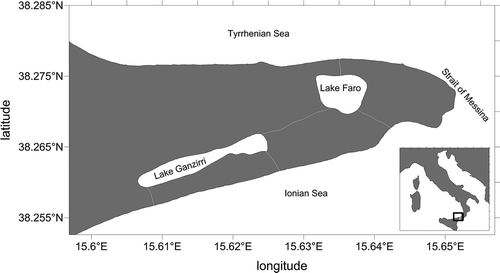
Figure 1. The sampling site of Lake Faro, at the northeastern tip of Sicily (Southern Italy). Coastline data: NOAA National Geophysical Data Center, coastline extracted: WLC (World Coast Line). Available: http://www.ngdc.noaa.gov/mgg/shorelines/shorelines.html. Accessed Jan 2016 08.
Materials and methods
ITS2 rDNA of Pseudodiaptomus marinus
Sample collection
Pseudodiaptomus marinus samples were collected during the day in July 2014 from Lake Faro (38.269°N, 15.637°E), a small pond located on the northeastern tip of Sicily (Italy; ). In this site, this species was first recorded in October 2008, soon thereafter becoming a stable component of the zooplankton assemblage (Pansera et al. Citation2014; Sabia et al. Citation2015). Specimens sorted in the laboratory were starved for 24–48 h, then preserved in 95% ethanol and transferred into fresh 95% ethanol after 24 h. Approximately 50 individuals were selected, most of them used for tuning the DNA extraction method and the amplification procedure.
DNA extraction
In order to reduce extraction costs, a CTAB-based protocol was used. At least 12 h before extraction, single animals were picked from the ethanol-preserved samples and left to air-dry overnight in a chemical hood. To each 2-mL Eppendorf tube containing a single animal, 500 µL of AppliChem CTAB extraction buffer (AppliChem, BioChemica, Illinois Tool Works Inc., Chicago, IL, USA, cat. no. A4150; composition: CTAB [cetyltrimethyl ammonium bromide] 20.00 g/L; EDTA-Na2 · 2H2O [ethylenediaminetetraacetic acid, disodium dihydrate] 20 mM; sodium chloride 1.4 M; Tris ultrapure 100 mM) and 400 mg of Sigma 212–300 µm acid-washed glass beads (Sigma–Aldrich s.r.l. Milan, Italy, cat. no. G1277) were added. In order to facilitate cell lysis, copepods were broken with a sterile glass pestle. Crushed animals were incubated at 65°C for 1 h and vortexed for 30 s every 10 min. Then were added 80 µg of Roche Proteinase K recombinant PCR Grade (Roche, 03115852001) in order to digest proteins. The animals were incubated at 58°C for 1 h, being vortexed every 20 min. One volume (500 µL) of SEVAG (chlorophorm:isoamilic alcohol 24:1 v/v) was added to the mix, gently mixed and incubated on ice for 15 min. The samples were then centrifuged at 14,000 rpm for 30 min at 4°C and the supernatant was transferred to a new 1.5-mL Eppendorf tube, to which 350 µL of 3 M ammonium acetate (NH4C2H3O2) and 0.5 volumes of isopropanol were added. The Eppendorf tube was gently mixed. The samples were placed at −80°C for 1 h to let the DNA precipitate and then centrifuged at 14,000 rpm for 30 min at 4°C. The supernatant was removed without disturbing the pellet, which was washed twice with 750 µL of 75% ice-cold ethanol. The pellet was left to air-dry and resuspended in 20 µL of MilliQ water.
PCR amplification and sequencing
As template for polymerase chain reaction (PCR), 0.5–2 ng gDNA were used. The reaction mix was prepared as follows: 1/10 of Roche PCR Buffer with MgCl2; 0.03U Taq polymerase; 1 pM of each primer; 200 µM dNTPs. Primer pairs used for amplification and sequencing were ITS1 and ITS4 by White et al. (Citation1990). Forty PCR cycles included a first denaturation step at 95°C for 30 s, an annealing step at 45°C for 30 s and an elongation step at 72°C for 30 s. An initial denaturation at 95°C for 3 min and a final elongation at 72°C for 5 min preceded and followed cycle repetitions. Amplicons were electrophoretically separated on 0.8% w/v agarose/TBE buffer gel with 40 ppm v/v ethidium bromide and visualised using an ultraviolet (UV) transilluminator. Bands were extracted using a Qiagen QIAquick gel extraction kit (Qiagen, Germany, cat. no. 28706) following the manufacturer’s instructions, and eluted in 20 µL of sterile MilliQ water. Sequence reactions were obtained with the BigDye Terminator Cycle Sequencing technology (Applied Biosystems, Foster City, CA, USA), purified in automation using the Agencourt CleanSEQ Dye terminator removal kit (Agencourt Bioscience Corporation, 500 Cummins Center, Suite 2450, Beverly MA 01915, USA) and a robotic station Biomek FX (Beckman Coulter, Fullerton, CA, USA). Products were analysed on an Automated Capillary Electrophoresis Sequencer 3730 DNA Analyzer (Applied Biosystems). Sequences from three different animals were obtained; since they all were identical, only one of them was sent to GenBank (KT808252) and used in the phylogenetic reconstructions (Supplementary Table I).
ITS2 rDNA phylogenetic analyses
Phylogenetic inference was run on a selection of calanoid copepod ITS2 rDNA sequences retrieved from GenBank (Supplementary Table I). All of the sequences were first automatically aligned by ClustalW (Thompson et al. Citation1994) in BioEdit 7.2.5 (Hall Citation1999) and M-Coffee software (Moretti et al. Citation2007), and then the alignment was manually refined. Phylogenetic reconstructions were run in the MEGA7 (Tamura et al. Citation2013) computer program. In order to define a reduced data set to work on, distance neighbour joining (NJ; Saitou & Nei Citation1987) phylogenetic reconstructions (verified with 10,000 bootstrap replications) were carried out with different data sets. The first NJ tree was constructed using 190 calanoid ITS rDNA sequences retrieved from GenBank (Supplementary Table I). Maximum likelihood (ML; Whelan & Goldman Citation2001) analyses were run on a reduced data set (). In order to define the best substitution model, a model test for best fit (Posada & Crandall Citation2001) implemented in MEGA7 was run among the 24 substitution models implemented. The Kimura-2-parameter (K2P; Kimura Citation1980) model was considered the best describing the substitution pattern in the data set, being characterised by the lowest Bayesian information criterion (BIC) score (Schwarz Citation1978) and corrected Akaike information criterion value (AICc; Akaike Citation1974; Hurvich & Tsai Citation1989). Initial trees for the heuristic search were obtained automatically by applying NJ and BioNJ algorithms (Gascuel Citation1997) to a matrix of pairwise distances estimated using the maximum composite likelihood (MCL) approach, and then selecting the topology with superior log likelihood value. A discrete Gamma distribution was used to model evolutionary rate differences among sites (five categories; +G). The analyses were tested by running 10,000 bootstrap replications. The trees thus obtained were edited using the tree edit tool in MEGA7.
Table I. List of the sequences used for final phylogenetic analyses. The sequence from Pseudodiaptomus marinus sampled in Lake Faro (Sicily, Italy), subject of the present work, is indicated in bold.
Bayesian analysis was performed using MrBayes 3.1.2 (Ronquist & Huelsenbeck Citation2003). Two parallel and completely independent Markov chain Monte Carlo (MCMC) runs were carried out on data matrices. Three hot chains (temperature 0.10) and one cold chain drove the analyses. The number of generations was set at 10 million, and the sampling frequency was set at 100 generations. The first 25% of the samples from the cold chain were discarded (command “burnin”). Consensus trees, with posterior probability of each node and branch lengths, are reported here after a 50% majority-rule consensus phylogeny. Phylogenetic trees were visualised and edited in the TreeView computer program (Page Citation1996).
A hierarchical cluster analysis was performed in R (R Core Team Citation2013) with sequence identity matrix obtained in MEGA7 (Supplementary Table II) and a heatmap was produced in R using the package pheatmap: Pretty Heatmaps, R package version 1.0.8 (Raivo Kolde Citation2015).
Phylogenetic networks were produced on two subsets (Diaptomoidea and Eucalanoidea superfamilies separately) using SplitsTree4 (Huson & Bryant Citation2006) computer program using NeighborNet and K2P model. Were performed 10,000 bootstrap replications in order to strengthen the analyses. Q-residual, delta scores (Holland et al. Citation2002) and ΦW (Bruen et al. Citation2006) values were estimated using the algorithms implemented in SplitsTree4.
Alignments were converted to the Roehl format using DnaSP (Librado & Rozas Citation2009), and median-joining haplotype networks (Bandelt et al. Citation1999) were constructed using Network 4.1 (available online at http://www.fluxus-engineering.com/) and converted into enhanced metafiles (.emf), imported into Microsoft PowerPoint to add colours and connections between haplotypes.
Results and discussion
ITS2 rDNA phylogeny
The ITS2 rDNA-based phylogeny () presented two well-supported clades grouping the two calanoid superfamilies (Diaptomoidea and Eucalanoidea) used in the present work. The end clades grouping different genera found in ML were all corroborated by Bayesian analysis (). Two differences only were recorded between ML and Bayesian analyses:
The sisterhood of Pseudodiaptomus marinus with Pseudodiaptomus nihonkainesis Hirakawa, 1983: in ML the latter showed a basal position to the clade grouping all the other Pseudodiaptomus species with no statistical support;
The clade grouping Subeucalanus spp. shows different basal structures.
Figure 2. Phylogenetic reconstruction based on ITS2 sequences. The tree topology showed is the result of Bayesian analysis, corroborated by maximum likelihood (ML) topology (see Results and Discussion section). In the nodes, bootstrap values of the ML analysis and the posterior probability are represented by a symbol. Vertical bars indicate: superfamily (S), female antennule segmentation (A), family (F), genus (G), female urosome segmentation (U), biological traits and geographic distributions.
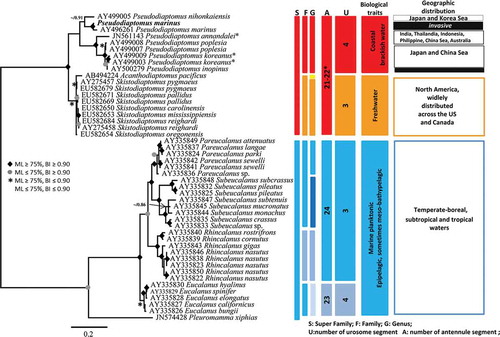
The Subeucalanus subcrassus/pileatus (Giesbrecht 1888) clade kept well-supported sisterhood with the other species in both analyses. However, while Bayesian analysis showed two well-supported subclades, respectively, grouping Subeucalanus subtenuis/mucronatus/monachus and Subeucalanus crassus (Giesbrecht 1888), in ML these species produced a less-structured phylogeny.
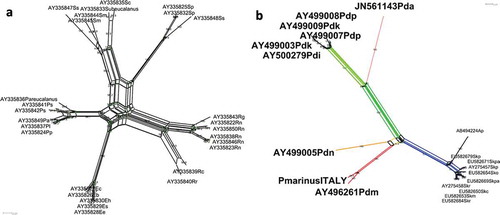
In the following, attention will be focused on the analysis of the Bayesian tree. The eight genera selected for the analysis all clustered in separate, coherent, variably supported clades. The basal nodes were all well supported with posterior probabilities above 0.90. Eucalanus spp. and Pareucalanus spp. (family Eucalanidae) clustered separately with high statistical support. Moreover, the network phylogeny clearly showed that Subeucalanus pileatus and S. subcrassus () cluster separately from the other Subeucalanus species. These findings call for either a revision of the family with the erection of a separate family for Pareucalanus spp., or a more profound taxonomic and phylogenetic effort reconsidering the family assignment of calanoid copepods as a whole. These issues, however, are beyond the aims of the present contribution.
Figure 3. Network phylogenies based on ITS2 rDNA sequences of (a) Eucalanoidae and (b) Diaptomidae calanoid copepod superfamilies. Bootstrap support is reported above each split. (a) Species abbreviations Ps = Pareucalanus sewelli; Pp = P. parki; Pl = P. langae; Pa = P. attenuatus; Eh = Eucalanush yalinus; Es = E. spinifer; Ee = E. elongatus; Eb = E. bungii; Ec = E. californicus; Rn = Rhincalanus nasutus; Rg = R. gigas; Rr = R. rostrifrons; Rc = R. cornutus; Sm = Subeucalanus monachus; Smu = S. mucronatus; Sc = S. crassus; Ssu = S. subcrassus; Sp = S. pileatus. The network split decomposition fit statistic was 98.2%. Delta score = 0.1723; Q-residual score = 9.1 × 10⁻³ (delta scores and Q-residuals for each sequence are listed in Supplementary Table III). (b) Spyg = Skistodiaptomus pygmeus; Sko = S. oregonensis; Skp = S. pallidus; Skc = S. carolinensis; Skm = S. mississippiensis; Skr = S. reighardi; Ap = Acanthodiaptomus pacificus; Pdm = Pseudodiaptomus marinus; Pdn = P. nihonkaiensis; Pdp = P. polpesia; Pdi = P. inopinus; Pdk = P. koreanus; Pda = P. annandalei. The network split decomposition fit statistic was 98.8%. Delta score = 0.1527; Q-residual score = 2.2 × 10⁻³ (delta scores and Q-residuals for each sequence are listed in Supplementary Table III).
Several authors (Bucklin et al. Citation2011; Blanco-Bercial et al. Citation2014; Wu et al. Citation2015) warned about the potential occurrence of artefacts or errors in online databases, due to a variety of sources including species misidentification and poor DNA quality control. In our analyses, we evidenced the ambiguous grouping of two GenBank sequences. Eucalanus hyalinus Claus, 1866 (AY874282) and Eucalanus spinifer Scott, 1894 (AY874281) were removed from the analyses because they grouped in a separate, robustly supported clade with Pleuromamma xiphias Giesbrecht, 1889 and not together with other Eucalanus spp. (not shown). One possible explanation would be that the species were misrecognised or that mosaic evolution of the ITS2 rDNA acted on this group. Further controls on these sequences are advocated for a more appropriate identification of the species.
The phylogeny presented here () reflects the morphological and evolutionary history of the analysed species, in line with previous works supporting coherence between morphological and molecular descriptions (e.g. Goetze Citation2003; Wyngaard et al. Citation2010; Hirai et al. Citation2013). All of the species belonging to superfamily Eucalanoidea robustly clustered together (ML 90%, BI 1.00) and the four major clades were represented by the most important genera. All of these Eucalanidae species presented the same morphological characters of antennulae longer than body, with 23–24 segments in females (Boxshall & Halsey Citation2004). The 19 species reported in our tree clustered into four clades, grouping the four main genera Subeucalanus (ML 75%, BI 1.00), Pareucalanus (ML 88%, BI 1.00), Eucalanus (ML 75%, BI 0.77) and Rinchalanus (ML 94% BI 0.98). For the latter genus, our phylogenetic tree revealed the relationship among the Rinchalanus species and the other Eucalanidae genera, with good Bayesian support. This genus was accommodated in a separate subfamily Rinchalanidae by Geletin (Citation1976). However, this proposal was not adopted by other authors (e.g. Brodsky et al. Citation1983) because the differences between Rhincalanus and other eucalanids were based on morphological details (mandibular morphology, segmentation and setation of swimming legs) that were very closely related to those in the rest of the Eucalanidae species. Nevertheless, this is still an open issue because other authors (Bradford-Grieve Citation1994; Boxshall & Halsey Citation2004) consider Rhincalanidae a true family. Moreover, all eucalanids reported in the phylogenetic tree are primary consumers in the epipelagic and mesopelagic plankton communities in both oceanic and neritic water. ITS2 phylogeny identified morphological species very well but highlighted also the presence of cryptic diversity within some morphospecies like Rhincalanus nasutus Giesbrecht, 1888, Pareucalanus sewelli Fleminger, 1973 and S. pileatus which, in our phylogeny, clustered in separate clades as also reported by Goetze (Citation2003).
ITS2 rDNA phylogeny and haplotypic analyses
The superfamily Diaptomoidea was represented in our phylogenetic tree by two different families, Diaptomidae and Pseudodiaptomidae (), clustering into two robustly separated clades (ML 99%, BI 1.00). The former, grouping Achantodiaptomus and Skistodiaptomus, was represented by freshwater species, while the Pseudodiaptomidae group was represented by littoral and brackish species.
ITS2 rDNA sequences from Pseudodiaptoms species proved not to be extremely divergent (). Pseudodiaptomus spp. clustered in two well-supported Bayesian clades. Pseudodiaptomus koreanus Soh et al., Citation2012, Pseudodiaptomus inopinus Burckhardt, 1913, Pseudodiaptomus poplesia Shen, 1955 and Pseudodiaptomus annandalei Sewell, 1919 grouped in a separate clade (ML 78%, BI 0.97) with respect to P. marinus and P. nihonkaiensis (BI: 0.91). Following the classification by Walter et al. (Citation2006), three of these species (P. inopinus, P. poplesia and P. annandalei) belong to the Lobus group (forbesi subgroup). Our results corroborate the clustering of P. inopinus and P. poplesia in the same clade discussed in Eyun et al. (Citation2007). P. koreanus has been identified as new species only recently (Soh et al. Citation2012), previously having been identified as Pseudodiaptomus sp. clustering with P. inopinus and P. poplesia (Eyun et al. Citation2007). To date, the species has not yet been officially assigned to any of the groups listed in Walter et al. (Citation2006), but the phylogenetic tree built in the present contribution strongly supports an inclusion in the Lobus group.
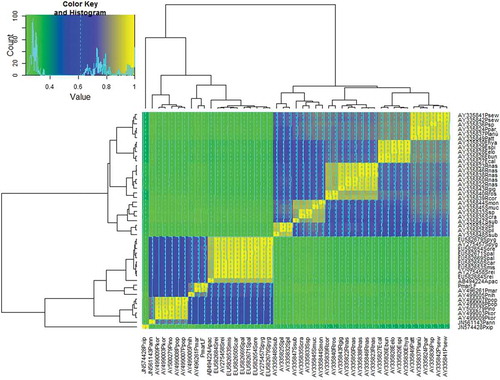
Figure 4. Heatmap produced on identity matrix of ITS2 rDNA alignment (Supplementary Table II). Cladograms were produced with the hierarchical clustering algorithm. Species abbreviations: Psew = Pareucalanus sewelli; Ppar = P. parki; Plan = P. langae; Patt = P. attenuatus; Ehya = Eucalanus hyalinus; Espi = E. spinifer; Eelo = E. elongatus; Ebun = E. bungii; Ecal = E. californicus; Rnas = Rhincalanus nasutus; Rgig = R. gigas; Rros = R. rostrifrons; Rcor = R. cornutus; Smon = Subeucalanus monachus; Smuc = S. mucronatus; Scra = S. crassus; Ssub = S. subcrassus; Spil = S. pileatus; Spyg = Skistodiaptomus pygmeus; Sore = S. oregonensis; Spal = S. pallidus; Scar = S. carolinensis; Smis = S. mississippiensis; Srei = S. reighardi; Apac = Acanthodiaptomus pacificus; Pmar = Pseudodiaptomus marinus; Pnih = P. nihonkaiensis; Ppol = P. polpesia; Pino = P. inopinus; Pkor = P. koreanus; Pann = P. annandalei; Pxip = Pleuromamma xiphias. LF = Lake Faro.
P. marinus and P. nihonkaiensis both belong to the Ramosus group, although the subgroups are different (hickmani for P. marinus; serricaudatus for P. nihonkaiensis) (Walter et al. Citation2006). Our clustering of the Ramosus species is in full agreement with the results by Eyun et al. (Citation2007).
These two clades grouped species from coastal/brackish environments, with similar morphological features (). This clustering was thus in agreement with the definition of morphologically and zoogeographically consistent groups.
From network phylogeny () P. marinus and P. nihonkaiensis proved to be more isolated (sensu Bandelt & Dress Citation1992) with respect to the other Pseudodiaptomus species. This finding, although biased by the paucity of publicly available sequences, can reflect the confirmed invasive ability of at least P. marinus. Interestingly, the freshwater species (family Diaptomidae) presented shorter branches than the Pseudodiaptomidae family, possibly revealing a lower level of divergence ().
As demonstrated by Soh et al. (Citation2012) in the description of P. koreanus, ITS1 divergence between very closely related species was quite high. P. inopinus and P. koreanus differed by 12.3–13.2% at ITS1 (Soh et al. Citation2012), while in our analyses on ITS2 this distance was reduced to 1.2–2.5%. Based on this evidence, we can conclude that in Pseudodiaptomus species – as in other organisms – ITS1 is more variable than ITS2, implying different uses of these regions, e.g. ITS1 for inter-population surveys and ITS2 for cryptic or pseudo-cryptic species discrimination.
A haplotypic network was also used in order to visualise the diversity and phylogenetic relationships among the different haplotypes of Pseudodiaptomus taxa. As shown in Supplementary Figure 1, all haplotypes in the analysis were singletons with no sharing of haplotypes between P. marinus populations. The analysis showed a complex pattern of gene flow among Pseudodiaptomus species, thus confirming the hypothesis of the presence of species complexes.
A recent work of Albaina et al. (Citation2016) generated the first 18S V9 reference sequences for P. marinus in European Seas, but at present, to the very best of our knowledge, molecular ITS data for this species are available only for specimens from the Asian region (mtCOI – Eyun et al. Citation2007; ITS2 – GenBank reference sequence: AY496261), despite the invasive trait of the species. The specimens sampled in Lake Faro were previously identified as P. marinus (Pansera et al. Citation2014; Sabia et al. Citation2014, Citation2015) based uniquely on morphological evidence.
Our results show that P. marinus from Lake Faro and from Korea differed by 4.4% at ITS2. Hirai et al. (Citation2013) investigated ITS2 divergence in a number of copepod families, and a low level of intraspecific variability counterparted by a certain interspecific divergence was scored. In addition, a comparison between intraspecific populations of Cyclops insignis Claus, 1857 from distant localities in Russia revealed an ITS1–ITS2 divergence of 0.6% (Zagoskin et al. Citation2014). The 4.4% difference scored in our analyses and the haplotype analysis thus suggest the presence of different morphs, with the possibility of identifying a new forma inhabiting Lake Faro, or calling for the description of a different cryptic species. This issue, however, necessitates specifically conceived analyses, integrating molecular taxonomy with detailed morphological investigations. The phylogenetic analyses presented here were performed with a region considered to be able to distinguish copepod species (e.g. Hirai et al. Citation2013) and, even if only one marker was used, the lower number of calanoid families involved in the present work allowed us to have robust nodes. For this reason, we are confident that our phylogeny may provide the basis for further investigation of P. marinus.
One consideration has to be included about our P. marinus ITS2 sequence from Lake Faro. As discussed above, ITS2 is present in multicopy (Naidoo et al. Citation2013) and can accumulate mutations. Although these are balanced by concerted evolution (Dover Citation1982; Rooney & Ward Citation2005; Eickbush & Eickbush Citation2007), a certain level of heterogeneity can be present with different isoforms (ribotypes) coexisting in the same genome. In our Sanger sequencing outcomes (pherograms), we found no signs of intragenomic variability at the ITS2 region (neither double peaks nor ambiguous reads). It has been demonstrated that rDNA intragenomic heterogeneity is a species-specific feature in the plant genus Nicotiana (Matyášek et al. Citation2012). Four species have been investigated (N. tomentosiformis, N. sylvestris, N. otophora and N. kawakamii) with three different sequencing methods (454, illumina and Sanger). All of the species investigated presented multiple ribotypes for ITS1, with one prominent over the others. In N. tomentosiformis, though, the prominent ribotype accounted for around 95% of the whole sequence, while for the other species two or three ribotypes accounted for up to about 99%, revealing higher heterogeneity. This result was validated also by cloning PCR products and Sanger sequencing 20 clones. The percentage of predominant vs. minority ribotypes was comparable in the cloning and in next-generation sequencing approaches. This finding corroborates our hypothesis that, if a strong heterogeneity was present in our rDNA sequences, then we would have detected it in pherograms. Moreover, Matyášek et al. (Citation2012) have demonstrated that multiple ribotypes are in any case species specific, i.e. in no cases did two different species share a ribotype. This is in line with the possibility of using ITS2 as species identifier, as demonstrated for 18S rDNA in copepods (Wu et al. Citation2015).
A possible parallel approach would be to integrate ITS1 and/or ITS2 transcript secondary structure to sequence alignments as done in other organisms such as insects, spiders and diatoms (e.g. Gómez-Zurita et al. Citation2000; Amato et al. Citation2007; Wiemers et al. Citation2009; Agnarsson Citation2010; Di Capua et al. Citationunder review).
Conclusions
Genomic tools are fundamental to address questions from individual to ecosystem levels, including biological invasions, speciation and parasitism (Bron et al. Citation2011). Increasingly, this is being achieved by barcoding. It is essential to link data of invasive species with integrative morphological and molecular taxonomic analyses. Over the last few years, the marker used for species identifications and inferring animal species boundaries was a portion of the mitochondrial cytochrome c oxidase subunit I (COI) gene (Hebert et al. Citation2003). The DNA barcoding mainly serves specimen classification and facilitates the identification of cryptic and pseudo-cryptic species. This latter task can be either very complex or strictly impossible if only relying on morphology. Among Crustacea, particularly for Multicrustacea, barcoding allowed species identification and only a few studies made use of DNA barcodes for phylogenetic reconstructions (Raupach & Redulovici Citation2015).
Focused on the genus Pseudodiaptomus, the present contribution supports the usefulness of ITS2 rDNA through a dual approach: on the one side, it provides an additional confirmation of the robustness of molecular analyses in inferring phylogenetic relationships; on the other hand, it fosters the applicability of ITS2 rDNA to species identification, and hence eventually the use of a portion of this region as barcode. Pseudodiaptomus is a perfect example of such a “knowledge gap”: it is composed by more than 80 species (Sabia et al. Citation2015), several among them considered highly invasive (e.g. Cordell et al. Citation2007; Bollens et al. Citation2012), but ITS2 data are available only for six species from the same region (Eyun et al. Citation2007).
The phylogenetic tree reconstructed in the present work using ITS2 rDNA sequences perfectly matched with the biological and ecological traits of the species analysed, elucidating the relationships among species. This result is in line with those discussed in Wyngaard et al. (Citation2010) for cyclopoids, supporting the use of ITS2 rDNA for investigations at species and population levels.
This work also provides the first ITS2 sequence of Pseudodiaptomus marinus from the Mediterranean Sea. The high interindividual variability in the morphological and behavioural features of P. marinus (Sabia et al. Citation2014, Citation2015), together with the resistance to toxicant stress (Tlili et al. Citation2015) and the plausible occurrence of different morphs or a species complex (present study), might all be successful elements supporting the great invasion capabilities of this calanoid copepod. Our results thus lay the foundations for future studies on the population genetics, phylogeography and connectivity of this invasive species.
fig_Supplementary_1_corrected.tif
Download TIFF Image (412 KB)Acknowledgements
The work of LS and MU was supported by the MOKA project (Modelling and Observation of zooplanKtonic orgAnisms) financed by the Italian Ministry of Education, University and Research (ID: RBFR10VF6M to MU). AA was funded by the European Union under FP7-People – GA no. 600407. This work has been partially funded by the Flagship Project RITMARE – The Italian Research for the Sea – coordinated by the Italian National Research Council and funded by the Italian Ministry of Education, University and Research within the National Research Program 2011-2013 (AA and IP).
The authors wish to thank all members of Animal Biology and Marine Ecology Laboratory in Messina for hosting LS in Laboratory and helping in the samplings. We are grateful to M. Montresor and W. H. C. F. Kooistra (Integrative Marine Ecology department of the SZN) for hosting LS in the molecular laboratory of the department. L. Caputi (IME SZN) is thanked for heatmap production. The authors gratefully acknowledge D. Fontaneto, A. Splendiani and two anonymous reviewers for constructive criticism on a previous version of the manuscript.
Supplemental material
Supplemental data for this article can be accessed here.
Additional information
Funding
Related Research Data
References
- Agnarsson I. 2010. The utility of ITS2 in spider phylogenetics: Notes on prior work and an example from Anelosimus. Journal of Arachnology 38:377–382. doi:10.1636/b10-01.1
- Akaike H. 1974. A new look at the statistical model identification. IEEE Transaction on Control System Technology 19:716–723.
- Albaina AA, Aguirrel M, Laza-Martinez A, Uriarte I, Iriarte A, Villate F, Estonba A. 2016. Is metabarcoding suitable for estuarine plankton monitoring? A comparative study with microscopy. Marine Biology 163:149. doi:10.1007/s00227-016-2920-0
- Álvarez I, Wendel JF. 2003. Ribosomal ITS sequences and plant phylogenetic inference. Molecular Phylogenetics and Evolution 29:417–434. doi:10.1016/s1055-7903(03)00208-2
- Amato A, Kooistra WHCF, Levialdi Ghiron JH, Mann DG, Pröschold T, Montresor M. 2007. Reproductive isolation among sympatric cryptic species in marine diatoms. Protist 158:193–207. doi:10.1016/j.protis.2006.10.001
- Baldauf SL. 2008. An overview of the phylogeny and diversity of eukaryotes. Journal of Systematics and Evolution 46:263–273. doi:10.3724/SP.J.1002.2008.08060
- Bandelt H-J, Dress AWM. 1992. Split decomposition: A new and useful approach to phylogenetic analysis of distance data. Molecular Phylogenetics and Evolution 1:242–252. doi:10.1016/1055-7903(92)90021-8
- Bandelt H-J, Forster P, Röhl A. 1999. Median-joining networks for inferring intraspecific phylogenies. Molecular Biology and Evolution 16:37–48. doi:10.1093/oxfordjournals.molbev.a026036
- Blanco-Bercial L, Álvarez-Marqués F, Bucklin A. 2011a. Comparative phylogeography and connectivity of sibling species of the marine copepod Clausocalanus (Calanoida). Journal of Experimental Marine Biology and Ecology 404:108–115. doi:10.1016/j.jembe.2011.05.011
- Blanco-Bercial L, Bradford-Grieve J, Bucklin A. 2011b. Molecular phylogeny of the Calanoida (Crustacea: Copepoda). Molecular Phylogenetics and Evolution 59:103–113. doi:10.1016/j.ympev.2011.01.008
- Blanco-Bercial L, Cornils A, Copley N, Bucklin A. 2014. DNA barcoding of marine copepods: Assessment of analytical approaches to species identification. PLOS Currents: Tree Life 6. doi:10.1371/currents.tol.cdf8b74881f87e3b01d56b43791626d2
- Bollens SM, Breckenridge JK, Cordell JR, Rollwagen-Bollens R, Kalata O. 2012. Invasive copepods in the Lower Columbia River Estuary: Seasonal abundance, co-occurrence and potential competition with native copepods. Aquatic Invasions 7:101–109. doi:10.3391/ai.2012.7.1.011
- Boxshall GA, Defaye D. 2008. Global diversity of copepods (Crustacea: Copepoda) in freshwater. Hydrobiologia 595:195–207. doi:10.1007/s10750-007-9014-4
- Boxshall GA, Halsey SH. 2004. An introduction to copepod diversity. London: The Ray Society.
- Bradford-Grieve J. 2002. Colonization of the pelagic realm by calanoid copepods. Hydrobiologia 485:223–244. doi:10.1023/A:1021373412738
- Bradford-Grieve JM. 1994. The marine fauna of the New Zealand: Pelagic calanoid copepoda: Megacalanidae, Calanidae, Paracalanidae, Mecynoceridae, Eucalanidae, Spinocalanidae, Clausocalanidae. New Zealand Oceanographic Institute. Memoir 102:1–160.
- Bradford-Grieve JM, Markhaseva EL, Rocha CEF, Abiahy B. 1999. Copepoda. In: Boltovskoy D, editor. South Atlantic zooplankton. Leiden: Backhuys Publishers. pp. 869–1098.
- Brodsky KA, Vyshkvartzeva NV, Kos MS, Markhaseva EL. 1983. Copepod crustaceans (Copepoda Calanoida) of the USSR seas and adjacent water. Opredeliteli po faune SSSR 135:1–357. ( in Russian).
- Bron JE, Frisch D, Goetze E, Johnson SC, Lee CE, Wyngaard GA. 2011. Observing copepods through a genomic lens. Frontiers in Zoology 8:22. doi:10.1186/1742-9994-8-22
- Bruen TC, Philippe H, Bryant D. 2006. A simple and robust statistical test for detecting the presence of recombination. Genetics 172:2665–2681. doi:10.1534/genetics.105.048975
- Bucklin A, Ortman BD, Jennings RM, Nigro LM, Sweetman CJ, Copley NJ, Sutton T, Wiebe PH. 2010. A “Rosetta Stone” for metazoan zooplankton: DNA barcode analysis of species diversity of the Sargasso Sea (Northwest Atlantic Ocean). Deep-Sea Research Part II-Topical Studies in Oceanography 57:2234–2247. doi:10.1016/j.dsr2.2010.09.025
- Bucklin A, Steinke D, Blanco-Bercial L. 2011. DNA barcoding of marine metazoa. The Annual Review of Marine Science 3:471–508. doi:10.1146/annurev-marine-120308-080950
- Coleman AW. 2013. Analysis of mammalian rDNA internal transcribed spacers. Plos ONE 8:e79122. doi:10.1371/journal.pone.0079122
- Cordell JR, Rasmussen M, Bollens SM. 2007. Biology of the introduced copepod Pseudodiaptomus inopinus in a northeastern Pacific estuary. Marine Ecology Progress Series 333:213–227. doi:10.3354/meps333213
- De Olazabal A, Tirelli V. 2011. First record of the egg-carrying calanoid copepod Pseudodiaptomus marinus in the Adriatic Sea. Marine Biodiversity Records 4:e85. doi:10.1017/S1755267211000935
- Di Capua I, Maffucci F, Pannone R, Mazzocchi MG, Biffali E, Amato A. under review. Molecular phylogeny of Oncaeidae (Copepoda) using nuclear ribosomal internal transcribed spacer (ITS rDNA). Plos ONE.
- Dover G. 1982. Molecular drive: A cohesive mode of species evolution. Nature 299:111–117. doi:10.1038/299111a0
- Eickbush TH, Eickbush DG. 2007. Finely orchestrated movements: Evolution of the ribosomal RNA genes. Genetics 175:477–485. doi:10.1534/genetics.107.071399
- Eyun S-I, Lee Y-H, Suh H-L, Kim S, Soh HY. 2007. Genetic identification and molecular phylogeny of Pseudodiaptomus species (Calanoida, Pseudodiaptomidae) in Korean waters. Zoological Science 24:265–271. doi:10.2108/zsj.24.265
- Figueroa DF. 2011. Phylogenetic analysis of Ridgewayia (Copepoda: Calanoida) from the Galapagos and of a new species from the Florida Keys with an evaluation of the phylogeny of Calanoida. Journal of Crustacean Biology 31:153–165. doi:10.1651/10-3341.1
- Gascuel O. 1997. BIONJ: An improved version of the NJ algorithm based on a simple model of sequence data. Molecular Biology and Evolution 14:685–695. doi:10.1093/oxfordjournals.molbev.a025808
- Geletin YV. 1976. The ontogenic abdomen formation in copepods of genera Eucalanus and Rhincalanus (Copepoda, Eucalanidae) and new system of these copepods. Issledovaniya Fauny Morei 18:75–93.
- Goetze E. 2003. Cryptic speciation on the high seas; global phylogenetics of the copepod family Eucalanidae. Proceedings of the Royal Society B: Biological Sciences 270:2321–2331. doi:10.1098/rspb.2003.2505
- Gómez-Zurita J, Juan C, Petitpierre E. 2000. Sequence, secondary structure and phylogenetic analyses of the ribosomal internal transcribed spacer 2 (ITS2) in the Timarcha leaf beetles (Coleoptera: Chrysomelidae). Insect Molecular Biology 9:591–604. doi:10.1046/j.1365-2583.2000.00223.x
- Hall TA. 1999. BioEdit: A user-friendly biological sequence alignment editor and analysis program for Windows 95/98/NT. Nucleic Acids Symposium Series 41:95–98.
- Hardy A. 1970. The Open Sea: its Natural History, Part I. The World of Plankton. 2nd ed. Collins: London.
- Hebert PDN, Cywinska A, Ball SL, de Waard JR. 2003. Biological identifications through DNA barcodes. Proceedings of the Royal Society B: Biological Sciences 270:313–321. doi:10.1098/rspb.2002.2218
- Heslop-Harrison JS, Schwarzacher T. 2011. Organisation of the plant genome in chromosomes. The Plant Journal 66:18–33. doi:10.1111/j.1365-313X.2011.04544.x
- Hirai J, Shimode S, Tsuda A. 2013. Evaluation of ITS2-28S as a molecular marker for identification of calanoid copepods in the subtropical western North Pacific. Journal of Plankton Research 35:644–656. doi:10.1093/plankt/fbt016
- Holland BR, Huber KT, Dress A, Moulton V. 2002. δ plots: A tool for analyzing phylogenetic distance data. Molecular Biology and Evolution 19:2051–2059. doi:10.1093/oxfordjournals.molbev.a004030
- Hurvich CM, Tsai C-L. 1989. Regression and time series model selection in small samples. Biometrika 76:297–307. doi:10.1093/biomet/76.2.297
- Huson DH, Bryant D. 2006. Application of phylogenetic networks in evolutionary studies. Molecular Biology and Evolution 23:254–267.
- Huys R, Boxshall GA. 1991. Copepod evolution. London: The Ray Society.
- Kimura M. 1980. A simple method for estimating evolutionary rates of base substitutions through comparative studies of nucleotide sequences. Journal of Molecular Evolution 16:111–120. doi:10.1007/bf01731581
- Kolde R 2015. R pheatmap: Pretty Heatmaps. R package version 1.0.8. Available: http://CRAN.R-project.org/package=pheatmap. Accessed Mar 2016 23.
- Librado P, Rozas J. 2009. DnaSP v5: A software for comprehensive analysis of DNA polymorphism data. Bioinformatics 25:1451–1452. doi:10.1093/bioinformatics/btp187
- Lučić D, Mozetič P, Francé J, Lučić P, Lipej L. 2015. Additional record of the non-indigenous copepod Pseudodiaptomus marinus (Sato, 1913) in the Adriatic Sea. Acta Adriatica 56:275–282.
- Matyášek R, Renny-Byfield S, Fulneček J, Macas J, Grandbastien M-A, Nichols R, Leitch A, Kovařík A. 2012. Next generation sequencing analysis reveals a relationship between rDNA unit diversity and locus number in Nicotiana diploids. BMC Genomics 13:722. doi:10.1186/1471-2164-13-722
- Mauchline J. 1998. The biology of calanoid copepods. San Diego: Academic Press.
- Moretti S, Armougom F, Wallace IM, Higgins DG, Jongeneel CV, Notredame C. 2007. The M-Coffee web server: A meta-method for computing multiple sequence alignments by combining alternative alignment methods. Nucleic Acids Research 35:W645–W648. doi:10.1093/nar/gkm333
- Naidoo K, Steenkamp ET, Coetzee MPA, Wingfield MJ, Wingfield BD. 2013. Concerted evolution in the ribosomal RNA cistron. Plos ONE 8:e59355. doi:10.1371/journal.pone.0059355
- Orive E, Laza-Martinez A, Seoane S, Alonso A, Andrade A, Miguel I. 2010. Diversity of Pseudo-nitzschia in the southeastern Bay of Biscay. Diatom Research 25:125–145. doi:10.1080/0269249X.2010.9705834
- Page RDM. 1996. Tree View: An application to display phylogenetic trees on personal computers. Computer Applications in the Biosciences 12:357–358. doi:10.1093/bioinformatics/12.4.357
- Pansera M, Granata A, Guglielmo L, Minutoli R, Zagami G, Brugnano C. 2014. How mesh-size selection reshapes the description of zooplankton community structure in coastal lakes? Estuarine, Coastal and Shelf Science 151:221–235. doi:10.1016/j.ecss.2014.10.015
- Posada D, Crandall KA. 2001. Selecting the best-fit model of nucleotide substitution. Systematic Biology 50:580–601. doi:10.1080/106351501750435121
- R Core Team. 2013. R: A language and environment for statistical computing. Vienna, Austria: R Foundation for Statistical Computing.
- Raupach MJ, Redulovici AE. 2015. Looking back on a decade of barcoding crustaceans. Zookeys 539:53–81. doi:10.3897/zookeys.539.6530
- Ronquist F, Huelsenbeck JP. 2003. MrBayes 3: Bayesian phylogenetic inference under mixed models. Bioinformatics 19:1572–1574. doi:10.1093/bioinformatics/btg180
- Rooney AP, Ward TJ. 2005. Evolution of a large ribosomal RNA multigene family in filamentous fungi: Birth and death of a concerted evolution paradigm. Proceedings of the National Academy of Sciences of the United States of America 102:5084–5089. doi:10.1073/pnas.0409689102
- Sabia L, Uttieri M, Schmitt FG, Zagami G, Zambianchi E, Souissi S. 2014. Pseudodiaptomus marinus Sato, 1913, a new invasive copepod in Lake Faro (Sicily): Observations on the swimming behaviour and the sex-dependent responses to food. Zoological Studies 53:49. doi:10.1186/s40555-014-0049-8
- Sabia L, Zagami G, Mazzocchi MG, Zambianchi E, Uttieri M. 2015. Spreading factors of a globally invading coastal copepod. Mediterranean Marine Science 16:460–471. doi:10.12681/mms.1154
- Saitou N, Nei M. 1987. The Neighbor-Joining method: A new method for reconstructing phylogenetic trees. Molecular Biology and Evolution 4:406–425.
- Sato F. 1913. Pelagic copepods (no. 1). Scientific reports of the Hokkaido fisheries experimental station 1.
- Schminke HK. 2007. Entomology for the copepodologist. Journal of Plankton Research 29:i149–i162. doi:10.1093/plankt/fbl073
- Schwarz G. 1978. Estimating the dimension of a model. The Annals of Statistics 6:461–464. doi:10.1214/aos/1176344136
- Soh HY, Kwon SW, Lee W, Yoon YH. 2012. A new Pseudodiaptomus (Copepoda, Calanoida) from Korea supported by molecular data. Zootaxa 3368:229–244.
- Tamura K, Stecher G, Peterson D, Filipski A, Kumar S. 2013. MEGA6: Molecular evolutionary genetics analysis version 6.0. Molecular Biology and Evolution 30:2725–2729. doi:10.1093/molbev/mst197
- Thompson JD, Higgins DG, Gibbson TJ. 1994. ClustalW: Improving the sensitivity of progressive multiple sequence alignment through sequence weighting, position-specific gap penalities and weight matrix choice. Nucleic Acids Research 22:4673–4680. doi:10.1093/nar/22.22.4673
- Tlili S, Ovaert J, Souissi A, Ouddane B, Souissi S. 2015. Acute toxicity, uptake and accumulation kinetics of nickel in an invasive copepod species: Pseudodiaptomus marinus. Chemosphere 144:1729–1737. doi:10.1016/j.chemosphere.2015.10.057
- Walter TC, Boxshall G. 2016. World of copepods database. Available. http://www.marinespecies.org/copepoda. Accessed Nov 2016 07
- Walter TC, Ohtsuka S, Castillo LV. 2006. A new species of Pseudodiaptomus (Crustacea: Copepoda: Calanoida) from the Philippines, with a key to pseudodiaptomids from the Philippines and comments on the status of the genus Schmackeria. Proceedings of the Biological Society of Washington 19:202–221. doi:10.2988/0006-324X(2006)119[202:ANSOPC]2.0.CO;2
- Whelan S, Goldman N. 2001. A general empirical model of protein evolution derived from multiple protein families using a maximum-likelihood approach. Molecular Biology and Evolution 18:691–699. doi:10.1093/oxfordjournals.molbev.a003851
- White TJ, Bruns T, Lee S, Taylor J. 1990. Amplification and direct sequencing of fungal ribosomal RNA genes for phylogenetics. In: Innis MA, Gelfand DH, Sninsky JJ, White TJ, editors. PCR Protocols: A guide to methods and applications. New York, USA: Academic Press. pp. 315–322.
- Wiebe PH, Davis CS, Greene CH. 1992. Visualizing life in the ocean interior. Oceanus 35:100–106.
- Wiemers M, Keller A, Wolf M. 2009. ITS2 secondary structure improves phylogeny estimation in a radiation of blue butterflies of the subgenus Agrodiaetus (Lepidoptera: Lycaenidae: Polyommatus). BMC Evolutionary Biology 9:300. doi:10.1186/1471-2148-9-300
- Wu S, Xiong J, Yu Y. 2015. Taxonomic resolutions based on 18S rRNA genes: A case study of subclass Copepoda. Plos ONE 10:e0131498. doi:10.1371/journal.pone.0131498
- Wyngaard GA, Holynska M, Schulte II. JA. 2010. Phylogeny of the freshwater copepod Mesocyclops (Crustacea: Cyclopidae) based on combined molecular and morphological data, with notes on biogeography. Molecular Phylogenetics and Evolution 55:753–764. doi:10.1016/j.ympev.2010.02.029
- Wyngaard GA, Rocha CEF, Pepato A. 2011. Familial level phylogeny of free-living cyclopoids (Copepoda), inferred from partial 18S ribosomial DNA. In: Defaye D, Suárez-Morales E, Von Vaupel Klein JC, editors. Studies on freshwater copepoda: A volume in honour of bernard dussart. Leiden: Brill. pp. 507–544.
- Zagoskin MV, Lazareva VI, Grishanin AK, Mukha DV. 2014. Phylogenetic information content of Copepoda ribosomal DNA repeat units: ITS1 and ITS2 impact. Biomed Research International 2014:1–15. doi:10.1155/2014/926342