
ABSTRACT
This article analyses the 2017 general election in New Zealand and draws out some of its implications. The final outcome was a surprise, and its implications momentous. Events strengthened Labour under a new leader and weakened the Green and New Zealand First parties, making it possible for Labour to become a viable coalition formateur. Comparing campaign public polling results, at least some of the polls were ‘wrong’, but all added to the excitement and uncertainty. Coupled with a new Labour Party leader, that uncertainty and excitement had mobilising effects that affected the young, but not the old. Finally, this article analyses the changes to the party system, nation-wide, and in the Māori electorates, assessing the degree of two-party dominance, and draws out implications for debates about the threshold for representation.
KEYWORDS:
Introduction
The results of New Zealand’s 2017 general election on 24 September were surprising and momentous. Commentators anticipated a rerun of the 2014 election. The centre-right National Party was tipped to gain a fourth term in office, defeating the Opposition Labour Party, out of power since 2008 (Robinson Citation2016). Until July 2017, few polls had put the centre-left bloc (Labour and the Green Party) ahead of the centre-right (National and the ACT Party), but most had the centre-left behind. There was a weak leftward trend, but one not sufficiently strong to indicate a change of government. With Labour rarely polling more than 30%, mostly in the mid to high 20s, there was scepticism about the Party’s ability to lead a coalition. National continued to poll in the 40s, usually at the higher end of that range.
After 16 July 2017, there was a change. This article summarises and analyses some of the main reasons it occurred and the consequences: first, the events that strengthened Labour under a new leader, weakening the Green and New Zealand First parties, making it possible for Labour to become a viable government formateur. Second, by early to mid-September political polling confirmed a competitive contest, with some polls showing Labour leading the major party race. Those polls may have been wrong, but they added to excitement and uncertainty, and with an appealing new Labour Party leader, votes were mobilised, increasing turnout. Some identified a ‘youthquake’, the young turning out more than in previous elections. Finally, this article puts the election in a broader context, analysing the implications for the party system, nation-wide, and in the Māori electorates, assessing the degree of two-party dominance, and drawing out the implications for debates around the threshold for representation under the Mixed Member Proportional (MMP) electoral system.
Catalysts of change
On 16 July, after the Green Party had announced bold policies to improve the lot of welfare beneficiaries, party co-leader Metiria Turei revealed that over 20 years before she had not disclosed income while on a benefit (Citation2017). Intended as a personal story to illustrate the problems that beneficiaries face and to draw attention to Green policies, this announcement caused a surge in Green party support in two widely respected polls and a drop to only 24% for Labour (Dann Citation2017; Gower Citation2017). Following a consequent panic within Labour, leader Andrew Little stood down on 1 August and was replaced by his popular deputy, Jacinda Ardern. Two days later, Metiria Turei admitted she had given a false address to electoral authorities in 1993. With public opinion turning against her, two senior Green MPs sought Turei’s resignation by threatening to withdraw from the party list. Turei held on, the two MPs withdrew, never to return, but when her extended family began to be drawn into the controversy two days later, Turei succumbed to the pressure. The party lost three experienced MPs. The polls showed a precipitous drop in Green Party voting intentions. Boosted by a new popular leader, Labour began a recovery that took it to almost 37% of the party vote at the final count, making Labour a credible alternative to lead a government coalition. displays the party vote and seat shares of the parties in 2014 and 2017.
Table 1. The 2017 and 2014 elections: party votes and seats.
Labour’s rise was assisted by leaked revelations that for several years New Zealand First leader Winston Peters had been overpaid his New Zealand Superannuation. Peters confirmed it after journalists’ inquiries. The overpayments had already been corrected. The information had been given to the Minister of Social Development, and eventually the Prime Minister’s Office, a step many conceded had been unwise, including the Prime Minister himself (Radio New Zealand Citation2017). The source of the leak is unlikely to be confirmed, although Peters initially blamed the Inland Revenue Department, and the initial news report suggested ‘a concerned public service apparatus’ (Reid and Murphy Citation2017). Many including Peters himself believe that it came from a National Party source. As the election approached polling showed New Zealand First to be in danger of falling below the 5% party vote threshold for parliamentary representation. At the final count, New Zealand First survived with 7.2% and 9 seats.
On 19 October, about five weeks after the election, Winston Peters announced a New Zealand First minority coalition with Labour, with a confidence and supply agreement with the Green Party, giving the Greens some Ministerial positions outside Cabinet. With 44.5% of the party vote to Labour’s 36.9%, and only having lost 3 seats, the National Party had assumed it would take office with New Zealand First. But there was greater policy congruence between two coalition parties, and National had campaigned aggressively against New Zealand First, calling for voters to ‘cut out the middle man’ (One News Now Citation2017).
The election did not simply consolidate the centre-left vote around Labour, although that was part of the picture. There was a shift to the left of about 6%: a net transfer between the two sets of parties clearly representing the right and left. The right retained an overall margin of about 2%, in terms of seats putting New Zealand First in the pivotal position: one prior election expectation that was met. Eighty-one per cent of votes were cast for the two major parties, marginally higher than any previous election under the MMP electoral system.
The polls and the campaign
Because of declining response rates (Brick and Williams Citation2013) and increasing costs of securing representative samples, public opinion polling has become increasingly challenging. Most interview modes shifted from personal to telephone interviews long ago (Holbrook et al. Citation2003). Personal interviews achieve the highest response rates, although responses have been declining even in that mode. Landlines have been the sampling frame for telephone surveys, but landline telephone coverage has been dropping as more individuals take up the exclusive use of mobile phones: in 2013, 14% of Zealanders had no landline at home (Statistics New Zealand Citation2015). The number of landline-free households is increasing (Junn Citation2017), most concentrated among the young. Lower costs have also made internet polling more attractive.
There were significant changes in the polling environment in New Zealand during the 2017 election campaign. The two major newspaper chains, based in the New Zealand Herald, and Fairfax media failed to commission polls in 2017. TV3/Reid Research conducted three campaign polls (22 August and after). One News/Colmar-Brunton conducted four. Single polls were conducted by Roy Morgan Research, Bauer Research and SSI.
indicates the overlapping polling days for the various firms, the poll results for Labour and the differences between Labour and National. In late August, and again in mid-September, Reid Research and Colmar-Brunton polls produced very different findings, Colmar-Brunton putting Labour ahead of National for its first three campaign polls, and Reid Research showing Labour consistently lagging behind National. In its last pre-election poll, the Colmar-Brunton poll converged with Reid. Over 9–13 September, the differences were large, Reid Research putting Labour nine points behind, Colmar-Brunton putting Labour four points ahead. These contrasts are outside the margins of error and are found in least two sets of polls, not just one.
Table 2. Polling days and results for Labour, across public polling firms, 2017 election campaign.
The other public polls are not helpful in addressing this discrepancy. From 1–5 September, Reid was not in the field, and two online polls also showed a Labour lead. The SSI Internet poll for Newsroom had a very small sample size and its low estimate for National is much too low for comfort. The online Bauer poll was more plausible, but still put Labour below the Colmar-Brunton estimate. Roy Morgan Research, telephone polling over a longer period from 28 August to 10 September was putting National ahead, but only by 0.5%. The Reid/Colmar-Brunton discrepancy over this period raises the spectre of ‘poll failure’, although not one as severe as that took place in Britain in 2015 (Sturgis et al. Citation2016). In that case, most of the pollsters got it wrong.
Assessing which pollsters were ‘wrong’ or ‘right’ is not easy. Colmar-Brunton used random-digit dialing of telephone landlines. Early in 2017, Reid Research had moved to an augmented landline model by adding a quarter of its respondents from an online panel (Junn Citation2017). Meanwhile, Roy Morgan was sampling mobile phones as well as landlines. The theory behind opinion polling assumes random sampling: but online panels are usually not sampled randomly, selected from recruited panels of respondents on their demographics and location. Panel respondents often participate in multiple surveys. The American Association of Public Opinion Research (AAPOR) has warned that it may be misleading to report a margin of error from a non-probability sample (AAPOR Citation2017). Admittedly, current random probability telephone polls are not necessarily superior to non-probability Internet polls, because statistical theory also assumes 100% response rates. A 30% response rate is probably the best that telephone probability samples can now achieve in New Zealand: telephone response rates are even worse elsewhere (Keeter Citation2012). In 2014, Colmar-Brunton was achieving an average response rate of 28.3% (Sibley et al. Citation2017, p. 23).
Various other practices are relevant. Drawing out interviews over a long period can address biases. The shorter the fieldwork period, the more likely ‘hard to find’ respondents will not be found. Reid Research tended to call over slightly longer periods than Colmar-Brunton. Another difference between pollsters lies in how much they pressure respondents to express a party preference and thereby reduce ‘don’t knows’ and ‘won’t tells’. The safest practice is probably low pressure, which appears to have been the practice of Colmar-Brunton: only about 840 of the 1000 it sampled during the campaign expressed a preference, compared to about 920 out of 1000 for Reid Research.
Sampling bias (in the case of online surveys) and non-response bias (in the case of phone interviews) can be partly corrected by weighting up the responses of some and weighting down those of others. Contemporary survey research is as much an art as a science: constructing a representative sample is a craft that requires skill and judgment. Inquiry into the problems of low response rates provides reassuring evidence that properly conducted and analysed, probability samples with low response rates can produce representative results (Pew Research Centre Citation2012).
Nonetheless, there appears to be a consensus that Colmar-Brunton’s early to mid-September polling was in error (Jennings Citation2017). The accuracy of the purely online polls is also questionable. Unofficial reports from the two major party pollsters, UMR-Insight for Labour and Curia for National, indicated their numbers to be closer to those of Reid Research, possibly never putting Labour ahead of National, although close at times. But numbers have not been released, except for Curia’s final poll that put National four points ahead of Labour (Hickey et al. Citation2017). During the crucial period, Reid Research and Roy Morgan did pick up the Labour surge, but nowhere to the same extent as Colmar-Brunton. Reid Research later showed a fall-back in the Labour vote, also consistent with unofficial reports of party polling. There is a consensus on the general dynamics, recognising the effectiveness of a National counter-attack on tax issues. But Colmar-Brunton apparently exaggerated the Labour surge at its height and were late in recognising its retreat. It is telling that Colmar-Brunton’s first post-election poll added a mobile phone component and moved from a five-day to a seven-day interview period, a significant retuning of its methodology.
The implications for future polling in New Zealand are salutary. Landlines alone no longer provide an optimal sampling frame. Randomly sampling mobile phones in conjunction with landlines is likely to produce better results than online panels. Online panels need to be large and may be more difficult to construct, draw upon and weight in countries with relatively small populations such as New Zealand. While likely adequate for market research, the precision required to estimate vote choices sets a high standard. But because online panels are cheaper, their use will probably grow.
Contrary to more optimistic assessments (Jennings Citation2017), the experience of the 2017 election does not bode well for political polling in New Zealand. There were fewer high-quality polls than in the past, and too much variation among the survivors. The polls that were fully online were outliers. A useful means of reducing poll uncertainty is the calculation of ‘polls of polls’, averaging out the responses from different polls, done both by RNZ and the Stuff /Fairfax publications in 2017. But if polls diverge dramatically, well outside confidence intervals, are of uncertain quality and are thin on the ground, a poll of polls may itself suffer from error.
Turnout and mobilisation
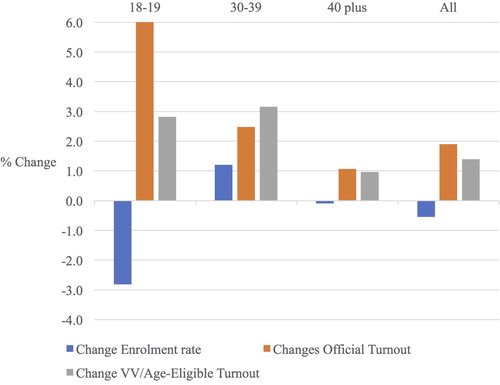
Perceptions and expectations generated by the polls had a positive effect. Official turnout was up by 1.9%, but when adjusted for a slightly lower enrolment rate than in 2014 (Electoral Commission Citation2017b) and after deleting informal and disallowed votes, the real increase in valid votes on the base of all those eligible to vote by age and residence was 1.4%. Overall, age-eligible turnout of valid voters in 2017 was 72.4%, compared to the official figure of 79.8%.
At first sight, the young were a big factor in the improvement in turnout: according to Electoral Commission data, in 2014, 62.5% of those aged 18–29 years who were on the electoral rolls cast ballots: in 2017, 68.5%, an apparent increase of 6% (Electoral Commission Citation2017c). However, after using updated population estimates that correct for a slight earlier over-estimation of the youth population, enrolment among the 18–29 age group fell between 2014 and 2017 from 78.7% to 75.8%. Calculating eligible population-based youth turnout finds a real increase among the 18–29 group from 49.1% to 52%: 2.9%. A slightly bigger increase in turnout on the vote/eligibility basis was among the 30–39 age group, 3.2% (Electoral Commission Citation2018). It is tempting to place this in the context of Labour’s choice of 37-year-old Jacinda Ardern as leader early in August. Among those aged 40 years and above, there was a 1% age-eligible turnout increase. displays this data.
Figure 1. Enrolment change, official turnout change and age-eligible turnout change 2014–2017 elections. Sources: Electoral Commission (Citation2017b, Citation2017c, Citation2018).
Enrolment of voters in their areas of strongest support indicates parties’ success in their efforts on the ground. Mobilising votes is more challenging for Labour, given its greater appeal to those on lower incomes, in rental accommodation, and the young. Members of these groups tend to be residentially mobile and need greater efforts to be kept on the electoral rolls. In 2014, the enrolment rate across the country fell by a little over 1% (to 92.6% of those eligible by age, citizenship, or residency). In 2017, the enrolment rate fell again to 92.1%. In 2014, the fall in enrolment was greater in Labour-voting than National voting electorates (Vowles et al. Citation2017, p. 245).
The picture in 2017 was different: in the 23 general electorates with Labour party votes of over 30% in 2014, after controlling for age and income, enrolment tended to be up in 2017. The same pattern is found even without those controls. In the rest of the general electorates, enrolment tended to be down. A regression model, on which these findings are based, controls for median age and income by general electorate, 2014 National vote, and the proportion on the Maori roll (). Enrolment data is unavailable for Maori electorates, but the numbers on the Maori roll by general electorate are identified. plots the association between the concentration of Labour party votes in 2014 on the change in enrolment between 2014 and 2017. To adjust for the Maori roll effect, the probabilities are calculated with the proportion on the Maori roll set at 0.
Figure 2. Per cent change in enrolment 2017–2014 by Labour Party Vote in 2014. Source: post-estimation from Model Reported in .
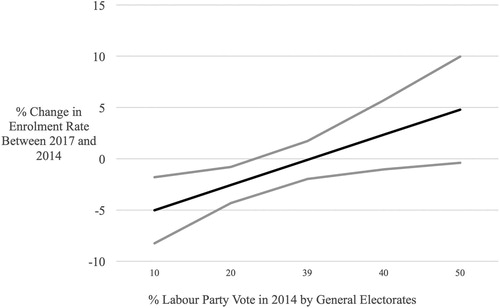
Table 3. Changes in enrolment in general electorates, 2014–2017.
For every year, higher was the median age across the electorates, change in enrolment was also higher by about half a percentage point. For each $10,000 higher the median household income by electorate, change in enrolment was up by about 1.3%. Labour organisation and enthusiasm probably mobilised more on to the rolls in its areas of concentrated support, but these were not necessarily the youngest or those on low incomes. However, one must be wary of the ecological fallacy: inferring individual from collective behaviour can be misleading. Individual-level data not yet available from the 2017 New Zealand Election Study is needed to confirm these findings, or otherwise.
The party system and the threshold
With an 80% major party vote in 2005 and a similar 79% in 2008, there was talk of a ‘multi-party mirage’ (Curtin and Miller Citation2010). In 2011 and 2014, non-major party votes crept up again. But the two major parties have survived more strongly under MMP than expected (Shugart and Tan Citation2016; Vowles Citation2017). In 2017, the two-party vote was 81%. When we weight the number of parties by their vote shares (Laakso and Taagapera Citation1979), as shown in , the effective number of parties in 2017 was 2.9, a reduction from 3.3 from 2014, but very similar to 3.0 in 2005.Footnote1
Figure 3. The effective number of elective parties in New Zealand, 1905–2017.
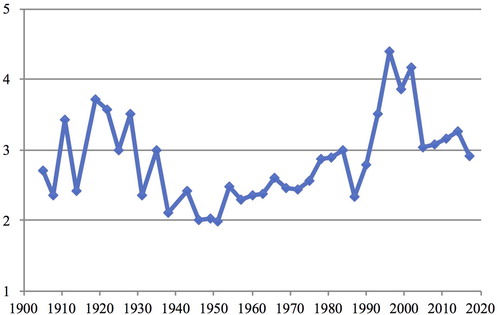
Since 2005, electoral behaviour has stabilised. In a transitional phase from the first MMP election in 1996 to the 2002 election, smaller parties were relatively successful: in 1996, the effective number of parties was 4.4 and in 2002, 4.2. New Zealand has experimented with a fragmented party system and decided on a more moderate version, within which the weighted effective number of parties has cycled around 3. Vote shifts have also stabilised. Since 2005, net vote volatility has been about half what it was over the three post-MMP transition elections (Vowles Citation2014, p. 34). At about 27%, net volatility between 2017 and 2014 was the highest since 2008, but much lower than between any pair of consecutive elections between 1990 and 2005. This post-transition MMP party system has most in common with that of 1978–1984, when the effective number of parties was also just below three. At that time in terms of votes cast, if not seats won, New Zealand had developed a moderate multi-party system much like that of today.
Some argue that the MMP system has failed to deliver on the promise of a multi-party system. Proposals to lower the threshold have emerged, including one from the 2012 Electoral Commission Review that recommended 4%, plus the abolition of the so-called coat tail provision whereby a party winning an electorate seat or seats can claim list members even if its party vote is below 5% (Electoral Commission Citation2012). There were no coat tails in 2017: the most recent was in 2014, when the Māori Party gained a list seat on a party vote of 1.4%. The main objection to the current threshold arrangements is the anomaly where parties without an electorate seat with party votes just below the threshold get no seats, while parties below the threshold that have won an electorate get list seats.
Some would abolish the threshold entirely. displays the relationships between votes and seats for the parties under 5% of the party vote that either gained an electorate seat or scored a party vote that would have given it one or more seats in the absence of any party vote threshold. Between 1996 and 2017, there were 101 party ‘runs’ that received less than 5% of the party vote. Only a small number of cases illustrate the anomaly: parties on about 4% of the party vote with no electorate seat fail to get any seats (the Christian Coalition 1996, New Zealand First 2008, the Conservative Party 2014, TOP in 2017, in bold in the Table). Shaded cells also indicate ‘coat tailing’.
Table 4. Parties Under the party vote threshold, 1996–2017 including potential seat winners assuming no threshold.
The Electoral Commission review of the MMP system followed expert advisers, including members of the Royal Commission that first recommended MMP (Mulgan Citation1999; Wallace Citation2002; Electoral Commission Citation2012). It proposed a reduction of the party vote threshold to 4% and the abolition of ‘coat tailing’, but this would still have kept the Conservative Party out of Parliament in 2014. The Electoral Commission’s proposal would not have prevented overhang anomalies, a situation where the party vote alone would not justify the full number of electorate seats won for the party in question: see the cells in with figures in italics. Of course, the increase in list seats to compensate for overhang does so only partially. In Germany, since 2013, the Constitutional Court has obliged the number of list seats to increase even more to compensate for overhangs and restore overall proportionality. Such a provision can generate significant temporary increases in the number of list MPs.
Arguments have been made to reduce the party vote threshold to 3%. That would have allowed the Conservative Party to enter Parliament in 2014 and would have retained ACT’s four MPs in 2008 in the absence of coat tailing. Some go further to advocate the complete abolition of the party vote threshold. If the party vote threshold is currently crossed by an electorate win, a single seat can be allocated under the formula with as little as 0.5% of the party vote. Without a threshold, in previous elections under MMP, the following parties could have gained a seat or seats: Aotearoa Legalise Cannabis (1996, 1999, 2002, 2011); Outdoor Recreation (2002), Destiny (2005), Future New Zealand (1999); the Kiwi Party (2008); the Bill and Ben Party (2008); the Alliance (2002) and Internet-Mana (2014). In 2017, with no threshold the Maori Party could have retained one seat and The Opportunities Party could have gained three. As the absence of a threshold would reduce the number of seats gained by most other parties, the current government would have had 61 seats, a bare majority, and National/ACT plus New Zealand First would have managed to secure 64 seats. In that context, the government formation outcome could have been different.
A threshold discourages excessive fragmentation in party representation in Parliament. Several very small parties can make government formation difficult because they may occupy pivotal positions of considerable power. Such fears lay behind opposition to New Zealand’s adoption of the MMP system. A significant threshold reduces such risks, although does not remove them. The electorate seat threshold has produced more party fragmentation than many expected. But because most small party electorate wins have been underpinned by large party cooperation or some would say, connivance, the small parties benefiting have been sources of stability rather than instability. Without an electorate threshold, removal of coat tailing pay-off potential would reduce the value of very small party allies to the larger parties. Ironically, had the National party won the Epsom and Ohariu electorates in 2014 instead of ACT and United Future, it would have probably been able to form a single-party majority government (Farrar Citation2014).
The Māori party system
Māori politics forms a different dimension from that of the rest of the country, with its own distinct party system rooted in the seven Māori electoral districts that overlie the general electorates (Sullivan and Vowles Citation1998; Sullivan and Margaritis Citation2000, Citation2002; Sullivan Citation2015; Vowles et al. Citation2017, p. 214–240). In the Māori party system, the National Party has been reduced to minor status. Until 2005, the vast majority of Māori electors voted for the same menu of political parties standing across the entire country. Since 2002, New Zealand First has not stood candidates in the Māori seats: National followed suit in 2005. Meanwhile, many Māori had long been seeking independent representation. That objective was fulfilled by the Māori Party in 2005. From Labour dominance since the 1940s, the Māori electorates have swung to New Zealand First in 1996, back to Labour in 1999 and 2002 and to the Māori Party in 2005 and 2008 and back again to Labour in 2014 and 2017. The catalyst for the appearance of the Māori Party was the Foreshore and Seabed legislation passed by Labour and New Zealand First in 2004. It prevented Maori from seeking customary title to land around and beyond the coastline, a prospect opened up by a court decision and re-established after the law was repealed and replaced by a National government by agreement with the Māori Party. The Māori Party failure to retain seats in 2017 may have concluded another chapter in Māori electoral politics.
shows the tide returning to Labour in 2017. Just over 60% marks the highest party vote in the Māori electorates Labour has gained under MMP. However, Labour’s electorate vote of 53.4% still lags behind its MMP height of 63.8% in 2002. The two Māori self-determination parties, Māori and MANA, together polled about a third of the Māori electorate votes. At its height in 2008, before the split that led to the establishment of MANA, the Māori Party’s electorate vote was 57.9%. A residue of opposition to Labour remains among Māori, the legacy of the Foreshore and Seabed law. Remaining anti-Labour sentiment was not enough for the Māori Party to hold even one electorate seat in 2017, even in the absence of competition with MANA: the two parties had agreed not to run against each other, MANA contesting Tai Tokerau and Māori the remaining six electorates. In 2014, the split vote between Māori and Mana was the main reason for Labour’s recovery of three seats in that election. Labour’s electorate vote increased only marginally between 2011 and 2014 (Vowles et al. Citation2017, p. 222). In 2017, Labour prevailed despite the Māori/MANA arrangement.
Table 5. The Maori electorates, 2014 and 2017 elections.
The Māori electorate party vote was much less fragmented in 2017 than in 2014. Reflecting Labour’s dominance in the Māori electorate party vote, the effective number of parties dropped from a high 4.2 in 2014 to 2.5 in 2017. This would be even lower if Māori and MANA were combined in the calculation. On the surface, it seems that most of Labour’s gains have come from the collapse of MANA, a party that defined itself to the left of the Māori Party and criticised its support for National in government. A shift in the loyalties of some key Māori opinion leaders towards Labour before the 2017 election probably cued much of this shift, assisted by the appointment of a senior Maori Labour MP, Kelvin Davis, as Labour’s Deputy-leader as part of the leadership change.
Conclusions
2017 was a momentous election with a surprising outcome. It produced the first New Zealand government that could not have been generated under the old first-past-the post system, thrusting a strong plurality winner into Opposition. The campaign was competitive and compelled attention. Labour leader Jacinda Ardern mobilised a personal following, and Labour’s fortunes revived. The polls communicated the broad features of the campaign, including a Labour surge and later marginal retreat, but several over-estimated Labour support at critical junctures. Excitement and the possibility of change mobilised votes, particularly in Jacinda Ardern’s own age cohort, and on the left. The pendulum also swung in that direction, but not as strongly as many expected. The party system adjusted, within a consolidated post-MMP framework that first clicked into place in 2005 with three ‘effective’ political parties. Māori politics reverted to its traditional Labour dominance, but with a significant minority still voting for an independent Māori voice. The two key smaller parties lost votes but entered government. A 4% representation threshold would probably have made no difference, but in the absence of a threshold, the change of government would have been less likely.
Post-election, the new government moved to increase income support for families and those on benefits: one of the main thrusts of the Green Party policies Metiria Turei highlighted in her extraordinary speech. Hypothetical chains of events can only be constructed speculatively. Had Turei not given such a speech, the temporary shift of Labour vote intentions to the Greens would not have happened. Andrew Little would have retained the Labour leadership. Given the slow but steady trend to the left since the 2014 election, it is not impossible that, with Little remaining leader, Labour and the Greens might have together polled as well as they did. But under that scenario the odds of a change of government would have been much lower. We will never know. But as consolation for the end of her political career, the way that events have turned out may be of some comfort to Metiria Turei.
Disclosure statement
No potential conflict of interest was reported by the author.
Notes
1 Calculated as one divided by the sum of the squares of party vote shares as proportions of one.
References
- AAPOR. 2017. Sampling methods for political polling. http://www.aapor.org/Education-Resources/Election-Polling-Resources/Sampling-Methods-for-Political-Polling.aspx.
- Brick JM, Williams D. 2013. Explaining rising nonresponse rates in cross-sectional surveys. The Annals of the American Academy of Political and Social Science. 645:36–59. doi:10.1177/0002716212456834.
- Curtin J, Miller R. 2010. New Zealand’s future party system: a multi-party mirage? In: Stephen Levine, Nigel S. Roberts, editors. Key to victory: The New Zealand general election of 2008. Wellington: Victoria University Press; p. 120–136.
- Dann C. 2017 Jul 30. Labour slumps to its lowest level in more than 20 years in latest 1 NEWS Colmar Brunton poll. One News Now. https://www.tvnz.co.nz/one-news/new-zealand/labour-slumps-its-lowest-level-in-more-than-20-years-latest-1-news-colmar-brunton-poll.
- Electoral Commission. 2012. Report of The electoral commission on the review of the MMP voting system. Wellington: Electoral Commission.
- Electoral Commission. 2014. Summary of overall results. Wellington: Electoral Commission. http://archive.electionresults.govt.nz/electionresults_2014/e9/html/e9_part1.html.
- Electoral Commission. 2017a. 2017 general election – official result. Wellington: Electoral Commission. http://www.electionresults.org.nz/electionresults_2017/.
- Electoral Commission. 2017b Sep 30. Enrolment statistics by electorate. [accessed 2017 Dec 6]. http://www.elections.org.nz/research-statistics/enrolment-statistics-electorate.
- Electoral Commission. 2017c. Voter turnout statistics. http://www.electionresults.govt.nz/.
- Electoral Commission. 2017d. ‘New Zealand Election Results’. http://www.elections.org.nz/events/2017-general-election/2017-general-election-results/voter-turnout-statistics.
- Electoral Commission. 2018 Jan 31. Enrolment statistics by electorate. http://www.elections.org.nz/research-statistics/enrolment-statistics-electorate.
- Farrar D. 2014. What If. http://www.kiwiblog.co.nz/2014/10/what_if.html.
- Gower P. 2017. “ Poll: Newshub poll: Winston Peters cements position as kingmaker”. Newshub. http://www.newshub.co.nz/home/election/2017/07/newshub-poll-winston-peters-cements-position-as-kingmaker.html.
- Hickey B, Murphy T, Jennings M. 2017 Sep 20. “Election 2017 Live: National surges into big poll lead”. [accessed 2017 Sep 25]. https://www.newsroom.co.nz/2017/09/20/48879/election-2017-live-an-awkward-jet-fuel-crisis.
- Holbrook AL, Green MC, Krosnick JA. 2003. Telephone versus face-to-face interviewing of national probability samples with long questionnaires: comparisons of respondent satisficing and social desirability response bias. Public Opinion Quarterly. 67(1):79–125. doi: 10.1086/346010
- Jennings M. 2017 Sep 27. Bugger the pollsters: Not this time. Newsroom. https://www.newsroom.co.nz/2017/09/25/49900/bugger-the-pollsters-not-this-time.
- Junn J. 2017 Mar 28. A matter of trust: Patrick Gower on improving Newshub’s political polling. http://stoppress.co.nz/features/newshub-polling.
- Keeter S. 2012. Assessing the representativeness of public opinion surveys http://www.people-press.org/2012/05/15/assessing-the-representativeness-of-public-opinion-surveys/.
- Laakso M, Taagepera R. 1979. “Effective” number of political parties: A measure with application to west Europe. Comparative Political Studies. 12:3–27. doi: 10.1177/001041407901200101
- Mulgan R. 1999. “Have New Zealand’s Political Experiments Increased Public Accountability?” Australian National University Discussion Paper No. 59. https://digitalcollections.anu.edu.au/bitstream/1885/41948/1/dp_59.html.
- One News Now. 2017 Sep 20. I'm suggesting to voters they cut out the middle man’ – English issues blunt message on Peters. https://www.tvnz.co.nz/one-news/new-zealand/watch-im-suggesting-voters-they-cut-middle-man-english-issues-blunt-message-peters.
- Pew Research Centre. 2012. ‘Assessing the Representativeness of Public Opinion Surveys’. Washington (DC): Pew Research Centre. http://assets.pewresearch.org/wp-content/uploads/sites/5/legacy-pdf/Assessing%20the%20Representativeness%20of%20Public%20Opinion%20Surveys.pdf.
- Radio New Zealand. 2017 Aug 29. Timeline: Winston Peters’ superannuation overpayments saga. https://www.radionz.co.nz/news/election-2017/338250/timeline-winston-peters-superannuation-overpayments-saga.
- Reid M, Murphy T. 2017 Aug 28. Co-habiting Peters billed $18,000 Newsroom. https://www.newsroom.co.nz/2017/08/27/44774/co-habiting-peters-takes-single-super.
- Robinson C. 2016 Nov 17. Who will win the 2017 election and why. http://www.massey.ac.nz/massey/about-massey/news/article.cfm?mnarticle_uuid=5A436104-C7B9-76A6-6C18-83F8AE86C186.
- Shugart MS, Tan AC. 2016. Political consequences of New Zealand’s MMP system in comparative perspective. In: Nathan F. Batto, Chi Huang, Alexander C. Tan, Gary W. Cox, editors. Mixed-Member electoral systems in constitutional context. Ann Arbor: University of Michigan Press; p. 247–277.
- Sibley CG, Robertson A, Osborne D, Huang Y, Milojev P, Greaves LM, Houkamau CA, Bulbulia J, Barlow FK. 2017. Bias and tracking accuracy in voting projections using the New Zealand attitudes and values study. Political Science. 69(1):16–34. doi: 10.1080/00323187.2017.1321589
- Statistics New Zealand. 2015. 3 in 4 New Zealand households online. http://archive.stats.govt.nz/Census/2013-census/profile-and-summary-reports/quickstats-transport-comms-mr.aspx.
- Statistics New Zealand. 2017. 2013 Census electorate tables. http://archive.stats.govt.nz/Census/2013-census/data-tables/electorate-tables.aspx.
- Sturgis P, Baker N, Callegaro M, Fisher S, Green J, Jennings W, Kuha J, Lauderdale B, Smith P. 2016. Report of the inquiry into the 2015 British general election opinion polls. London: Market Research Society and British Polling Council.
- Sullivan A. 2015. Tōrangapū – Māori and political parties – National, New Zealand First, Māori and Mana parties. Te Ara – the Encyclopedia of New Zealand, updated 2015 Jun 29. http://www.TeAra.govt.nz/en/interactive/36746/party-affiliations-of-Māori-mps-1890-2014l.
- Sullivan A, Margaritis D. 2000. Māori voting patterns in 1999. In: S. Levine, N. Roberts, editors. Left turn: The New Zealand general election of 1999. Wellington: Victoria University of Wellington Press; p. 175–183.
- Sullivan A, Margaritis D. 2002. Coming home: Māori voting in 1999. In: J. Vowles, P. Aimer, J. Karp, S. Banducci, R. Miller, A. Sullivan, editors. Proportional representation on trial: The 1999 election in New Zealand and the fate of MMP. Auckland: Auckland University Press; p. 66–82.
- Sullivan A, Vowles J. 1998. Realignment? Māori and the 1996 election. In: J. Vowles, P. Aimer, S. Banducci, J. Karp, editors. Voters’ victory? New Zealand’s first election under proportional representation. Auckland: Auckland University Press; p. 171–191.
- Turei M. 2017. Mending the safety net – Metiria Turei’s speech to the Green Party 2017 AGM. https://www.greens.org.nz/news/speech/mending-safety-net-%E2%80%93-metiria-turei%E2%80%99s-speech-green-party-2017-agm.
- Vowles J. 2014. Putting the 2011 election in its place. In: Vowles J., editor. The New electoral politics in New Zealand: the significance of the 2011 election. Wellington: Institute for Governance and Policy Studies; p. 27–52.
- Vowles J. 2017. Electoral systems in context: New Zealand. In: Erik S. Herron, Robert Pekkanen, Matthew Søberg Shugart, editors. The Oxford handbook of electoral systems. Oxford: Oxford University Press; doi:10.1093/oxfordhb/9780190258658.013.29.
- Vowles J, Coffé H, Curtin J. 2017. A bark But No bite: inequality and the 2014 New Zealand general election. Canberra: ANU Press.
- Wallace J. 2002. Reflections on constitutional and other issues concerning our electoral system: The past and the future. Political Science. 54(1):47–65. doi: 10.1177/003231870205400105
