
ABSTRACT
While there is a global shift towards smaller families, some groups maintain relatively high fertility rates. The 2013 New Zealand census data were used to investigate the nature of fertility between ethnicities in New Zealand. The NZ Deprivation Index 2013 was used as a measure of socioeconomic status to determine the relationships with fertility. The results mirror research outside of New Zealand in that socioeconomic status is inversely correlated to fertility. Using crude average fertility rates, sole-ethnicity Pasifika and Māori ethnic groups still have substantially higher fertility than sole-ethnicity Europeans and Asians ethnic groups, even when simultaneously accounting for age, socioeconomic status, education, and religious affiliation. Christians have more children than individuals reportedly without any religion, and fertility rates drop on average for mothers who have higher formal qualifications. Our findings suggest that cultural, or other ethnic-specific factors differentially affect fertility for Māori, Pasifika, New Zealand European, and Asians as aggregated ethnic categories, respectively.
Introduction
The benefits of having and raising children is self-evident, but it is also widely accepted that raising children can be expensive. A 2009 report by Claus et al. (Citation2010), calculated that the weekly expenditure to raise a child in New Zealand, based on costs of clothing, housing, house contents, health care, transport, recreation, and personal care was a minimum of $147 (NZD) per week, reaching as high as $316 per week, depending on parents’ income. This means that by even the most conservative estimates, at the time children represented a total cost of $137,000 NZD for a single child for low-income families and somewhere around $295,000 NZD for average-income families. This calculation does not include ongoing costs to supporting offspring into adulthood and will undoubtedly be much higher in 2018. In other developed countries such as the U.S. ($233,610 USD) (United States Department of Agriculture: Centre for Nutrition Policy and Promotion Citation2017), and the U.K. (£227,266) (Centre for Economics and Business Research Citation2014), the cost of raising children is also non-trivial.
Bearing children brings emotional and social joy, but incurs psychological tolls in addition to monetary costs. Despite the joy of parenthood, the overwhelming consensus in the study of subjective-wellbeing (i.e. happiness and life satisfaction) is that parenthood does not reliably increase happiness (McLanahan and Adams Citation1987; Nomaguchi and Milkie Citation2003; Evenson and Simon Citation2005). A recent meta-analysis by Hansen (Citation2012), using data from numerous countries, points towards a negative effect of child-bearing on the happiness of the parents, concluding that: ‘Most cross-sectional and longitudinal evidence suggest, however, that people are better off without having children’ (p. 29). Hansen further elaborates that: ‘It is mainly children living at home that interfere with well-being, particularly among women, singles, [and] lower socio-economic strata … ’ (p. 29). In investigating why children do not reliably correlate with parental happiness, Pollmann-Schult (Citation2014) concluded that children per se contribute to increased happiness, but that these effects are offset by the monetary and time costs accrued by raising children. Taken seriously, these findings argue against bearing children for the sake of being happier, while some have argued against having children at all (e.g. Benatar Citation2006). Adding to this is that in recent years there have been growing pockets of anxiety in the public dialogue over the ethical soundness of producing children who not only will contribute to catastrophic climate change, but may also live through its bleakest consequences (Rieder Citation2016).
The intention is not to depict childbearing as a necessarily poor decision: merely a non-trivial one, highlighting that reproduction is an interesting phenomenon. It reflects parents’ belief that the benefits of child-rearing outweigh the costs, or alternatively, that it marks the extent that parents do not prioritise family planning measures such as contraception. The costs and benefits potentially reflect socioeconomic and educational factors. This article will consider these determinants to explain the difference in fertility rates between major ethnic groups in New Zealand.
Literature review
Fertility patterns
The trend seen in many national fertility estimates across the globe indicates fertility rates that are either declining or plateauing at a modest averaging. Estimated rates of worldwide fertility (average number of children per woman) for the period 1950–1955 were 4.97, compared to 3.86 in 1975–1980, and 2.5 in 2005–2010 (International Historical Statistics Citation2016). East Asia is especially affected by declining birth rates: in South Korea, women’s postponement of childbearing in recent decades has seen a sharp decline in fertility to ‘ultra-low’ rates in the space of a single generation (Yoo and Sobotka Citation2018), and in China, due to a one-child policy, the estimated fertility rate has shifted from 5 children per woman in 1950 to around 1 in 2015, with little sign of increasing after relaxation of governmental restrictions (Zhao et al. Citation2017). In Continental Europe and English-speaking countries (including New Zealand) fertility has not dropped to such extremes, but has settled around a rate of around 2, far below pre-industrial fertility levels (Myrskyla et al. Citation2013). By and large, this cooling off of fertility has been attributed some of the benefits brought about by industrialisation, including greater survival rates of born children (Our World in Data Citation2016), women’s rights, contraception, and greater wealth and income (Myrskla et al. Citation2009)
While there is a global shift towards smaller families, some cultural, religious, and economic groups maintain relatively high fertility rates. For example, across the United States, poorer families tend to have higher fertility (Gillespie et al. Citation2007), and Latino mothers have consistently higher fertility rates compared to other ethnicities, although this gap has narrowed since 1990 (Population Reference Bureau Citation2012). A less-pronounced but similar effect holds true for African-American mothers. Similarly, some ethnic minority groups in New Zealand show disparities in fertility rates: Māori and Pasifika have historically had higher fertility rates compared to the general New Zealand population (Statistics New Zealand Citation2004). This trend has continued through the mid-2000s (Statistics New Zealand Citation2005) where average fertility for Māori (2.6) and Pasifika (2.8) averaged about 1 child more per woman than European (1.7) and Asian (1.8) in 2003 and remained roughly the same in the 2012–2014 period (Statistics New Zealand Citation2014a). In this article we investigate correlates of fertility rates that distinguish aggregated ethnic groups, paying special attention to Pasifika and Māori due to their socioeconomic vulnerability and anomalously high fertility rates compared to other major New Zealand ethnicities.
Drivers for Pasifika and Māori fertility
The two variables that can help explain higher rates of fertility for Pasifika and Māori in New Zealand fall into two categories: ethnic identity (and the culture that is associated with it), and socioeconomic status. The challenge in ascertaining the contribution of these two factors is that socioeconomic status and ethnicity closely relate. Regarding socioeconomic status in New Zealand, research by Perry (Citation2017) on New Zealand families living in hardship shows that households with three or more children are more likely to be living in hardship; specifically, around 20% of children in 2-child households are living in hardship, compared to 30% of households with more than two children. In the literature, economic modelling of child-bearing has long included socioeconomic status as a predictor (Becke and Lewis Citation1973), and contemporary research outside of New Zealand finds that socioeconomic status correlates negatively with fertility, such that higher socioeconomic families tend to have fewer children (e.g. Jones and Tertilt Citation2008). For instance, this socioeconomic status-fertility negative correlation (SESFc) has been found in Ghana and Peru (Bollen et al. Citation2006) Canada, Iceland, Norway, Sweden, and the USA (Dribe et al. Citation2014).
In New Zealand, Pasifika and Māori on average have lower socioeconomic status compared to the general population. For example, according to 2013 New Zealand census data, New Zealand Europeans had a median income of $30,600 compared to $22,500 and $20,800 for Māori and Samoans (the most numerous Pasifika ethnicity in New Zealand), respectively (Statistics New Zealand Citation2013a), and in 2015–2016, 28% and 26% of Pasifika and Māori children respectively lived in poverty compared to 14% of New Zealand European children (Perry Citation2017). How much then, of the high fertility seen in Pasifika and Māori is actually because these two ethnic groups tend to fall into low-socioeconomic strata (e.g. Marriott and Sim Citation2014), rather than any specific ethnic influences on fertility per se? There is a possibility that heightened fertility in Pasifika and Māori is artifactual rather than something particular to these ethnicities.
The question that arises is how socioeconomic status would modulate fertility. One possibility is that socioeconomic status is closely correlated with education, and educated women use contraception or employ other family planning methods (e.g. vasectomy, withdrawal) with greater efficacy, or are more likely to see merit in withholding childbirth due to career aspirations. In support of this, Daniels and colleagues (Citation2015) found in a large United States sample that 37–41% of children born to women without a high-school diploma were unplanned, compared to 17% of pregnancies for women with at least a bachelor’s degree, while Girma and Patton (Citation2015) found that education correlates negatively with fertility. In New Zealand, Cammock et al (Citation2018) found that 79% of iTaukei (an ethnicity indigenous to Fiji) women surveyed who were sexually active were not using any method of contraceptive, and that 22% women under 24 in both Fiji and New Zealand had experienced an unplanned pregnancy. ITaukei contraceptive use was lower in New Zealand than the general population. Importantly, iTaukei women were significantly more likely to be aware of family planning methods when they held tertiary qualifications compared to when they did not. Māori are similar and like Pasifika have teenage pregnancy rates higher than the national average, albeit at a declining rate (Marie et al. Citation2011).
More generally, others have found that costs (Bongarrts Citation1997) and language barriers (Mishtal Citation2010) preclude use of family planning techniques in New Zealand. Ethnic inequities in access to, and quality of, healthcare could also be contributing to differences in fertility. A study by Lawton et al (Citation2016) highlighted that health system barriers resulted in multiple missed opportunities to meet the needs of Māori teenagers for effective contraception. Māori and Pasifika communities tend to fall behind other ethnic groups in education (Craig et al. Citation2010) with lower secondary school pass rates and fewer in possession of a formal qualification compared to the general New Zealand population (Marriott and Sim Citation2014), giving credence to a theory that lack of education contributes to higher fertility rates. This view is made more plausible if one considers that Pasifika and Māori show lower contraceptive usage than the general population (Statistics New Zealand Citation2011). This again might be influenced by inequitable access to, and quality of education.
With that said, it is highly likely that the ethnic identity of Māori and Pasifika play a role in these groups’ respective fertility rates. At present we do not know how much of the higher fertility in these groups is volitional (i.e. due to more or less conscious decisions to have larger families, for example), or incidental (such as being due to lower rates of contraceptive uptake). It is also difficult to identify what exact features in Māori and Pasifika ethnicities contribute to fertility. In Polynesian cultures reproduction and sex are often considered taboo subjects (Percival et al. Citation2010), and in both pre- and post-European contact Pasifika culture has been characterised in part by communal responsibility for children, making child rearing a family-wide affair rather than the domain of the potential mother and father alone (Ritchie and Ritchie Citation1983). Research by Paterson and colleagues (Citation2004), in a study involving interviews with a large cohort of Pasifika mothers (n = 1,365) six weeks after birth, found that many of these women thought that cultural attitudes affected their reproductive decisions, including contraceptive decisions. Pasifika and Māori adults, while reportedly indulgent towards younger children compared to contemporary Western-Anglo cultures (Schoeffel and Meleisa Citation1996; Higgins and Meredith Citation2011) have also reported viewing the role of children as not simply progeny, but as active contributors to labour within the extended family unit (Schoeffel and Meleisa Citation1996). The origin of such norms may trace to agrarian societies which have higher rates of fertility compared to hunter-gatherer societies and industrial societies due to these societies’ labour demands within families (Bentley et al. Citation1993).
For Pasifika especially, high rates of religiosity (80%+ for Pasifika in New Zealand compared to around 60% of the general New Zealand population) (Statistics New Zealand Citation2007, Citation2014b) opens the possibility that religious convictions may affect fertility, either by way of a pro-natalist doctrine or by prohibition of abortion or other contraception methods. This is a possibility given higher fertility is seen to accompany religiosity elsewhere (e.g. Gellespie et al Citation2007). For instance, in the United States, Hayford and Morgan (Citation2008) found that women who rated religion as more important had higher fertility and higher intended fertility. This is made more interesting by the fact that, despite having similarly high fertility rates to Pasifika, the Māori population is dramatically less religious by comparison: in the 2013 New Zealand census, 46.3% of Māori reported ‘no-religion’, compared to 17.5% of Pasifika (Statistics New Zealand Citation2013b, Citation2014b).
Research focus
Close examination of the 2013 New Zealand census data was undertaken to advance understanding of these fertility patterns. While the focus is ultimately on Māori and Pasifika in New Zealand due to their relatively high fertility rates, fertility in Europeans and Asians as points of comparison were also examined. Applied to these New Zealand data, the research question can be formulated as: ‘With a focus on the distinctly high fertility rates of Māori and Pasifika, what factors help explain the difference in fertility rates between major New Zealand ethnicities?’. The extent that this question can be answered is limited to the items included in the 2013 New Zealand census survey, so questions about what aspects of a given culture contribute to fertility will necessarily be left unanswered. However, correlations between fertility rates and select variables can still provide insight into some of the correlates or underlying factors of fertility in these groups and can open avenues of inquiry into additional more purposive research into the ethnic forces behind fertility in Pasifika and Māori.
Materials and methods
The census data used for this project are provided by the Census of Population and Dwellings, collected on March 5th, 2013 and comprise a cross-sectional snapshot of New Zealand. The census is restricted to usual residents: n = 4,242,048 people, an estimated 97% of the actual New Zealand population. In accordance with the rules of controlled access to census datasets, all counts were randomly rounded to base 3 before any analyses were conducted. The census asked questions related to dwellings, occupation, financial status, education, family characteristics, and others (for a full breakdown of which questions were covered in the 2013 New Zealand census, see Statistics New Zealand Citation2014c). The authors were interested in fertility (i.e. number of live births), educational level, religiosity, socioeconomic status, and ethnicity. The 2013 census provides such information by asking respondents to indicate their highest held qualification, their religious affiliation, and number of children born alive (for females only). Notably, we restricted analyses to women over 34 years on all analyses in order to control for substantial age-differences between ethnic groups. Failure to do so would have severely underrepresented fertility rates for ethnic groups with younger populations, such as Pasifika and Māori (Statistics New Zealand Citation2014a, Citation2007).
Socioeconomic status is approximated using the NZDep2013 deprivation index (Atkinson et al Citation2014). This index is calculated using several items reflecting some of the dimensions of socioeconomic status, such as access to the internet, income, employment, and qualifications. For a full list of the variables used to calculate the NZDep2013, see Atkinson et al. (Citation2014). Unlike the other variables we use, the NZDep2013 is applied at the level of meshblocks, which are the smallest geographical unit used in the New Zealand census, containing a median of 81 people per meshblock in the 2013 census. For the purposes of this study, the ordinal version of the NZDep2013 was used, which ranges from 1–10 with 1 being the least deprived and 10 being the most deprived. This ordinal scale was designed so that 10% of the New Zealand population would fall into the ten available NZDep2013 scores, meaning that NZDep2013 scores as they are used in this report correspond to deciles. This index captures several of the social and economic dimensions agreed to comprise socioeconomic status, such as income, education, wealth, and access to amenities and utilities (Miner et al. Citation2015). We decided to use NZDep2013 rather than the more recent and comprehensive measure of deprivation, the Indices of Multiple Deprivation (IMD) (Exeter et al. Citation2017. Exeter and colleagues (Citation2017) explain that the advantage of IMD over the NZDep2013 is that the IMD allows researchers to pinpoint and deconstruct various indicators of deprivation. For the purposes of this study, however, we only required an aggregate deprivation score, and, combined with the fact that the IMD and NZDep2013 are highly correlated (0.924, p < .0001), we concluded that the NZDep2013 was an appropriate measure.
Education was computed as a simple 5-point rating scale: 1 (no qualification), 2 (high school diploma or equivalent), 3 (diploma or equivalent) 4 (bachelor’s degree or equivalent) 5 (postgraduate qualification). We refer to this scale simply as ‘education’. Respondents were asked to indicate which religion they followed, including an option to not respond or, alternatively, respond with ‘no-religion’. Religion was coded into broad categories (e.g. Muslim, Christian, Hindu etc.), and the coding scheme allowed for separate codes for subcategories or denominations within ethnicities (e.g. Mormon, Catholic, Seventh-Day Adventists).
There are three important considerations regarding the use of ethnicity as a variable in this study. Firstly, Pasifika, New Zealand European (hereafter, ‘European’), and Asian ethnic groups refer to a cluster of often very diverse ethnicities. Those that fall under “Pasifika”, for example, include several groups, such as Samoan, Tonga, Niuean and others. These aggregate ethnic categories are however widely used in other New Zealand census literature (e.g. Statistics New Zealand Citation2014a) and we have also used aggregated categories.
Secondly, individuals may choose to identify or not identify with a particular ethnicity or identify with several ethnicities. Around half of Māori and 40% of Pasifika identify as at least one other ethnicity (Didham and Boddington Citation2011), perhaps reflecting an interaction between Māori and non- Māori fertility patterns. Sole-ethnicity Māori have been reported to have substantially higher fertility rates than multiple-ethnicity Māori (Didham and Boddington Citation2011). With this knowledge, we decided to only include data from respondents who associated with a single ethnic group. As such, the discussion of ethnic groups reflects only sole-ethnicity individuals within each ethnic group. This focus on sole ethnicities is at odds with how ethnic groups are usually included in analyses. In statistical analyses pertaining for instance to the Māori ethnic group, Statistics New Zealand (Citation2013a) usually includes both respondents who claim Māori as their sole ethnicity and those who claim Māori as one of several ethnic identities. This decision however reflected our interest in isolating factors that are specific to ethnicities. We acknowledge that this came with limitations, as will be highlighted later in this article.
Thirdly, the net undercount for Māori and Pasifika populations should be acknowledged. Estimation of census under-coverage is always a difficult exercise and is the subject of considerable research internationally. With the introduction of the first Post-enumeration Survey (PES) to measure census coverage in 1996, Statistics New Zealand moved to population estimates based on the resident population concept, and adjusted the basic census counts for net census undercount and for residents temporarily overseas on census night. There remains a concern that the PES net census undercount adjustment may be too low due to the requirement for independence between census and the PES. In particular, coverage results from the 2013 PES showed that the net undercount for Māori (6.1 percent) and Pasifika (4.8 percent) populations, which have young age structures, was higher than for European (1.9 percent) and Asian (3.0 percent) populations (Statistics New Zealand Citation2014a). This is not a problem that can be resolved in the analyses we undertook, but should be considered in the interpretation of the findings.
Results
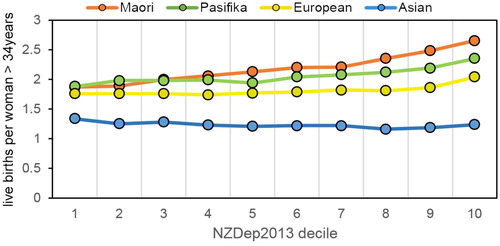
The relationship between socioeconomic status (indexed by the NZDep2013) and fertility (SESFc) was assessed using several simple analyses. Firstly, a bivariate Spearman’s rank-order correlation was performed, due to its applicability to ordinal-level variables, testing the relationship between fertility and NZDep2013 ranking. Results showed a weak but significant positive relationship (rs=.138, p < .001), indicating that as a general trend, women over 34 years old with higher NZDep2013 scores have more children. In viewing the average fertility within each NZDep2013 score by ethnic group, clear divergence can be seen between groups from lower to higher deprivation levels (see ).
Figure 1. Mean fertility rates across NZDep2013 scores, by ethnicity.
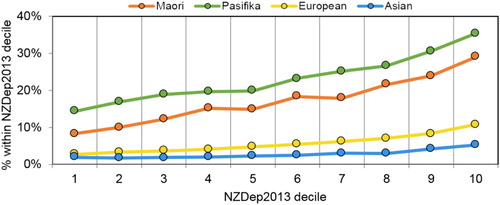
Seen from a different perspective (see ), the percentage of families with large numbers of children (five or more), differs noticeably between the Māori-Pasifika pairing and the Asian-European pairing.
Figure 2. Percentage within each ethnicity of women 34+ years with 5 or more children across the NZDep2013 deciles.
The difference between ethnic groups in terms of the SESFc can be quantified in a more objective manner using separate Spearman’s rho tests and an analysis of covariance procedure. Correlational tests were performed on a subset comprising women over 34 years old (with or without children) for Asians, Māori, Europeans, and Pasifika. Results of these tests show that the strongest coefficient (rs=.165) belonged to Māori, indicating that the relationship between deprivation and fertility was strongest for Māori, followed by Pasifika (rs=.154), Europeans (rs=.0.84), and Asians (rs=.062, all ps <.0001). Paired comparisons (Bonferroni-corrected) between these coefficients using Fisher r-to-Z transformations (Rosenthal Citation1991) indicated that the difference between each pair of these correlation coefficients was statistically significant. Thus, the SESFc can be ranked in terms of the strength of the relationship as Māori > Pasifika > European > Asian.
An analysis of covariance comparing the average fertility within each ethnicity while controlling for NZDep2013 scores was also performed. Results showed a significant omnibus group-difference, F(4, 992,469) = 11,794.1, p < .0001), and significant Bonferroni-adjusted pairwise differences between all groups: Māori (M = 3.04), Pasifika (M = 3.15), Europeans (M = 2.26), and Asians (M = 1.9). Of note, is that controlling for NZDep2013 does not alter the rank of the four ethnic groups’ mean fertility. The inclusion of a covariate reduced Pasifika and Māori mean fertility, but left Asians and Europeans almost unaltered. shows an ambiguous relationship between education and fertility, although there is a clear difference comparing those with no formal qualification to those with any kind of formal education: the highest fertility for each ethnic group in belonged to those with no formal education.
Figure 3. Average fertility for each ethnicity across 5 qualification levels for women over 34 years.

Spearman’s rho correlation tests were performed, testing the relationship between fertility and education level. Overall, the correlation between the measure of education and fertility was rs = -.16. The correlation for Māori (rs = -.101), Pasifika (rs = -.123), Europeans (rs = -.162), and Asians (rs = -.106) were weak, but statistically significant (all ps < .0001). Bonferroni-adjusted paired comparisons between the rs coefficient from each ethnicity were all statistically significant (ps < .001), with the exception of the Māori-Asian comparison (p = n.s.). In the final analysis the focus was on ascertaining the extent that the fertility difference between ethnicities are attributable to religious affiliation. Due to low numbers in some ethnicities, the analysis was limited to a comparison between census respondents who answered ‘No Religion’ and those who answered ‘Christian’ (any denomination). Moreover, this was done while accounting for factors covered in previous analyses, controlling for education (highest qualification achieved) and deprivation (NZDep2017), while also controlling for age due to the relative youth of the Māori and Pasifika ethnicities compared to Asians and Europeans.
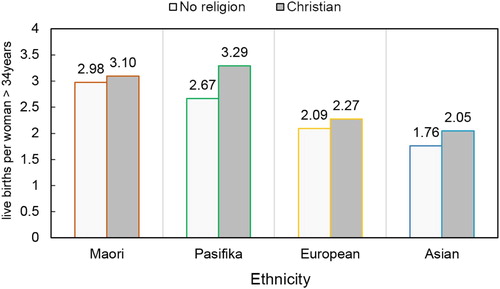
To enable this, an ANCOVA analysis was conducted with Christian/No-religion and main ethnicity as the two factors respectively. Age (in years), NZDep2013, and qualification level were entered as covariates. Results showed a significant main effect of ethnicity F(3, 72,630) = 12,036, p < .0001, Christian/No-religion, F(1, 288,884) = 14,361, p < .0001, and a significant Christian/No-religion ethnicity interaction, F(3, 660) = 108, p < .0001. All paired comparisons were statistically significant (Bonferroni-adjusted; all ps < .0001). Means are plotted in .
Figure 4. Mean fertility rates by Christian/No-religion status for each main ethnicity, controlling for age, deprivation, and highest formal qualification.
Discussion and conclusions
In previous surveys, Pasifika and Māori have consistently shown higher fertility rates compared to other major New Zealand ethnicities (Statistics New Zealand Citation2004, Citation2005). It is known that SES correlates negatively with fertility outside of New Zealand (SESFc; Jones and Tertilt Citation2008), and furthermore that, based on several measures, Pasifika and Māori have a lower SES than the general population (Statistics New Zealand Citation2013a). Similarly, education (e.g. Daniels, Daugherty, Jones & Mosher Citation2015) and religious affiliation and religiosity (E.G. Gellespie, Ahmed, Tsui & Radloff Citation2007) have separately been shown to correlate with fertility outside of New Zealand, while both Pasifika and Māori show differential rates of on both of these factors, albeit with a much more pronounced rate of religiousness in Pasifika compared to Māori. Thus, the interest was in determining how much these factors account for the divergent fertility of these two ethnic minority groups. This is not to negate the significance of socio-economic factors and inequities in shaping health outcomes. However, the focus here is on the relationship between ethnicity and fertility; the relationship between the three variables – socioeconomic status, fertility and ethnicity is a separate albeit related question.
Using NZDep2013 as a measure of SES, it was established that a SESFc does indeed exist in New Zealand across the general population of women over 34 years old. Comparing SESFc correlations calculated for individual ethnicities, it was clear that Māori had a higher SESFc than Pasifika, who scored higher than Europeans, with Asians showing the lowest coefficient. These coefficients were weak and, unsurprisingly, could not account for all inter-ethnic differences in fertility. A comparable negative correlation between education and fertility that also differed between ethnicities was shown, except in this case where Europeans showed the largest coefficient. To the authors’ knowledge, correlations between fertility and a measure of SES have not previously been demonstrated using statistical analyses with a New Zealand cohort.
The most compelling analysis, using an ANCOVA procedure, showed that even accounting for education, deprivation, age, and religious status, Pasifika and Māori still averaged around 0.4 more children than Europeans and Asians in fertility in all cases. Thus, while it is true that Pasifika and Māori scores on variables correlated with fertility deviate from the general population, these factors taken in aggregate fall short of accounting for all, or even most, of high Pasifika and Māori fertility. Moreover, the gap in fertility between Christians and ‘No-religion’ individuals was more pronounced in Pasifika compared to Māori. Given that Māori and Pasifika fertility in both religious groups had higher fertility than their European and Asian peers suggest that religious identification modulates fertility more in Pasifika and Māori, but for both groups there is a separate ethnic driver for fertility orthogonal to religion.
Amidst the complexity of these findings, we can only speculate about the ethnicity-specific factors that affect these particular ethnicities’ fertility rates. One factor might be cultural conceptions of the role of children and family. Cordoba and Ripoll (Citation2014) argued that to understand the relationship between family and income, it is crucial to consider ‘intergenerational transfers’, whereby income earned by children is passed on to parents. Cordoba argues that fertility should drop when parents cannot expect any return in the form of income from their children, and points to a drop in fertility after laws were passed in mid-nineteenth Century England barring parents’ legal right to a percentage of their children’s income. While no such laws exist that require Pasifika children to give back to their parents, there is a strong cultural obligation for such gift giving to family members. In a survey of 1,376 Pacific mothers in New Zealand, Cowley and colleagues found that 66.5% engaged in gift giving to family members (Cowley et al Citation2004), although respondents were not specific to which family members these gifts were given. Moreover, the aforementioned extended-family cohabitation of Pasifika might also be relevant, as caretaking of elderly parents in such families may be common (Perry Citation2017). Such family arrangements could incentivise prospective Pasifika parents to have more children as a bulwark against old age. Further research should be undertaken to investigate these factors.
Critics may question the use of crude average fertility rates rather than age-adjusted measures (see Mazure Citation1963). It is important to note that the only major study on ethnicity and socioeconomic status in New Zealand known to the authors also used crude fertility averages (Statistics New Zealand Citation2001), Additionally, the restriction to women over 34 on all analyses and inclusion of age as a covariate into the concluding analysis, further removes age differences between ethnicities as a major confound. A more substantive criticism is that the analyses do not capture more recent generations’ fertility trends due to being limited to 34 years and over. This is a valid criticism, although unavoidable due to the fact that measuring younger women’s fertility ought to include ‘intended fertility’ (e.g. Hayford and Morgan Citation2008), which is a variable not measured in the 2013 New Zealand census. Finally, while education and contraception use are related, the New Zealand census did not directly inquire into family planning methods and the possibility that contraception and other family planning methods underlie ethnic differences in fertility cannot consequently be ruled out. Indeed, in a relatively small sample Chesang et al. (Citation2016) found no identifiable relationship between contraceptive usage and highest educational qualification, although they excluded family-planning behaviour that did not involve overt contraceptive usage.
Further research ought to be aimed at investigating family planning methods of Pasifika and Māori more directly. However, even if there were a difference in contraceptive usage that cannot specifically be attributed to education, SES, inequitable access to education or healthcare, or religion, one would still be left without an explanation of what behavioural, cognitive, or structural factors motivate such contraceptive usage. It seems to be the case that whatever distinguishes Māori and Pasifika fertility rates from other ethnicities are, perhaps unsurprisingly, located in these groups’ respective ethnic identities. Previous research has already established that some Pasifika ethnicities regard discussion of sex and family planning as a taboo subject (Paterson, Cowley, Percival and Williams Citation2004; Percival et al. Citation2010). Any further research on the matter of fertility for these groups therefore should ask what cultural beliefs and attitudes modulate family planning methods, or indeed, what ethnic antecedents in Māori and Pasifika encourage child-bearing. Additionally, future research can take advantage of the multiple dimensions of deprivation measured in the Indices of Multiple Deprivation (Exeter et al. Citation2017). Specifically, individual indices of deprivation measured by the IMD which go beyond the aggregate NZDep2013 score, including employment and crime, can be individually tested against fertility rates and other fertility-related variables.
Acknowledgements
We acknowledge the support of Dr Barry Milne, University of Auckland, in accessing and navigating the 2013 Census Data. We appreciate the supervision of adherence to census data security protocols, and along with the other members of COMPASS, advice on the SAS code used to sort and analyse the census data. We furthermore acknowledge funding from the Heco Holdings Group which enabled access to data sets and research assistance.
Disclosure statement
No potential conflict of interest was reported by the authors.
ORCID
Christa B. Fouché http://orcid.org/0000-0002-1427-9773
Additional information
Funding
References
- Atkinson J, Salmond C, Crampton P. 2014. NZDep2013 index of deprivation. http://www.otago.ac.nz/wellington/departments/publichealth/research/hirp/otago020194.html.
- Becker G, Gregg H. 1973. On the interaction between the quantity and quality of children. Journal of Political Economy. 81(2):S279–S288. doi: 10.1086/260166
- Benatar D. 2006. Better never to have been: The harm of coming into existence. Oxford, UK: Oxford University Press.
- Bentley GR, Goldberg T, Jasienska G. 1993. The fertility of agricultural and non-agricultural traditional societies. Population Studies. 47:269–281. doi: 10.1080/0032472031000147006
- Bollen K, Glanville A, L J G. Stecklov. 2006. Socioeconomic status, permanent income, and fertility: A latent-variable approach. Population Studies. 61(1):15–34. doi:10.1080/00324720601103866.
- Bongaarts J. 1997. Trends in unwanted childbearing in the developing world. Study of Family Planning. 28(3):267–277. doi: 10.2307/2137858
- Cammock R, Priest P, Lovell S, Herbison P. 2018. Awareness and use of family planning methods among iTaukei women in Fiji and New Zealand. Australian and New Zealand Journal of Public Health. 42(4):365–371. doi:10.1111/1753-6405.12761.
- Centre for Economics and Business Research. 2014. Cost of a child hits £227,266. [Press release]. Retrieved from https://cebr.com/reports/cost-of-raising-a-child-hits-227266-with-families-feeling-the-impact-of-benefit-cuts/.
- Chesang J, Richardson A, Potter J, Sneyd MJ, Coope P. 2016. Prevalence of contraceptive use in New Zealand woman. New Zealand Medical Journal. 129(1444):58–67.
- Claus I, Kilford P, Leggett G, Wang X. 2010. Costs of raising children. http://taxpolicy.ird.govt.nz/publications/2010-dd-supporting-children/appendix-3.
- Cordoba JC, Ripoll M. 2014. Intergenerational transfers and the fertility-income relationship. The Economic Journal. 126:949–977. doi:10.1111/ecoj.12197.
- Cowley ET, Paterson J, Williams M. 2004. Traditional gift giving among pacific families in New Zealand. Journal of Family and Economic Issues. 25(3):431–444. doi:10.1023/B:JEEI.0000039949.35285.20.
- Craig E, McDonald G, Wicken A, Reddington A, Taufa S. 2010. The determinants of health for Pacific children and young people. http://www.otago.ac.nz/nzcyes/otago085988.pdf.
- Daniels, K., Daugherty, J., Jones, J., Mosher, W. 2015. Current contraceptive use and variation by selected characteristics among women aged 15-44: United States, 2011-2013. National Health Statistics Reports, 86.
- Didham R, Boddington B. 2011. Fertility, ethnic diversification and the WEIRD paradigm: recent trends in māori fertility in New Zealand. New Zealand Population Review. 37:89–104.
- Dribe M, Hacker D, Scalone F. 2014. The impact of socio-economic status on net fertility during the historical fertility decline: A comparative analysis of Canada, Iceland, Sweden, Norway, and the USA. Population Studies. 68(2), 135–149. doi: 10.1080/00324728.2014.889741
- Evenson R, Simon RW. 2005. Clarifying the relationship between parenthood and depression. Journal of Health and Social Behavior. 46:341–358. doi:10.1177/002214650504600403.
- Exeter D, Browne M, Crengle S, Lee A, Zhao J. 2017. The New Zealand indices of multiple deprivation (IMD): A new suite of indicators for social and health research in New Zealand. PLOS ONE. 12(8):e0181260. doi: 10.1371/journal.pone.0181260
- Gillespie D, Ahmed S, Tsui A, Radloff S. 2007. Unwanted fertility among the poor: an inequality? Bulletin of the World Health Organisation. 85(2):100–107. doi: 10.2471/BLT.06.033829
- Girma S, Paton D. 2015. Is education the best contraception: The case of teenage pregnancy in England. Social Science & Medicine. 131:1–9. doi:10.1016/j.socscimed.2015.02.040.
- Hansen T. 2012. Parenthood and happiness: a review of folk theories versus empirical evidence. Social Indicators Research. 108:29–64. doi:10.1007/s11205-011-9865-y.
- Hayford S, Morgan S. 2008. Religiosity and fertility in the United States: The role of fertility intensions. Social Forces. 86(3):1163–1188. doi:10.1353/sof.0.0000.
- Higgins R, Meredith P. 2011. Ngā tamariki – Māori childhoods - Traditional Māori childhoods. Retrieved from the Te Ara: The encyclopedia of New Zealand website: https://teara.govt.nz/en/nga-tamariki-Māori-childhoods/page-1.
- International Historical Statistics. 2016, October 13. http://www.palgraveconnect.com/pc/archives/ihs.html.
- Jones L E, Tertilt M. 2008. An economic history of fertility in the United States: 1826–1960. Frontiers of Family Economics. 1:165–230. doi:10.1016/S1574-0129(08)00005-7.
- Lawton B, Makowharemahihi C, Cram F, Robson B, Ngata T. 2016. E hine: access to contraception for indigenous Māori teenage mothers. Journal of Primary Health Care. 8(1):52–59. doi: 10.1071/HC15021
- Marie, D, Fergusson, DM, Boden, JM. 2011. Cultural identity and pregnancy/parenthood by age 20: evidence form a New Zealand birth cohort. Social Policy Journal of New Zealand. 37:19–36.
- Marriott L, Sim D. 2014. Indicators of Inequality for Māori and Pacific People. [Working paper 09/2014] Wellington, New Zealand: Victoria University.
- Mazur D. 1963. A demographic model for estimating Age-order specific fertility rates. Journal of the American Statistical Association. 58(303):774–788. doi:10.2307/2282725
- McLanahan S, Adams J. 1987. Parenthood and psychological well-being. Annual Review of Sociology. 13:237–257. doi:10.1146/annurev.soc.13.1.237
- Miner L, Bolding P, Hilbe J, Goldstein M, Hill T, Nisbet R, Walton N, Miner G. 2015. Practical predictive analytics and decisioning systems for medicine. San Diego, CA: Academic Press.
- Mishtal J. 2010. Neoliberal reforms and privatisation of reproductive health services in post-socialist Poland. Reproduction Health Matters. 18(36):56–66. doi: 10.1016/S0968-8080(10)36524-4
- Myrskylä M, Goldstein J, Cheng Y-hA. 2013. New cohort fertility forecasts for the developed world: rises, falls, and reversals. Population and Development Review. 39:31–56. doi:10.1111/j.1728-4457.2013.00572.x.
- Myrskyla M, Kohler H, Billari F. 2009. Advances in development reverse fertility declines. Nature. 460:741–743. doi:10.1038/nature08230.
- Nomaguchi K, Milkie M. 2003. Costs and rewards of children: The effects of becoming a parent on adult's lives. Journal of Marriage and Family. 65:356–374. doi:10.1111/j.1741-3737.2003.00356.x.
- Our World in Data. 2016. Fertility. https://ourworldindata.org/fertility/#note-1.
- Paterson J, Cowley ET, Percival T, Williams M. 2004. Pregnancy planning by mothers of pacific infants recently delivered at middlemore hospital. New Zealand Medical Journal. 117(1188):U744.
- Percival T, Robati-Mani R, Powell E, Kingi P, Peteru C, Hope L-T Rankine J. 2010. Pacific pathways to the prevention of sexual violence: Full report. Auckland New Zealand: Pacific Health, School of Population Health, University of Auckland.
- Perry B. 2017. Household incomes in New Zealand: Trends in indicators of inequality and hardship 1982 to 2015. https://www.msd.govt.nz/about-msd-and-our-work/publications-resources/monitoring/household-incomes/.
- Population Reference Bureau. 2012. World population data sheet 2012. http://www.prb.org/publications/datasheets/2012/world-population-data-sheet/fact-sheet-us-population.aspx.
- Pollmann-Schult M. 2014. Parenthood and life satisfaction: Why don't children make people happy? Journal of Marriage and Family. 76(2):319–336. doi: 10.1111/jomf.12095
- Rieder T. 2016. Towards a small family ethic: How overpopulation and climate change are affecting the morality of procreation. Baltimore, MD: Springer International Publishing. doi:10.1007/978-3-319-33871-2.
- Ritchie J, Ritchie J. 1983. Polynesian child rearing: An alternative model. Alternative Lifestyles. 5(3):126–141.
- Rosenthal R. 1991. Meta-analytic procedures for social research. Newbury Park: Sage.
- Schoeffel P, Meleisa M. 1996. Pacific Island Polynesian attitudes to child training and discipline in New Zealand: Some policy implications for social welfare and education. The New Zealand Ministry of Social Development website: https://www.msd.govt.nz/about-msd-and-our-work/publications-resources/journals-and-magazines/social-policy-journal/spj06/06-pacific-children.html.
- Statistics New Zealand. 2001. Socio-economic factors and the fertility of New Zealand women: a study of data from the New Zealand 1996 census of population dwellings. http://archive.stats.govt.nz/browse_for_stats/people_and_communities/Women/socio-economic-factors-and-fertility-of-nz-women.aspx.
- Statistics New Zealand. 2004. Fertility of New Zealand woman by ethnicity: a study of data from the New Zealand 1996 census of population dwellings. http://archive.stats.govt.nz/browse_for_stats/people_and_communities/Women/fertility-women-by-ethnicity.aspx.
- Statistics New Zealand. 2005. Ethnic population projections: issues and trends – article. http://www.stats.govt.nz/browse_for_stats/population/estimates_and_projections/ethnic-pop-projections-issues-and-trends.aspx.
- Statistics New Zealand. 2007. Quickstats about Pacific peoples: Religion. http://www.stats.govt.nz/Census/2006CensusHomePage/QuickStats/quickstats-about-a-subject/pacific-peoples/religion.aspx.
- Statistics New Zealand. 2011. Health and Pacific peoples in New Zealand. http://www.stats.govt.nz/~/media/Statistics/browse-categories/people-and-communities/pacific-peoples/pacific-prog-health/W1188289_Pacific%20Progress%20health%20report%20-Final%20to%20publish.pdf.
- Statistics New Zealand. 2013a. 2013 Census QuickStats about culture and identity - Pacific peoples. http://www.stats.govt.nz/Census/2013-census/profile-and-summary-reports/quickstats-culture-identity/pacific-peoples.aspx.
- Statistics New Zealand. 2013b. 2013 Census QuickStats about culture and identity - religious affiliation. http://archive.stats.govt.nz/Census/2013-census/profile-and-summary-reports/quickstats-culture-identity/religion.aspx.
- Statistics New Zealand. 2014a. Ethnic population projections: 2013(base) – 2038. http://www.stats.govt.nz/browse_for_stats/population/estimates_and_projections/NationalEthnicPopulationProjections_HOTP2013-38.aspx.
- Statistics New Zealand. 2014b. Religious affiliation. http://www.stats.govt.nz/Census/2013-census/profile-and-summary-reports/quickstats-culture-identity/religion.aspx.
- Statistics New Zealand. 2014c. 2013 census counted over 97 percent of population. Wellington: Statistics New Zealand.
- United States Department of Agriculture: Center for Nutrition Policy and Promotion. 2017. Families projected to spend an average of $233,610 raising a child born in 2015 [Press release]. https://www.cnpp.usda.gov/sites/default/files/expenditures_on_children_by_families/2015CRCPressRelease.pdf.
- Yoo SH, Sobotka T. 2018. Ultra-low fertility in South Korea: the role of the tempo effect. Demographic Research. 38:549–576.
- Zhao Z, Xu Q, Yuan X. 2017. Far below replacement fertility in urban China. Journal of Biosocial Science. 49(S1):S4–S19. doi:10.1017/S0021932017000347.