
ABSTRACT
Identifying with more than one ethnicity is becoming increasingly common in New Zealand. It is therefore important that the methods of categorising ethnicity used by government agencies and researchers effectively account for diverse ethnic identities. The aim of this research was to assess the impact of using different methods of categorising ethnicity on understanding outcomes in New Zealand, using Census 2013 information about tobacco smoking among the population aged 15+ years as an illustration. Prioritised, total response and single/combination categorisation methods were compared. Prioritised and total response categorisation generally produced similar prevalence estimates and patterns for smoking status, although estimates diverged somewhat for Māori ethnic groups and to a lesser extent for Pacific Peoples and Asian ethnic groups. Single/combination categorisation indicated that combination ethnic groups tend to have smoking outcomes between those of the constituent groups. Categorisation method had a considerable impact on the size of some ethnic groups. Prioritised ethnicity categorisation may be inappropriate for use by government agencies and for policy-relevant research principally concerned with children, young people, Māori or Pacific Peoples. Single/combination categorisation is useful for understanding the associations between ethnicity and outcomes, however previous work suggests this method should be used with caution.
Introduction
An increasing number of people report belonging to multiple ethnic groups in New Zealand (Statistics New Zealand [SNZ] Citation2014). This presents both theoretical and technical issues for recording and categorising ethnicity and using ethnicity in official statistics and research. This paper will focus on the three main methods of categorising ethnicity information in New Zealand; prioritised, total response and single/combination. We investigate whether the use of different categorisation methods leads to different substantive findings, and discuss the potential policy implications of this. This paper will only briefly touch on issues concerning the collection of ethnicity information and the construction and meaning of ethnicity in New Zealand. This has been discussed at length elsewhere (e.g. please see; Callister and Blakely Citation2004; Kukutai Citation2004; Didham Citation2005; Callister et al. Citation2007, Citation2009; Goodyear Citation2009; Cormack Citation2010; Cormack and Robson Citation2010).
Ethnicity measurement in New Zealand
Beginning around the 1980s, a marked shift occurred in New Zealand official statistics from using race-based categories to categories based on ethnicity to describe the New Zealand population (Cormack Citation2010). The current statistical standard recognises that ethnicity is a self-identified concept with some individuals identifying with multiple groups, and the potential for ethnic identification to change over time (SNZ Citation2017b). The current SNZ definition of ethnicity states that an ethnic group is made up of people who have some or all of the following characteristicsFootnote1:
a common proper name
one or more elements of common culture which need not be specified, but may include religion, customs or language
unique community of interests, feelings and actions
a shared sense of common origins or ancestry, and
a common geographic origin. (SNZ Citation2017b, p. 1).
Ethnicity categories are organised into a hierarchical structure with different levels of detail. Ethnicities are then aggregated together based on similar cultural and/or geographic origins (SNZ Citation2017b). The most detailed classification, Level 4, includes 233 different ethnic groups. Levels 1, 2 and 3 have 6, 21 and 36 ethnic categories respectively. Ethnicity information is typically output at either Level 1 or Level 2 in official statistics (SNZ Citation2017b). An individual is considered to have multiple ethnicities if they have more than one recorded ethnic group at the level of aggregation being used.
Categorising ethnicity
There are three main methods of categorising ethnicity information in New Zealand; prioritised, total response and single/combination. Prioritised is a method where individuals are classified into one ethnic group, in a prioritised order as follows; Māori, Pacific Peoples, Asian, Middle Eastern/Latin American/African (MELAA), Other, European (MoH Citation2017). In total response categorisation, respondents are counted once into each group that they identify with – with ethnicity treated as six separate binary variables (European: yes/no, Māori: yes/no, Pacific: yes/no, Asian: yes/no, MELAA: yes/no, and Other: yes/no) (SNZ Citation2017b). Therefore, this method produces a sum of ethnic group counts which is greater than the actual population/sample size (SNZ Citation2017b). Single/combination involves constructing mutually exclusive groups consisting of single ethnic group labels (e.g. European) and combination groups (e.g. ‘Māori/European’) and each respondent is classified into only one group (SNZ Citation2017b). There are three standard sets of ethnic categories for single/combination, comprising 8 groups, 15 groups or 45 groups.
Both the total response and the single/combination methods are currently endorsed by SNZ (SNZ Citation2017b). Prioritisation was previously used by SNZ but was discontinued following the 2004 review of ethnicity standards (SNZ Citation2017b). Despite no longer being sanctioned by SNZ, prioritisation is the most common method used by the Ministry of Health and in health research (Cormack and Robson Citation2010). Prioritisation is commonly used by schools when providing information on rolls and some programmes to the Ministry of Education (Leather Citation2009; Cormack Citation2010).
One of the main advantages of prioritised categorisation is the focus on the Māori population, as it is at the top of the prioritisation hierarchy (Cormack and Robson Citation2010). Historically, Māori have been undercounted in health statistics (Cormack and Robson Citation2010) with marked improvements in coverage and consistency across the health sector over the last decade. Prioritised categorisation does support a complete enumeration of Māori within health statistics, which reflects the importance of accurate counts for documenting inequities and enabling a Treaty of Waitangi ‘lens’ on health outcomes (Cormack and Robson Citation2010). Furthermore, prioritisation means that each respondent is classified into a single mutually exclusive group (Cormack and Robson Citation2010). A disadvantage is that respondents can be placed into a group they may not self-identify into if they were asked to report a single ethnic group (Leather Citation2009; Cormack and Robson Citation2010) or if they ranked their identified ethnic groups (SNZ Citation2004). Furthermore, prioritisation undercounts non-Māori ethnic groups (SNZ Citation2004; SNZ Citation2006; Leather Citation2009; Cormack and Robson Citation2010). This undercount may generate an age-related bias, as the reporting of multiple ethnic groups is more common in younger age groups (Teng et al. Citation2017).
The total response method captures up to six ethnic groups for each respondent, utilising more information about respondent’s ethnic identity than prioritisation (Cormack and Robson Citation2010). This also means it does not lead to undercounting of ethnic categories lower on the prioritisation hierarchy (Cormack Citation2010). However, total response categorisation makes analyses more difficult as groups are not mutually exclusive (Cormack and Robson Citation2010) and data are stored as 6 binary variables. There is no information provided on how to use total response categorisation appropriately in statistical modelling by SNZ, and so prioritisation continues to be the favoured method for regression models (MoH Citation2008, Citation2017).
An advantage of the single/combination method is that it allows a more nuanced depiction of the overlap between ethnic groups. Different characteristics and outcomes associated with combination ethnic groups (such as ‘Māori/Pacific Peoples’) and single ethnic groups (such as ‘Pacific Peoples only’) may be missed with other methods (Didham Citation2005). This method also produces mutually exclusive groups, making it straightforward to use in statistical models (Didham Citation2005; Cormack and Robson Citation2010). However, there are a large number of possible combinations of ethnicity, and some will have very small numbers (Didham Citation2005; Cormack and Robson Citation2010), therefore this method is not appropriate for smaller datasets (Didham Citation2005). SNZ define three sets of single/combination classifications: an 8, 15 and 45 group schema. However, some standard categories in the 8-group and 15-group classification schemes are uninformative (e.g. two groups not elsewhere defined) (Didham Citation2005).
When using the single/combination method, there is a risk that users interpret the count or rate for single ethnic groups (such as ‘Pacific Peoples only’) as the count or rate for the overall ethnic group (which would include combination groups such as ‘Pacific Peoples/European’) (Cormack and Robson Citation2010). SNZ protocols state that total response counts must be included alongside single/combination output to mitigate this issue (SNZ Citation2017b).
The categorisation method used is important for understanding the ethnic composition of New Zealand. Ensuring appropriate counts is crucial for young people, Māori and Pacific Peoples as these people more likely to identify with multiple ethnicities and are therefore more affected by the method of categorising ethnicity used (Carter et al. Citation2009; Kukutai and Callister Citation2009).
The extent to which choice of ethnicity categorisation method influences associations between ethnicity and outcomes is unclear. It is well-established that ethnicity is strongly related to health outcomes in New Zealand. However, there is limited research investigating how the method of categorising ethnicity affects the interpretation of the relationship between ethnicity and health. To our knowledge, only one study has compared total response and prioritised ethnicity. Using different outcomes from the 2002/2003 New Zealand Health Survey (MoH Citation2008), that study found little difference in the rate ratios between respective ethnic groups when total response or prioritisation categorisation was used.
This manuscript examines how the three different ethnic categorisation methods affect the estimation of ethnic inequalities in smoking rates. Tobacco use is one of the major causes of preventable health loss in New Zealand, accounting for around 8.7% of health loss as measured in disability adjusted life years (MoH Citation2016). There are large disparities in smoking rates by age and across ethnic groups, with Māori and Pacific Peoples experiencing much higher smoking rates than other ethnic groups (SNZ Citation2017a). The New Zealand government has adopted an aspirational goal of becoming smokefree by 2025 (Ikeda et al. Citation2015).
Materials and methods
Measures
The 2013 Census data on 3,375,419 usually-resident people over the age of 15 were analysed. The data were accessed through the SNZ Integrated Data Infrastructure (IDI) environment. The IDI is a secure data environment containing anonymised individual level linked survey and administrative data from a range of agencies which is accessible for research purposes subject to the prior approval of the Government Statistician (Milne et al. Citation2019). This research took place within the scope of a larger study developing the Index of Multiple Deprivation (IMD). The IMD project was given ethical approval by the Chairperson of the Northern X Regional Ethics Committee on 24 August 2011, with ongoing approval granted by the New Zealand Health and Disability Ethics Committees (Ref: NTX/11/EXP/190).
Ethnicity
Ethnicity was identified using the source-ranked ethnicity table. The source-ranked ethnicity table records the ethnicity of linked respondents across multiple official datasets (Teng et al. Citation2017). Sources of ethnicity data are ranked according to data quality as assessed by agreement with the Census (Teng et al. Citation2017). Each record contains total response ethnicity data at Level 1 from the highest ranked source for which this is available (Teng et al. Citation2017). The top three ranked sources of ethnicity data are the Census, births data and then data from the Ministry of Health (Teng et al. Citation2017). The sources of ethnicity data are detailed in . There were 169,533 respondents (5.0%) missing data for ethnicity in our analyses.
Table 1. Sources of ethnicity data.
The source-ranked ethnicity table was used to construct each of the ethnicity variables. Total response ethnicity was included in the models as the set of six binary variables. Prioritised ethnicity was constructed using the following ethnic group prioritisation; Māori, Pacific Peoples, Asian, MELAA, Other and European, consistent with the Ministry of Health data protocols (MoH Citation2017). Single/combination was constructed using the standard 15-group single/combination classification as detailed in the statistical standard for ethnicity (SNZ Citation2017b). This includes the following ethnic groups; ‘European only’, ‘Māori only’, ‘Pacific Peoples only’, ‘Asian only’, ‘MELAA only’, ‘Other ethnicity only’, ‘two groups not elsewhere includedFootnote2’, ‘three groups not elsewhere included’, ‘four to six groups’, ‘Māori/European’, ‘Pacific Peoples/European’, ‘Asian/European’, ‘Māori/Pacific Peoples’, ‘Māori/Pacific Peoples/European’ and ‘not elsewhere included’ (SNZ Citation2017b). The ‘not elsewhere included’ group was not applicable in this case, and hence there were only 14 groups in the analysis.
Smoking
Smoking status was derived from two questions in the Census.310,593 respondents (9.2%) were missing information on smoking status. Regular smoking is defined as smoking at least one cigarette per day. Smoking status comprised the following levels; regular smoker, ex-smoker and never smoked.
Index of Multiple Deprivation
The New Zealand Index of Multiple Deprivation (IMD) is a measure of area deprivation (Exeter et al. Citation2017). The index uses administrative and Census data to produce area deprivation scores for data zones using measures across 7 domains. Importantly, area deprivation is strongly related to ethnicity in New Zealand (Salmond and Crampton Citation2012). Therefore, it is necessary to control for area deprivation when examining the associations between ethnicity and smoking. 283,563 respondents (8.4%) were missing data on their usual residence at Census night, and we were unable to link area deprivation information for these individuals.
Age
Age was recorded as age in years on Census night. No respondents were missing data for age.
Gender
Gender was measured in the Census as a binary (male/female) variable and was included in the analysis as such. No respondents were missing data for gender.
Analysis
Data were analysed using Stata Version 14 (StataCorp Citation2015). The counts for each ethnic group were compared across prioritised, total response and single/combination methods. For each method of categorising ethnicity, we examined the age structures, deprivation gradients and the prevalence of each smoking outcome for each ethnic group.
Three multinomial logistic regression models were used to examine the relationship between ethnicity and smoking status (Kwak and Clayton-Matthews Citation2002), with a separate model used for each method of categorising ethnicity; prioritised, total response and single/combinations. Average adjusted predicted probabilities were estimated using marginal standardisation, using the margins command in Stata. This method is appropriate for making inferences to the overall population (Muller and MacLehose Citation2014).
Age, gender and IMD were included in all models as potential confounders. The first set of models included age bands, IMD deciles and gender as main effects. Age and IMD were then tested as continuous variables. Various higher order polynomials for age and/or IMD were then examined. We next tested every two-way interaction between age, IMD and ethnicity. Lastly, we included a three-way interaction between age, IMD and ethnicity. As is standard practice, all two-way interactions and main effects were included in these models. Age and IMD were standardised (to have a mean of 0 and a standard deviation of 1) to reduce multicollinearity (Robinson and Schumacker Citation2009). The model with the three-way interaction was selected as the best fitting model.
Results
Ethnicity counts
Overall, 7.3% of respondents identified with more than one ethnic group. The distribution of individuals across different ethnicity categorisation methods is shown in . The number of respondents classified as Māori will always be equal under total response and prioritisation methods. The single/combination ‘Māori only’ ethnic group (n = 208,404) was just over half the size of the Māori ethnic group under prioritisation and total response (n = 398,661). The ‘Māori/European’ combination group was the second largest Māori group (n = 163,896) followed by ‘Māori/Pacific Peoples’ (n = 10,323) and ‘Māori/Pacific Peoples/European’ (n = 8,823).
Table 2. Comparison of ethnic group counts, mean age, mean IMD and smoking outcomes for each ethnic group under the three methods of categorising ethnicity.
The ‘Pacific Peoples only’ ethnic group (n = 144,573) was 24.6% smaller than the Pacific Peoples group under total response (n = 191,625) and 15.6% smaller than the Pacific Peoples group under prioritisation (n = 171,222). The ‘Asian only’ ethnic group (n = 356,547) was 5.3% smaller than the total response Asian ethnic group (n = 376,395). ‘MELAA only’ (n = 32,049) and ‘Other only’ (n = 48,009) were respectively 14.3% and 13.2% smaller than MELAA (n = 37,404) and Other (n = 55,284) ethnic groups under total response.
demonstrates the percentage of the total response ethnic group that would be classified into a different ethnicity under the prioritisation method. The relative differences between ethnic groups under prioritised and total response categorisation were largest for Pacific Peoples at 10.6% followed by Europeans at 9.1%. This means 10.6% of the sample that self-identified as Pacific Peoples would be classified as Māori using prioritisation methods (because they self-identified as both Pacific Peoples and Māori), and 9.1% of the sample who self-identified as European would be classified as Māori (7.4%), Pacific Peoples (1.0%), Asian (0.4%), MELAA (0.2%) or Other (0.2%). The percentage differences between prioritised and total response for other ethnic groups were less substantial; 2.5% for Asians, 4.3% for MELAA and 5.3% for Other.
Table 3. Comparison of total response and prioritised ethnicity showing the allocation of respondents under total response into prioritised ethnic groups.
Distribution of age, deprivation and smoking status by ethnicity categorisation method
The age structures of ethnic groups were similar for prioritised and total response categorisation (see and Appendix 1). The only notable exception was the Pacific Peoples ethnic group which had a younger age structure under total response than under prioritised categorisation. Combination ethnic groups were younger on average than single ethnic groups and the constituent ethnic groups under the other methods. For example, the ‘Māori/Pacific Peoples’ ethnic group (mean age = 36.1) was younger on average than the ‘Māori only’ ethnic group (mean age = 41.9) and the Pacific Peoples ethnic group (mean age = 39.2).
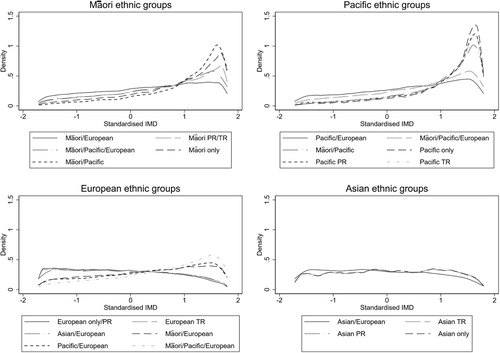
The proportion of people falling into each IMD decile was similar for prioritised and total response categorisation (see and Appendix 2). Combination ethnic groups made up of known ethnic groups fall somewhere between their respective ethnic groups.
Smoking status varied across ethnic groups as shown in . Regular smoking was highest for Māori ethnic groups. Differences in the proportion of respondents falling into each smoking status were negligible for prioritised and total response categorisation (most percentage point differences were < 1%). For combination ethnic groups the proportion of regular smokers, ex-smokers and never smokers tended to fall somewhere between the proportion for each of the respective ethnic groups. Single ethnic groups were generally similar to the respective ethnic group under prioritised or total response categorisation, except for the ‘Māori only’ ethnic group which had far higher rates of regular smoking and lower rates of never-smokers.
Adjusted smoking prevalence estimates across categorisation methods
As shown in , there was generally little difference between the prioritised (model a) and total response (model b) models. The largest differences were observed for the Māori ethnic group with the total response model estimating the adjusted regular smoking prevalence rate at 3.3 percentage points lower (prioritised = 26.7%, total response = 23.4%) and the adjusted never smoked prevalence rate at 2.6 percentage points higher (prioritised = 44.9%, total response = 47.5%) than the prioritised model. There were also notable differences for the Pacific Peoples and Asian ethnic groups (e.g. > 2 percentage points). Generally, the smallest differences were observed for the European ethnic groups.
Table 4. Adjusted prevalence estimates for each smoking outcome using each method of categorising ethnicity.
The regular smoker prevalence estimate for the ‘Māori only’ ethnic group (model c) was 4.8 percentage points higher than the Māori ethnic group for the prioritised model (model a) and 8.1 percentage points higher than the Māori ethnic group for the total response model (model b) (prioritised = 26.7%, total response = 23.4%, Māori only = 31.5%). The never smoked prevalence estimate for this group was 3.7 percentage points lower than the Māori ethnic group for the prioritised model (model a) and 6.3 percentage points lower than the Māori ethnic group for the total response model (model b) (prioritised = 44.9%, total response = 47.5%, Māori only = 41.2%).
The ‘Pacific Peoples only’ ethnic group (model c) also had notable differences to the Pacific Peoples ethnic groups under the other methods (models a and b). Most notably, the ex-smoker prevalence estimate for the ‘Pacific Peoples only’ ethnic group (model c) was 4.6 percentage points lower than the Pacific Peoples ethnic group using the total response method (model b) (total response = 21.0%, Pacific Peoples only = 16.4%). Across all ethnic groups within the single/combination categorisation (model c), there was a particularly large gap between the single ethnic group estimates and the total response model (model b) estimates.
Three-way interactions between standardised age, standardised IMD and ethnicity were significant for all models (all p-values < 0.001). This indicates that the relationship between ethnicity and smoking is moderated by age and levels of area deprivation. The relationships between age and ethnicity and IMD and ethnicity on smoking outcomes were similar for prioritised and total response categorisation. Combination ethnic groups tended to show patterns somewhere between their respective single ethnic groups. Model fit statistics for unadjusted and adjusted models are presented in Appendix 3.
Missing data
As detailed in Appendix 4, 417,774 respondents (12.4%) were missing data on one or more variable. Respondents missing data on one variable tended to be missing data on other variables. Different ethnic groups were missing smoking data at different rates. A sensitivity analysis was conducted by assuming those missing smoking data were twice as likely to be regular smokers. This indicated that missing smoking data likely depreciated regular smoking rates more for Māori and Pacific Peoples ethnic groups than other ethnic groups but did not substantially change smoking patterns by ethnicity. Only respondents with complete information on all variables of interest (n = 2,958,645) were included in the multinomial and logistic regression models.
Discussion
The aim of this research was to examine whether the use of different methods of categorising ethnicity affects the interpretation of ethnic inequalities in smoking behaviour. There were notable differences between ethnic groups regarding smoking status for all ethnic categorisation methods. Prioritised and total response categorisation produced largely similar results. Single/combination categorisation revealed more nuanced relationships between smoking and ethnicity. Importantly, the ‘Māori only’ ethnic group had considerably worse smoking outcomes than the Māori ethnic groups using prioritisation or total response. Combination ethnic groups tended to have prevalence estimates which were somewhere between their respective constituent ethnic groups.
While results using prioritised and total response categorisation were largely consistent, there were some discrepancies. The largest difference was in the prevalence estimates for the never smoked and regular smoking outcome for the Māori ethnic group. The adjusted total response model produced a higher estimated prevalence of never smokers and a lower estimated prevalence of regular smokers. Given the Māori ethnic groups comprise exactly the same respondents under both categorisation methods, this appears counter-intuitive. However, the correlation between ethnic group memberships is adjusted for when modelling total response categorisation and including all binary variables in the model. Given the proportion of respondents with multiple ethnicities is highest among Māori, we would expect the estimates for this group to change the most. There were also notable differences for the adjusted prevalence estimates for Pacific Peoples and Asian ethnic groups.
We show that combination ethnic groups have outcomes which are often between those of their constituent ethnic group, a pattern which was evident for both smoking outcomes and area deprivation. Previous research has found that this pattern holds across some ethnic groups in other contexts including health, demographics and education (Callister and Blakely Citation2004; Kukutai Citation2004).
Callister et al. (Citation2007) suggested that using complex ethnicity data to allocate health resources may help reduce inequities. The Population Based Funding Formula determines the division of funding between district health boards and is based on actual expenditure with various adjustments (Penno et al. Citation2012). This formula contains an adjustment for unmet health need for those living in particularly deprived areas as well as Māori and/or Pacific Peoples on the basis that these ethnic groups have health needs which are not met by actual service use (Penno et al. Citation2012). Results from this study suggest the unmet need adjustor could be modified using single/combination ethnic groups to more effectively adjust for unmet need without altering overall spending. For example, a higher amount could be allocated on behalf of every person belonging to the following ethnic groups; ‘Māori only’, ‘Pacific Peoples only’, and ‘Māori/Pacific Peoples’, and less could be allocated to Māori and Pacific Peoples who belong to other combination ethnic groups.
Kukutai (Citation2004) suggests that identification with a minority ethnicity may relate to disadvantage through two key mechanisms; expectations and obligations within ethnic communities, and of greater interest here, through discrimination in the labour market and in accessing networks which provide health and social resources. Those with multiple ethnicities who identify more strongly with a disadvantaged ethnic group may be more likely to face discrimination and be excluded from mainstream advantages, and consequently have worse outcomes, than those with less strong identification with disadvantaged ethnic groups (Kukutai Citation2004). Therefore programmes to address Māori disadvantage should be oriented towards those with stronger Māori identities, as these people tend to have the worst outcomes (Kukutai Citation2004).
Notably, Kukutai (Citation2004) cautions against the using concepts of combination versus sole Māori ethnicity to determine access to programmes and interventions, arguing that this dichotomy is crude. She suggests capturing individuals’ ‘main’ ethnicity as this provides a better indication of outcomes (Kukutai Citation2004). However, as she and others note (e.g. Kukutai and Callister Citation2009) not all people can identify a main ethnicity. Additionally, ethnic identification is contextual and people may change their ethnic identification throughout their lives and in response to social or political shifts (Didham Citation2016).
Ethnicity, as defined by any of the categorisation methods described here, may not be the most appropriate way to capture Māori identity. Ethnicity is not the traditional foundation of Māori identity, which is based on whakapapa or geneology. The United Nations Declaration on the Rights of Indigeneous Peoples guarantees the right for Māori to determine their own membership and identity (United Nations Citation2007). All Māori are owed special protections in New Zealand under the Treaty of Waitangi. To be consistent with a rights-based approach to health, counting all Māori is important (Cormack and Robson Citation2010). Māori ancestry as well as self-identification as Māori can be used to capture Māori who do not self-identify as Māori in response to social surveys, as has been done in Te Kupenga.
Limitations and suggestions for future research
We acknowledge that there are other methods of identifying group membership, such as Māori descent, and that ethnicity is not the traditional Māori foundation of identity, However, we specifically set out to test the three methods of categorising ethnicity endorsed, or previously endorsed, by SNZ; prioritised, total response and single/combination. Given the importance of recognising and counting all Māori in research, especially research used to inform social policies, this is an area which warrants further investigation.
While this analysis included large numbers for ethnic groups and combination ethnic groups, only those with complete data were included in the adjusted analyses. Furthermore, while we went to great lengths to obtain the best fitting models, the residual plots suggest model fit was not ideal. However, the results from the adjusted regression models and the descriptive analysis are consistent, and there were no issues with influential data points, as indicated by Cooks distance and leverage
We focused on the adult resident population in 2013 and smoking rates. Further research is needed to investigate the effects that categorisation methods have on the estimation of outcomes for different populations, particularly children and young people. Qualitative research is needed to understand how people with multiple ethnicities understand their ethnic identities.
Conclusion
The method of categorising ethnicity is a policy choice which endorses different understandings of ethnic affiliation. There are important theoretical considerations for government agencies in choosing categorisation methods. Empirically, there is some suggestion that the ethnicity categorisation method used affects the interpretation of outcomes, with particularly notable differences for single/combination categorisation when compared to prioritisation and total response. Children, young people, Māori and Pacific Peoples are the most impacted by the method of categorisation used. Notably, single/combination categorisation revealed important patterns in smoking and other measures which were masked by prioritisation and total response.
Acknowledgements
We would like to thank Statistics New Zealand for providing access to these data and Statistics New Zealand staff for their assistance throughout the project. This work was conducted as part of a Masters of Public Policy run by the Public Policy Institute at the University of Auckland. This research took place as part of a larger project which received funding from the Health Research Council, grant reference 13/428.
Statistics New Zealand disclaimer: The results in this paper are not official statistics. They have been created for research purposes from the Integrated Data Infrastructure (IDI), managed by Statistics New Zealand. The opinions, findings, recommendations, and conclusions expressed in this paper are those of the author(s), not Statistics NZ, or The University of Auckland. Access to the anonymised data used in this study was provided by Statistics NZ under the security and confidentiality provisions of the Statistics Act 1975. Only people authorised by the Statistics Act 1975 are allowed to see data about a particular person, household, business, or organisation, and the results in this paper have been confidentialised to protect these groups from identification and to keep their data safe.
Disclosure statement
No potential conflict of interest was reported by the authors.
ORCID
Natalia Boven http://orcid.org/0000-0002-9911-2082
Daniel Exeter http://orcid.org/0000-0003-1061-5925
Andrew Sporle http://orcid.org/0000-0003-1620-473X
Nichola Shackleton http://orcid.org/0000-0001-5570-3617
Additional information
Funding
Notes
1 According to SNZ (Citation2017b) this definition of ethnicity was constructed from the work by Smith (1986).
2 Not elsewhere included is referred to as not elsewhere defined (NED) throughout this paper.
References
- Callister P, Blakely T. 2004. Ethnic classification, intermarriage, and mortality: some methodological issues in relation to ethnic comparisons in Aotearoa/New Zealand. Wellington: School of Medicine and Health Science, University of Otago.
- Callister P, Didham R, Kivi A. 2009. Who are we? The conceptualisation and expression of ethnicity, Official Statistics Research Series 4. Wellington: Statistics New Zealand.
- Callister P, Didham R, Potter D. 2007. Measuring ethnicity in New Zealand: developing tools for health outcome analysis. Ethnicity & Health. 12(4):299–320. doi: 10.1080/13557850701300699
- Carter KN, Hayward M, Blakely T, Shaw C. 2009. How much and for whom does self-identified ethnicity change over time in New Zealand? Results from a longitudinal study. Social Policy Journal of New Zealand. 36:32–45.
- Cormack D. 2010. The politics and practices of counting: ethnicity in official statistics in Aotearoa/New Zealand. Wellington: Te Rōpū Rangahau Hauora a Eru Pōmare.
- Cormack D, Robson C. 2010. Classification and output of multiple ethnicities: considerations for monitoring Māori health. Wellington: Te Rōpū Rangahau Hauora a Eru Pōmare.
- Didham R. 2005. Understanding and working with ethnicity data. Wellington: Statistics New Zealand.
- Didham R. 2016. Ethnic mobility in the New Zealand Census, 1981–2013: a preliminary look. New Zealand Population Review. 42:27–42.
- Exeter DJ, Zhao J, Crengle S, Lee A, Browne M. 2017. The New Zealand Indices of Multiple Deprivation (IMD): a new suite of indicators for social and health research in Aotearoa, New Zealand. PLoS ONE. 12(8):e0181260. doi: 10.1371/journal.pone.0181260
- Goodyear RK. 2009. The differences within, diversity in age structure between and within ethnic groups. Wellington: Statistics New Zealand.
- Ikeda T, Cobiac L, Wilson N, Carter K, Blakely T. 2015. What will it take to get to under 5% smoking prevalence by 2025? Modelling in a country with a smokefree goal. Tobacco Control. 24(2):139–145. doi: 10.1136/tobaccocontrol-2013-051196
- Kukutai T. 2004. The problem of defining an ethnic group for public policy: who is Māori and why does it matter. Social Policy Journal of New Zealand. 23:86–108.
- Kukutai T, Callister P. 2009. A “main” ethnic group? Ethnic self-prioritisation among New Zealand youth. Social Policy Journal of New Zealand. 36:16–31.
- Kwak C, Clayton-Matthews A. 2002. Multinomial logistic regression. Nursing Research. 51(6):404–410. doi: 10.1097/00006199-200211000-00009
- Leather F. 2009. Prioritising ethnic data from schools: who are we missing? A research note. Social Policy Journal of New Zealand. 36:16–31.
- Milne BJ, Atkinson J, Blakely T, Day H, Douwes J, Gibb S, Nicolson M, Shackleton N, Sporle A, Teng A. 2019. Data resource profile: the New Zealand Integrated Data Infrastructure (IDI). International Journal of Epidemiology. 48(3):1–6. doi: 10.1093/ije/dyz014
- [MoH] Ministry of Health. 2008. Presenting ethnicity: comparing prioritised and total response ethnicity in descriptive analyses of New Zealand Health Monitor Surveys. Wellington: Ministry of Health.
- [MoH] Ministry of Health. 2016. Health loss in New Zealand 1990–2013: a report from the New Zealand Burden of Diseases, Injuries and Risk Factors Study. Wellington: Ministry of Health.
- [MoH] Ministry of Health. 2017. HISO 10001:2017 Ethnicity Data Protocols. Wellington: Ministry of Health.
- Muller CJ, MacLehose RF. 2014. Estimating predicted probabilities from logistic regression: different methods correspond to different target populations. International Journal of Epidemiology. 43(3):962–970. doi: 10.1093/ije/dyu029
- Penno E, Audas R, Gauld R. 2012. The state of the art? An analysis of New Zealand's Population-based Funding Formula for health services: technical report. Dunedin: Centre for Health Systems University of Otago.
- Reid G, Bycroft C, Gleisner F. 2016. Comparison of ethnicity information in administrative data and the census. Wellington: Statistics New Zealand.
- Robinson C, Schumacker RE. 2009. Interaction effects: centering, variance inflation factor, and interpretation issues. Multiple Linear Regression Viewpoints. 35(1):6–11.
- Salmond CE, Crampton P. 2012. Development of New Zealand's deprivation index (NZDep) and its uptake as a national policy tool. Canadian Journal of Public Health. 103(Suppl. 2):7–11.
- [SNZ] Statistics New Zealand. 2004. Report of the review of the measurement of ethnicity. Wellington: Statistics New Zealand.
- [SNZ] Statistics New Zealand. 2006. Impact of prioritisation of the interpretation of ethnicity data. Wellington: Statistics New Zealand.
- [SNZ] Statistics New Zealand. 2014. 2013 Census QuickStats about culture and identity. Wellington: Statistics New Zealand.
- [SNZ] Statistics New Zealand. 2017a. New Zealand social indicators: tobacco smoking. http://archive.stats.govt.nz/browse_for_stats/snapshots-of-nz/nz-social-indicators/Home/Health/tobacco-smoking.aspx.
- [SNZ] Statistics New Zealand. 2017b. Statistical standard for ethnicity (V2.0). Wellington: Statistics New Zealand.
- StataCorp. 2015. Stata statistical software. Release 14. College Station, TX: StataCorp LP.
- Teng A, Gibb S, Sporle A. 2017. Ethnicity and the IDI. Virtual Health Information Network; [updated 2019 Mar 7; accessed 2019 May 5]. https://vhin.co.nz/guides/ethnicity-and-the-idi/.
- United Nations. 2007. United Nations Declaration on the Rights of Indigenous Peoples. https://www.un.org/development/desa/indigenouspeoples/declaration-on-the-rights-of-indigenous-peoples.html.
Appendices
Figure A1. Kernel density curves for the age structures for Māori, Pacific Peoples, European and Asian ethnic groups under different ethnic categorisation methods.
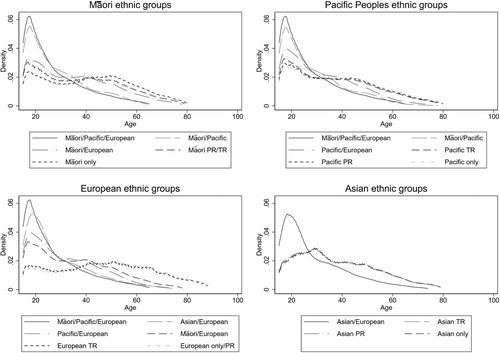
Figure A2. Kernel density curves for the distribution of standardised IMD for Māori, Pacific Peoples, European and Asian ethnic groups under different ethnic categorisation methods.
Appendix A3. Model fit
A series of models were examined to improve model fit across the three categorisation methods. The final adjusted models included two-way interactions between ethnicity and age, ethnicity and IMD and age and IMD, and a three-way interaction between ethnicity, age and IMD. The addition of the interaction terms improved the appearance of the residuals. Many of the two-way interactions (ethnicity*age ethnicity*IMD and age*IMD) were significant at the 5% level across models. The three-way interactions between standardised age, standardised IMD and ethnicity were examined using a Wald test for each model, which was significant for all models (all p-values < 0.001).
The model fit statistics indicate that the adjusted models fit substantially better than the unadjusted models. Robust standard errors were used in all models due to heterogeneity of variance evident in residual plots even after the inclusion of the interaction terms.