
ABSTRACT
The aims of this study were to compare the NZ Indices of Multiple Deprivation (IMD) with the NZDep index of socioeconomic deprivation in terms of their: (1) theoretical and methodological approaches; (2) use of small areas; (3) rankings of small areas; and (4) relationships with various health and social outcomes. Literature sources were reviewed for aim 1. The data sources for aims 2–4, all contained within Statistics New Zealand’s Integrated Data Infrastructure, were: (1) 2013 Census, (2) health data sets, (3) Police database, and (4) 2014 General Social Survey. Outcomes were smoking, mortality, respiratory disease, crime, self-assessed health status. Spearman’s rho was used as a measure of correlation. Deciles were treated as categorical in the stepwise logistic regressions. The key finding is that there is a range of theoretical and methodological differences between the indexes. Despite these differences, the indexes behave in a similar, but not identical, manner in their ranking of small areas and in their associations with health and social outcomes. In conclusion, for practical purposes for many applications the two indexes give similar results when analysing very large data sets, although there are some important caveats related to this conclusion for both large and small data sets.
Introduction
Small area-based indexes of socioeconomic deprivation have been widely used in different countries for over thirty years. The first such index to be used in New Zealand was Reinken et al.’s (Citation1985) Health and Equity index published in 1985. This was followed by five versions of the NZDep index based on five-yearly national censuses – 1991, 1996, 2001, 2006, 2013 (late because of a major earthquake). The 2018 version is pending. Since the mid-1990s NZDep has been widely used in resource allocation formulas, in research and for community advocacy (Salmond and Crampton Citation2012a, Citation2012b).
Approaches to developing area-based indexes of socioeconomic deprivation have developed over time, partly as a result of the availability of new data sources and partly as a result of new theorisations of the underlying concepts and methodological innovations. As noted by the OECD (Citation2008, p. 22) in giving advice for constructing composite indicators, ‘what is badly defined is likely to be badly measured … a sound theoretical framework is the starting point in constructing composite indicators’. The underlying theory and biases of deprivation indexes have been highlighted in sociological critiques (Fu et al. Citation2015b, Citation2015a). The extent to which the newer indexes address these potential problems requires further exploration.
Recently two new indexes of socioeconomic deprivation have been created in New Zealand. The first of these, the New Zealand Indices of Multiple Deprivation (IMD) – based on the UK Index of Multiple Deprivation (Niggebrugge et al. Citation2005; Noble et al. Citation2006) – was published by Exeter et al. (Citation2017). The second was the Dynamic Deprivation Index published by Ward et al. (Citation2019), which will be the subject of a future comparative study.
The current study focuses on a methodological and empirical comparison of the IMD and NZDep indexes in order to understand differences between the two and to guide potential users of the two indexes in the various contexts that the indexes might be used – resource allocation, planning and policy, research, advocacy, and so on. While previous work has compared IMD and NZDep in the context of childhood obesity (Exeter et al. Citation2019), the purpose of the current study is to provide a more comprehensive and in-depth comparison of the two indexes.
The aims of this study were to: (1) compare the theoretical and methodological bases for the two indexes, (2) compare NZDep2013 small areas and IMD data zones, (3) compare NZDep2013 and IMD in their rankings of all small areas in New Zealand, and (4) compare NZDep2013 and IMD in terms of their relationships with various health and social outcomes.
Materials and methods
Most analyses were carried out in the privacy- and security-protected environment of the Statistics New Zealand Data Laboratory (see Disclaimer statement at end).
Aim 1: The comparison of the theoretical and methodological bases for the two indexes was carried out by reviewing literature sources.
Aims 2 and 3: IMD uses data centred on 2013, therefore NZDep2013 (based on 2013 Census data) was used as a basis for comparison. NZDep is reported at the meshblock (MB) level, but it is calculated at an index-specific small area level (composed of one or more meshblocks), and therefore that small area level was the comparison used for these two aims. Index deciles are calculated from data at the small area (for NZDep) or data zone (for IMD) unit of analysis (both described later), so the correlations ought to be produced using a data set that has one observation for each small area (since there are more NZDep small areas than IMD data zones). However, there was an overlap of just over one-fifth of NZDep small areas (21.3%) across several data zones. Four possible solutions were explored:
Restrict the analyses to those small areas that are completely contained within a data zone.
Analyse the whole ‘overlapping’ group (21.3%), to see if the resulting correlations are similar to those from option (1).
Use meshblocks as the unit of analysis.
Use people as the unit of analysis, noting that larger small areas (in terms of population) have greater weight in the correlation. Following exploration, this approach was used. It has face validity because, in applications, modelling is generally carried out with people as the unit of analysis.
Aim 4: Spearman’s rho was used as a measure of correlation between the two deprivation indexes, each of which is scored in deciles from 1 (least deprived) to 10 (most deprived).
The practical performance of the two indexes was explored using logistic regressions to model 10 outcomes, each coded as yes or no, with individuals as the unit of analysis. The 10 outcomes were self-rated health, smoking, all-cause mortality (all ages and <75 years), avoidable mortality (<75 years) (see Page (Citation2006) for definition), respiratory disease (hospital discharge primary diagnosis; hospital discharge any diagnosis; mortality), and crime (victims of; offenders). Variable definitions, time periods, age ranges and data sources are shown in .
Table 1. Data definitions and sources.
The indexes were entered as dummy variables, with decile 1 as the reference category, so that we did not impose a linear relationship (which is not likely, given previous work). We also included age, in six groups (or five for outcomes with age-restrictions as shown in ), and sex, as dummy-variable potential confounders in our models in order to mimic what is likely to be done in practice by researchers and those developing funding formulas. The regressions were designed solely to compare the performance of the two indexes, not to find some ‘best’ set of explanatory variables for each outcome. The logistic regressions were carried out stepwise, in order to see whether the NZDep2013 index or an appropriate IMD index provided a better model fit to the data, after including age group and sex. The explanatory power of each index was measured by the proportional improvement of the log-likelihood ratio (L) statistic, −2LogL. This can be interpreted as the proportion of overall variance in the outcome explained by the relevant set of dummy variables (after accounting for age group and sex). These regressions were also done with each of these two sets of dummy variables on their own (but including age group and sex), as checks on the stepwise results.
Results
Aim 1: compare the theoretical and methodological bases for the two indexes
IMD and NZDep are small area measures of socioeconomic position. The term socioeconomic position is used here to indicate ‘the social and economic factors that influence what position(s) individuals and groups hold within the structure of society’ (Lynch and Kaplan Citation2000, p. 14). The theoretical basis for socioeconomic deprivation is located in the broader fields of social stratification encompassing socioeconomic status and position, social class (based on the ownership or non-ownership of the means of production, distribution and exchange), deprivation, poverty, and living standards (Salmond et al. Citation2006).
Socioeconomic deprivation is one particular theorisation of socioeconomic position. Both NZDep and IMD draw on Townsend’s (Citation1987) definition of socioeconomic deprivation as ‘a state of observable and demonstrable disadvantage relative to the local community or the wider society or nation to which an individual, family or group belongs’. It can include both material and social deprivation, material deprivation involving the material apparatus, goods, services, resources, amenities and physical environment and location of life, and social deprivation involving the roles, relationships, functions, customs, rights and responsibilities of membership of the society and its subgroups.
Socioeconomic deprivation reflects a neo-materialist standpoint that places emphasis on relative rather than absolute material conditions – that is, it links material conditions to the norms of society and culture (Salmond et al. Citation2006). The move to non-occupational deprivation-based approaches, with their focus on consumption outcomes, is comparable with the shift in emphasis from production to consumption that has been a feature of the post-industrial moral landscape (Salmond et al. Citation2006).
NZDep
The methodological basis for the construction of NZDep has been well described elsewhere (Crampton et al. Citation1997; Salmond and Crampton Citation2012a), and was based on previous work carried out in the UK (for example Morris and Carstairs Citation1991). In summary, each index was created as the first principal component of the deprivation variables: the weighted sum that describes the greatest proportion of the overall variation of the variables (60.7% of the overall variance for NZDep2013; Atkinson et al. Citation2014). It is the best single indicator of deprivation, given those variables. Specifically, the NZDep indices are weighted sums of proportions of people of an appropriate age in a small area having specific deprivation characteristics. Potential deprivation characteristics available from the census data were included on the basis of theoretical considerations, reliability (there were few missing data) and correlation (their weights in the first principal component indicated a reasonable correlation with the other deprivation variables). The indices have all been extensively construct and criterion validated. The variables in each index are age- and sex-standardised proportions of people in each small area with certain deprivation characteristics. For NZDep2013 there were nine such characteristics ().
Table 2. Variables included in NZDep2013.
A key feature of NZDep is the smallness of the areas used. The smallest standard area that Statistics New Zealand uses is the meshblock. Meshblock populations vary spatially and numerically. Their median population size in 2013 was approximately 81 persons but can be from zero to more than 300 persons usually resident (Atkinson et al. Citation2014). In order to use proportions, the denominator should be large enough to produce robust values. Thus, where necessary, meshblocks were agglomerated to create NZDep2013 specific small areas with a population of at least 100 persons usually resident, where possible. Agglomeration occurred only within the boundaries of Statistic New Zealand’s internal primary sampling units, so that the resulting small areas were geographically connected and have a sense of homogeneity as determined by Statistics New Zealand (Citation2019b). Eighty per cent of the NZDep2013 small areas consist of one or two meshblocks (Atkinson et al. Citation2014). The index value for any small area was assigned to each of its component meshblocks.
IMD
Noble et al. (Citation2006) provide a summary of some of the methodological approaches adopted in the construction of the various UK versions of the IMD, on which the New Zealand IMD is based. He argues that this approach involved a ‘fundamental reappraisal and reconceptualization of small-area level multiple deprivation and its measurement’ (Noble et al. Citation2006).
A novel feature of IMD is that it includes the development and use of new spatial boundaries called data zones, which, where possible, are nested within census area units (population details below) (Exeter et al. Citation2017). The authors identify a strength of the data zones as their independence from the administrative units used by different government agencies, which may change over time. The data zones represent a ‘neutral geographical basis for facilitating data sharing’, and an intermediate geography between meshblocks and census area units that ‘conveys a sense of neighbourhood’ (Exeter et al. Citation2017). The boundaries of data zones were determined using six criteria: geographic contiguity, population equality, respecting administrative boundaries, respecting physical barriers, internal socioeconomic homogeneity and compactness (Exeter et al. Citation2017). Internal socioeconomic homogeneity was determined using NZDep via visual inspection and a homogeneity measure (Zhao and Exeter Citation2016; Exeter et al. Citation2017). Therefore, to some degree an association between IMD and NZDep is to be expected.
IMD and NZDep comparison
We highlight here six main theoretical and methodological differences between IMD and NZDep. First, being larger than meshblocks, the purpose-built IMD data zones have the benefit that fewer will have data suppressed as a result of small numbers (Exeter et al. Citation2017). Data zones are of differing sizes and larger ones may potentially miss underlying socioeconomic heterogeneity (see below). NZDep, on the other hand, builds its small areas from standard meshblocks, as just described (also see below). NZDep always agglomerates meshblocks with small numbers, where possible, to minimise suppressions due to missing data (Atkinson et al. Citation2014).
Second, IMD uses multiple domains of deprivation that can be used individually or in combination, to explore the geography of deprivation and its associations with different outcomes (Exeter et al. Citation2017). Noble et al. (Citation2006) describe domains as ‘area-level dimensions of deprivation which need to be measured as accurately as possible and which aggregate to a measure of multiple deprivation’. He describes a model that ‘is a series of unidimensional domains of deprivation which may be combined, with appropriate weighting, into a single measure of multiple deprivation’ (Noble et al. Citation2006). The aim of the authors of IMD is that this approach will provide a ‘more nuanced view of area deprivation circumstances’ and a basis for a ‘more consistent approach to reporting and monitoring the social climate in New Zealand’. The seven domains, their respective indicators, and the domain weights are illustrated in .
Table 3. Domains, indicators and weights in the Index of Multiple Deprivation.
Third, a novel feature of IMD is that for some variables it draws on data sources other than the Census. For example, data from Statistics New Zealand’s Integrated Data Infrastructure (Citation2019a) were used for deriving the Inland Revenue variable in the income domain and the variables based on the Recorded Crime Victimisation Statistics in the crime domain (Exeter et al. Citation2017). The inclusion of non-Census-derived variables gives scope for consideration of a greater range of potentially powerful markers of area socioeconomic deprivation.
Fourth, IMD includes domains and variables that, according to the theoretical approach used for NZDep, are not direct markers of socioeconomic deprivation but can be conceptualised as outcomes of deprivation. These new domains include health and crime. NZDep, by way of contrast, includes only what its authors consider to be direct markers of socioeconomic deprivation rather than outcomes.
Fifth, IMD uses judgement-based weights for the seven domains. Noble et al. (Citation2006) describe five approaches to weighting: (1) driven by the literature on multiple deprivation and social exclusion; (2) empirically driven; (3) determined by policy relevance; (4) determined by consensus; and (5) entirely arbitrary. IMD weights were assigned to each domain score (calculated in various ways), on the basis of judgement based on the literature (Noble’s method 1) (Exeter et al. Citation2017), and are similar to, but not the same as, the seven UK IMD weights. The seven NZ IMD weights are 28% (x2), 14% (x2), 9%, 5%, and 2%. The domain scores had all been transformed into an exponential distribution before weighting.
By way of comparison, NZDep weights were derived statistically (method 2 in Noble’s taxonomy above). They were obtained as the weights on the first Principal Component of its constituent variables (all measured on the same scale, proportions), which are all expected to measure the same underlying dimension (confirmed with a factor analysis) (Salmond and Crampton Citation2012a).
Sixth, IMD does not use age/sex standardisation of variables. NZDep attempts to remove the (broad) effects of age and sex from the index so that that the index would not get mixed up with age and sex explanatory variables in any analysis, funding formulae, etc. While IMD does not have these effects removed, an investigation of the effect of standardisation in NZDep showed that it makes only a slight overall difference to the index results (Atkinson et al. Citation2014).
Aim 2: compare NZDep2013 small areas and IMD data zones
NZDep is reported at the MB level, but it is calculated at the small area level. Therefore, the small area level is the comparison that was used in this part of the study. There are 23,669 small areas with published NZDep2013 values (i.e. those values with sufficient data) and the average usual resident population among these small areas is 179 (Atkinson et al. Citation2014).
IMD is based on 5958 data zones with an average population of 712 (excluding outliers, the population range is 501–999) (Exeter et al. Citation2017). The IMD data zones for 2013 are almost four times the size (3.98) of NZDep small areas. Wherever possible (93.3%) data zones are nested within census area units (Exeter et al. Citation2017).
Approximately three quarters (73.7%) of data zones contain 4, 5 or 6 NZDep small areas (), although some of the NZDep small areas straddle data zone boundaries.
Table 4. Distribution of NZDep2013 small areas within each IMD data zone.
Aim 3: compare NZDep2013 and IMD in their rankings of all small areas in New Zealand
investigates the correlation between deprivation as measured by NZDep2013 deciles, and deprivation measured by (a) deciles of IMD, (b) individual domains of IMD (left-hand side), and (c) versions of IMD that remove just one domain (right-hand side). Correlations are given for two situations: first, when the NZDep small area lies wholly within one data zone so that the comparison is straightforward; and second, when the NZDep small area straddles two data zones so that the comparisons are weakened if the two data zone values differ.
Table 5. Correlation between deprivation, as measured by NZDep2013 deciles and various IMD deciles, by number of IMD data zones overlapping an NZDep small area (unit of analysis is persons in small areas having an NZDep2013 value).
There is a good correlation between IMD and NZDep deciles. In the left-hand side of , there is an obvious drop in correlation between NZDep2013 and each IMD domain (each containing much less information than the overall IMD). Among the NZDep small areas contained wholly within a data zone (column headed ‘1’), the closest correlations to the overall correlation (0.83) occur for those domains which are theoretically direct markers of deprivation; in descending order: income (0.79), employment (0.74), housing (0.72), and education (0.69). Two of the other three domains, representing outcomes, are less closely correlated – health (0.63) and crime (0.53) – while access has a small negative correlation: −0.28 – noting, however, that its weight in the overall IMD index is small (2%). Unsurprisingly, the correlations when small areas straddle two data zones (columns labelled ‘2’) are slightly smaller than those involving small areas fully contained within one data zone (columns labelled ‘1’). This is due, in part, to the different sample sizes. As expected, the correlations between NZDep deciles and the versions of IMD that delete just one domain (, right-hand side) are larger than that between NZDep and the individual IMD domains (left-hand side).
shows the relative agreements between the NZDep2013 and IMD indexes. The unit of analysis is people because, as noted above, in applications, modelling is generally carried out with people as the unit of analysis (noting that larger small areas (in terms of population) have greater weight in the correlation).
Figure 1. Agreement between NZDep2013 and IMD deprivation deciles (unit of analysis is people) (inner square = total agreement; middle square = ±1 decile; outer square (white) = differ by at least 2 deciles).
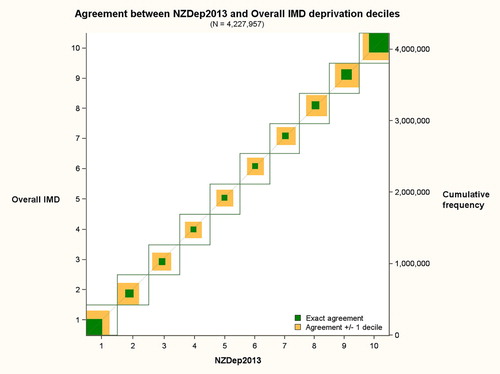
In their rankings of small areas, there is fair but not perfect agreement between the two indexes. The white spaces show that the amount of considerable disagreement is greatest towards the middle of the indexes and least at the very deprived deciles. Some white space is to be expected because: (a) there is more information (more variables) in IMD than in NZDep; (b) the variables in the two indexes differ; (c) the IMD includes variables measuring outcomes from deprivation (e.g. health), whereas NZDep only contains direct markers of deprivation over which there is some policy control; and (d) NZDep is age/sex standardised and IMD is not.
The greater agreement at each end of the scales (values 1 and 10) is due, in part, to the fact that the only difference possible is in one direction, not both as with the other scale values (2–9). Nevertheless, there is a greater agreement at both ends of the scales than there is towards the middle.
Aim 4: compare NZDep2013 and IMD in terms of their relationships with various health and social outcomes
The intention of these analyses was to illustrate the practical consequences of using one or other index. We analysed six types of binary outcome: smoking, mortality, avoidable mortality, hospital discharges for respiratory diseases, crime, and self-assessed health status (details and supplementary tables available on request). All the analyses showed only small differences in the explanatory performances of NZDep2013 and (a) IMD-minus-Health for eight health-related outcomes and (b) IMD-minus-Crime for two crime-related outcomes. The IMD housing domain had a significant relationship to respiratory discharge rates (results not shown), demonstrating the utility of this individual domain (supplementary tables available on request), and potentially of other individual domains.
provides key information to see the extent of these differences in models which include the usual potential confounders of age group and sex (as dummy variables), as would be done in most research analyses. The proportional improvements in the fit-statistic for the model due to the inclusion of the relevant index are small, reflecting all the other variables that might go into a better explanatory model, such as smoking history in the family, for individual smoking behaviour; and personal smoking history for respiratory disease hospitalisations.
Table 6. Key-points summary of the analyses of 10 outcomes.
The Improvement percentages with a superscript a are the four largest improvements for the outcomes in the table and are the larger of the two being compared for the outcome in question. They turn out to be:
All for NZDep2013 (and all enter first in a stepwise logistic regression);
All for a different outcome;
From both census and survey data;
For both health and crime outcomes;
Exclusive of the hospital discharge and mortality data for respiratory diseases (which were included primarily for investigations of the IMD-Housing domain, which is discussed below).
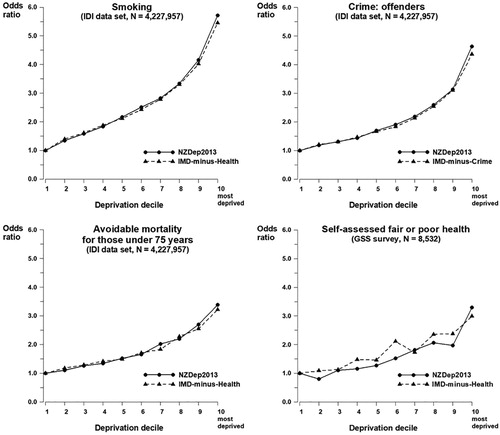
All four outcomes illustrated in show the expected roughly linear increase in odds ratio with increasing deprivation, with a steeper slope towards the most deprived decile, and for both types of the index of deprivation. The closeness of the graph pairs is the clear indication of the similarity in performance of the two indexes of deprivation in the IDI sample, although the self-assessed health graph shows unexpected (though small) fluctuations, between and within neighbouring deciles, a likely consequence of the much smaller GSS sample on which it is based.
Figure 2. Estimated odds ratios for deprivation in logistic models for four outcomes that include age group, sex, and either NZDep2013 or an appropriate IMD index.
The exploration of respiratory diseases allowed us to investigate the performance of one of the single IMD domains (as well as the relevant IMD-minus-Health).
The strongest relationship between deprivation and a respiratory outcome was with mortality (), and the odds ratios for those models are shown graphically in .
Figure 3. Estimated odds ratios for deprivation in logistic models for mortality from respiratory disease that include age group, sex, and one of three indexes of deprivation.
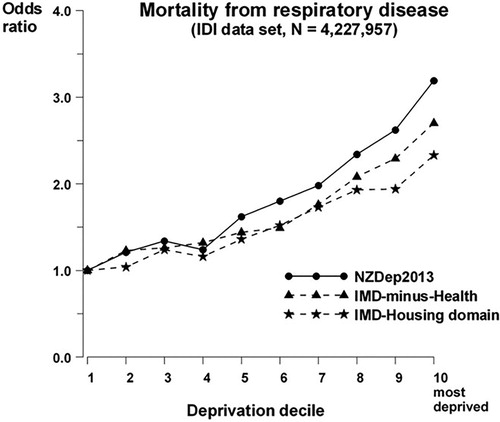
All three indexes show a relationship between mortality from respiratory causes and deprivation with the usual shape: a generally monotonic increase with an increase in slope towards the more deprived end of the scale. The IMD-Housing domain includes two variables that are in the NZDep calculations – rented accommodation and overcrowding – so it is unsurprising that both of the other indexes show a slightly stronger relationship. This result does, however, show the potential utility for using the IMD domains to tease out the important components of any deprivation measure to aid an understanding of the drivers of the outcome.
Discussion
This study has demonstrated that there are theoretical and methodological differences between IMD and NZDep. For example (1) IMD uses new spatial boundaries (data zones) that are intended to convey a sense of neighbourhood and are, on average, approximately four times the size of NZDep small areas; (2) IMD uses more input variables and data than NZDep; (3) while both indexes depend on a census, NZDep wholly, IMD only in part (IMD uses census data for all denominators bar three for education, and for two housing and two education indicators), IMD clearly demonstrates the value of non-Census data sources; (4) IMD uses multiple domains of deprivation that can be used individually, or as all combined together, or as all bar one; (5) IMD includes domains and variables that, according to the theoretical approach used for NZDep, are not direct markers of socioeconomic deprivation but can be conceptualised as outcomes of deprivation; (6) IMD uses judgement-based weights; NZDep weights were obtained as the weights on the first Principal Component of its constituent variables; (7) NZDep is age/sex standardised.
One of the notable methodological differences between the two indexes is in the selection of domains and variables. For example, IMD’s Access domain is included in IMD as a marker of deprivation in order ‘to represent the cost and inconvenience of travelling to access basic amenities’ (Exeter et al. Citation2017). However, the influence of this domain on the performance of the index is minimised because of the judgement-based weight of just 2% that was assigned to it.
The use of access in the UK Index of Multiple Deprivation has been critiqued because of the ambiguous meaning of the domain (Niggebrugge et al. Citation2005), and the authors of the critique note the difficulty in combining substantially different concepts of deprivation to produce a composite. The access domain and the measures of material deprivation have different relationships with health. Material deprivation is a determinant of health, working through well-described pathways. Disadvantaged access may not directly cause ill-health in the same way as material deprivation. The conceptual difficulty here is what is meant by ‘socioeconomic deprivation’; as conceptualised by Burke and Jones (Citation2019), access is a form of ‘locality related deprivation’, alternatively access might be conceptualised more as a marker of rurality rather than of socioeconomic deprivation.
Despite the theoretical and methodological differences, the two indexes behave in a similar, but not identical, manner in their ranking of small areas and in their associations with health and social outcomes. We conclude from the analyses presented here that, for practical purposes, for many applications, the two indexes give similar results when analysing very large data sets, although there are some important caveats related to this conclusion for both large and small data sets.
Three caveats apply to this conclusion. First, the most important difference between the two indexes from a practical point of view is that NZDep small areas are about one quarter the size of IMD data zones and, as a result, data zones may miss small pockets of socioeconomic deprivation that are detected within NZDep. The so-called modifiable areal unit problem refers to biases in spatially based analyses of incidence and associations, which can occur as a result of the (frequently pragmatic or arbitrary) choice of boundaries (Openshaw Citation1984). One way of minimising these biases is to use the smallest possible areal units. It is likely that, because of their larger size that is intended to reflect a sense of neighbourhood, the use of data zones will result in more imprecision and bias in analyses compared with NZDep small areas (Tuson et al. Citation2018).
Second, users of IMD need to give consideration as to which version of IMD to use for specific purposes. For example, analyses with a health outcome should avoid also including health information in the explanatory part of the model since the latter can be considered an outcome of underlying deprivation and may share causes similar to the outcome being investigated. This can be accomplished by using the version of IMD that excludes the health domain (noting that it is only possible to remove one domain from the index).
Third, because the ranking of small areas varies somewhat according to which index is used, these differences could translate into practical consequences in some situations, for example for resource allocation.
The primary limitation of this study is the limited number of outcomes that were examined. It is possible that the associations between the indexes and other health and social outcomes may vary from those illustrated in this study. Similarly, the conclusions drawn from this study apply to analyses of very large datasets. It is possible that the findings could be different if smaller datasets were analysed.
It will be important for future research to further identify and explore differences in the performance of NZDep and IMD and to compare these two indexes with the recently published Dynamic Deprivation Index (Ward et al. Citation2019). Also, it would be useful for the authors of IMD to construct their index using only non-Census data sources and test how it performs in comparison to NZDep. This would provide a basis for indexes if, for whatever reason, Census data are not available in the future. At the time of submitting this article, research is underway on the production of NZDep2018, including exploration of the implications of Statistics New Zealand’s new geographic areas, statistical area 1 and 2.
In conclusion, for practical purposes for many applications, the two indexes give similar results when analysing large data sets, although there are some important caveats related to this conclusion for both large and small data sets.
Data availability and Statistics New Zealand disclaimer
The data used in this study are available from Statistics New Zealand but restrictions apply to the availability of these data, which were used under license for the current study and accessed via a secure data laboratory, and so are not publicly available. Access to these data is, however, available from Statistics New Zealand upon request.
This disclaimer applies to all data analyses using Statistics New Zealand’s IDI environment. The results of this paper are not official statistics. They have been created for research purposes from the Integrated Data Infrastructure (IDI), managed by Statistics New Zealand. The opinions, findings, recommendations, and conclusions expressed in this paper are those of the authors, not Statistics NZ. Access to the anonymised data used in this study was provided by Statistics NZ under the security and confidentiality provisions of the Statistics Act 1975. Only people authorised by the Statistics Act 1975 are allowed to see data about a particular person, household, business, or organisation, and the results in this paper have been confidentialised to protect these groups from identification and to keep their data safe. Careful consideration has been given to the privacy, security, and confidentiality issues associated with using administrative and survey data in the IDI. Further detail can be found in the privacy impact assessment for the Integrated Data Infrastructure available from www.stats.govt.nz.
Acknowledgments
The authors are grateful for comments made on an earlier draft by the anonymous reviewers.
Disclosure statement
No potential conflict of interest was reported by the authors.
References
- Atkinson J, Salmond C, Crampton P. 2014. NZDep2013 index of deprivation. [accessed 2019 Feb 8]. https://www.otago.ac.nz/wellington/otago069936.pdf.
- Burke A, Jones A. 2019. The development of an index of rural deprivation: a case study of Norfolk, England. Social Science & Medicine. 227:93–103. doi: 10.1016/j.socscimed.2018.09.019
- Crampton P, Salmond C, Sutton F. 1997. NZDep91: a new index of deprivation. Social Policy Journal of New Zealand. 9:186–193.
- Exeter DJ, Shackleton N, Browne M, Zhao J, Lee A, Crengle S. 2019. Different domains of deprivation and their relationship with obesity in New Zealand 4-year-old children. Pediatric Obesity. 14(8):e12520. doi: 10.1111/ijpo.12520
- Exeter D, Zhao J, Crengle S, Lee A, Browne M. 2017. The New Zealand indices of multiple deprivation (IMD): a new suite of indicators for social and health research in Aotearoa, New Zealand. PLoS One. 12(8):e0181260. doi: 10.1371/journal.pone.0181260
- Fu M, Exeter DJ, Anderson A. 2015a. The politics of relative deprivation: a transdisciplinary social justice perspective. Social Science & Medicine. 133:223–232. doi: 10.1016/j.socscimed.2014.12.024
- Fu M, Exeter DJ, Anderson A. 2015b. “So, is that your ‘relative’ or mine?” A political-ecological critique of census-based area deprivation indices. Social Science & Medicine. 142:27. doi: 10.1016/j.socscimed.2015.07.036
- Lynch J, Kaplan G. 2000. Socioeconomic position. In: Berkman L, Kawachi I, editors. Social epidemiology. Oxford: Oxford University Press; p. 13–35.
- Morris R, Carstairs V. 1991. Which deprivation? A comparison of selected deprivation indices. Journal of Public Health Medicine. 13:318–326.
- Niggebrugge A, Haynes R, Jones A, Lovett A, Harvey I. 2005. The index of multiple deprivation 2000 access domain: a useful indicator for public health? Social Science & Medicine. 60(11):2743–2753. doi: 10.1016/j.socscimed.2004.11.026
- Noble M, Wright G, Smith G, Dibben C. 2006. Measuring multiple deprivation at the small-area level. Environment and Planning A. 38(1):169–185. doi: 10.1068/a37168
- Openshaw S. 1984. The modifiable areal unit problem. Norwich [Norfolk]: GeoBooks.
- Organisation for Economic Co-Operation and Development. 2008. Handbook on constructing composite indicators: methodology and user guide. Paris: OECD.
- Page A. 2006. Australian and New Zealand atlas of avoidable mortality. Adelaide: Public Health Information Unit, University of Adelaide. New Zealand Ministry of Health, Public Health Information Development Unit University of Adelaide.
- Reinken J, McLeod J, Murphy T. 1985. Health and equity. Wellington: Department of Health.
- Salmond C, Crampton P. 2012a. The development of New Zealand’s deprivation index (NZDep) and its uptake as a national policy tool. Canadian Journal of Public Health. 103(Suppl 2):S7–S11.
- Salmond C, Crampton P. 2012b. Measuring socioeconomic position in New Zealand. Journal of Primary Health Care. 4(4):271–280. doi: 10.1071/HC12280
- Salmond C, King P, Crampton P, Waldegrave C. 2006. NZidep: A New Zealand index of socioeconomic deprivation for individuals. Social Science & Medicine. 62:1474–1485. doi: 10.1016/j.socscimed.2005.08.008
- Statistics New Zealand. 2019a. Integrated Data Infrastructure. Statistics New Zealand; [accessed 2019 Feb 8]. https://www.stats.govt.nz/integrated-data/integrated-data-infrastructure/.
- Statistics New Zealand. 2019b. Statistical standard for meshblock. Statistics New Zealand; [accessed 2019 Feb 8]. http://archive.stats.govt.nz/methods/classifications-and-standards/classification-related-stats-standards/meshblock/definition.aspx.
- Townsend P. 1987. Deprivation. Journal of Social Policy. 16:125–146. doi: 10.1017/S0047279400020341
- Tuson M, Kok M, Yap M, Vickery A, Boruff B, Murray K, Turlach B, Whyatt D. 2018. Reducing bias in multivariate analyses due to the modifiable areal unit problem. International Journal of Population Data Science. 3:4. doi: 10.23889/ijpds.v3i4.860
- Ward AD, Trowland H, Bracewell P. 2019. The Dynamic Deprivation Index: measuring relative socio-economic deprivation in NZ on a monthly basis. Kōtuitui: New Zealand Journal of Social Sciences Online. 14(1):157–176.
- Zhao J, Exeter DJ. 2016. Developing intermediate zones for analysing the social geography of Auckland, New Zealand. New Zealand Geographer. 72(1):14–27. doi: 10.1111/nzg.12110