
ABSTRACT
The Voiceless Animal Cruelty Index (VACI) calculates three indices for deliberate or willfully ignorant animal mistreatment in 50 countries with high agricultural output. These are animal slaughter (Producing Cruelty), animal consumption (Enabling Cruelty), and laws protecting farmed animals (Sanctioning Cruelty). The rankings of Producing, Enabling and Sanctioning Cruelty are combined to form the final VACI rank. Weighted values for animals slaughtered and numbers of animals consumed, and the overall VACI rank showed a Kuznets effect with per capita Purchasing Power Parity (PPP). The inflection point was between $26 and $42K. Sanctioning Cruelty declined significantly in a linear fashion as PPP increased but did not show a Kuznets effect. Weighted numbers of animals consumed and overall VACI rank both increased with increasing income inequality (as measured by the Gini coefficient), for the 16 countries with the highest per capita PPP. This confirms other studies showing societal improvements in developed countries with higher equality. This is the first instance where slaughter or consumption of animals has shown an animal welfare Kuznets curve with an inflection point within the normal PPP range, where time series data was not used.
Introduction
The Voiceless Animal Cruelty Index
The Voiceless Animal Cruelty Index (VACI) measures human abuse of land-based farmed animals at the country level for 50 countries (Voiceless Citation2018). The VACI follows on from the Animal Protection Index (API) devised by the NGO World Animal Protection, which made an evaluation of the same 50 countries based on legal protection given to animals. The 50 countries used for the analysis were chosen because they had high levels of production in animal-based agriculture (World Animal Protection Citation2020). These include developed and developing countries in Europe, Asia, Africa and the Americas, as well as Australia and New Zealand.
The VACI was devised to encourage debate and challenge citizens worldwide to reduce needless farm-based animal suffering. The term ‘cruelty’ is controversial, since it implies abuse of animals for its own sake, not for food, clothing or other utilitarian concerns. It is however our contention that it is not necessary to kill animals for human sustenance, and in fact excessive animal consumption is a major cause of ill-health (Willett et al. Citation2019). Killing an animal for taste pleasure is therefore no better than killing for entertainment pleasure (bull-fighting, rodeos, etc.) or vanity (fur farming etc.).
It can be argued that most people are still unaware that meat is not necessary for human health. However this becomes harder to sustain in view of the increasing evidence for the health-giving properties of vegetarian diets, and the inhumane nature of meat production. This led Nancy Williams (Citation2008) to conclude that Western consumers who purport to being unaware of the suffering and lack of necessity are showing ‘affected ignorance’. This can be defined as those who suspect an unpleasant truth, have the resources to confirm or allay their suspicions, yet choose not to (Lynch Citation2016). We therefore contend that ‘cruelty’ is an apt term, describing either willfully callous or willfully ignorant disregard for animals.
The first index of the VACI is Producing Cruelty. This measures the number of land-based animals slaughtered per person. This is multiplied by a weighting factor that is inversely proportional to the legal protection provided to farmed animals, as determined by the API. This is an indicator for loss of animal utility, being proportional to both numbers and severity of suffering (Frank Citation2008; Morris Citation2013).
The second index is Enabling Cruelty. This is in turn derived from two measures. The first of these measures the number of animals consumed for meat or used for animal by-products per person in each country. This is derived from data for the mass of animal meat consumed, divided by world average carcass yield.
In using this formula we acknowledge that yields differ between countries. In places like Kenya for example, carcass weights and numbers of eggs laid per animal are less than they are in industrial countries, meaning our index would be lower than the real number of animals slaughtered or used. However, the high-yield industrial animals would suffer more from being factory farmed (Rollin Citation2016; Hartcher and Lum Citation2019). This therefore provides a weighted value. It is a composite measure of numbers multiplied by severity of suffering, similar to the Producing Cruelty index.
The second component of the Enabling Cruelty index measures the proportion of land animal-based to plant-based protein consumption. This component does not necessarily equate to loss of animal utility, since a high proportion of animal protein consumption does not entail high consumption of animals in absolute terms. It is rather an acknowledgement that some people will not consume much in absolute terms because of economic constraints, but may still be determined to eat as much animal protein as they can afford. It is therefore a measure of intent, which is related to virtue ethics (Hursthouse Citation1999).
The third sub-index is Sanctioning Cruelty. This is derived from the API legal protection measures specifically relating to farmed animals.
The combined VACI index is a weighted average of the three indices; Producing Cruelty, Enabling Cruelty and Sanctioning Cruelty. It is calculated by adding ranks for the three indices and then taking the overall rank of these.
One major limitation of the VACI is that it is restricted to land animals. It is far more difficult to obtain accurate figures on fishes and other marine animals killed, since the FAO only provide figures for weights and not numbers. However, the NGO Fish count estimates that around a trillion fish are killed each year, not including by-catch or ghost fishing. This is based on the average sizes and weight estimates for each fish species caught (Mood and Brooke Citation2010). This figure dwarfs the number of land animals killed by a factor of about 16.
In spite of its limitations, the VACI does capture information relevant to the welfare of farmed animals. This paper seeks to test the suitability of the VACI and all its components as valid indicators of animal welfare. This will be achieved by identifying relationships between the VACI and socio-economic indicators, specifically economic indicators and inequality. These economic indicators have been correlated with social indicators, as explained in detail below.
The Kuznets conjecture
According to Simon Kuznets (Citation1955), as an economy develops, economic inequality first increases, then declines. The corresponding inverted U-shaped quadratic relationship between economic growth and inequality is known as a Kuznets curve, after its discoverer.
There have been similar inverted U-shaped relationships found between economic growth and environmental degradation at both national and regional level (e.g. Dasgupta et al. Citation2002; Wang and Wei Citation2014; Khan et al. Citation2016; Rasli et al. Citation2017; Sarkodie Citation2018), leading to the concept of an environmental Kuznets curve (EKC) (Dasgupta et al. Citation2002). In other cases, an EKC has been found to be absent. For example, Bradshaw et al. (Citation2010) measured a range of environmental indicators in 228 countries and found degradation increased with increase in per capita wealth. There was no decline in the wealthiest countries.
Reasons proposed for higher growth countries or regions reducing their environmental impact and thus leading to the declining portion of the Kuznets Curve include improvements in technology (Dasgupta et al. Citation2002; Carson Citation2010), or a shift in the attitudes of wealthier consumers who can afford the luxury of altruism and a higher level desire for aesthetics and the environment once their basic needs have been met (Frank Citation2008; Lantz and Martinez-Espineira Citation2008; McCollough et al. Citation2016). Other factors include the power of formal or informal regulatory and pressure groups in curbing the worst environmental excesses in wealthier countries (Kasuga and Takaya Citation2017).
Environmental degradation and inequality
Since rising economic growth is associated with lower inequality (Kuznets Citation1955), it is possible that much of the effect of economic growth on environmental improvement is indirect, and is due to improvements in equality. Among developed countries, many social ills are more prevalent in more unequal societies, including teen pregnancy, abortions, mental illness and crime. In contrast, environmental protection, educational achievement and numbers of patents are higher in more equal countries (Wilkinson and Pickett Citation2009; Pickett and Wilkinson Citation2015).
The association between inequality and human health and well-being has been found to be associated with levels of trust. People are more trusting in more egalitarian environments, and this improves well-being (Rozer et al. Citation2016).
There have been similar relationships found between environmental degradation and inequality at national and sub-national levels (Wilkinson et al. Citation2010; Baek and Gweisah Citation2013). Kasuga and Takaya (Citation2017) found that inequality affects air quality in residential but not commercial areas of Japan. They suggested that this is due to pressures from environmental groups in residential areas where these groups have greater influence.
Animal welfare Kuznets curves
The presence of an environmental Kuznets curve has prompted an attempt to find a similar curve for animal welfare. Frank (Citation2008) found that some positive attitudes toward welfare of companion animals were correlated with higher economic growth. For example, high-growth European countries and U.S. states were the ones with felony-level animal cruelty statutes and more humane euthanasia methods in shelters. Numbers of cats and dogs experimented on per person in in EEC countries may have also shown the start of a Kuznets effect, with a flattening of the upward trend with increasing income in high-income countries (Morris Citation2013).
In contrast, Morris (Citation2013) found no correlation between economic growth and legal protection of animals across U.S. States. Holst and Martens (Citation2016) found a similar lack of correlation at the country level, using the API as an indicator of legal protection.
When it comes to treatment of farmed animals and animal consumption, which makes up most of the animals killed worldwide and has the greatest effect on lowering animal utility, there is also little evidence of a Kuznets effect. Morris (Citation2013) found no correlation between consumption of any form of meat and income in high income countries. At an individual level, beef consumption increased with income, with no Kuznet’s decline at higher incomes (Gossard and York Citation2003).
Cole and McCoskey (Citation2013) surveyed 150 countries and found an inflection point in economic growth where meat consumption started to decline, but this was at such a high level that few countries would be likely to reach it.
Allievi and Vinnari (Citation2012) report a Kuznets effect with numbers of animals slaughtered per person declining in 15 high-growth European countries as wealth increased. However, these authors used time series data. Meat consumption in western countries has been falling in recent years, driven by publicity over the environmental, animal welfare and human health concerns (Dagevos Citation2016; Morris Citation2017). This is part of a longer-term ethical shift in attitudes towards nonhuman animals and marginalised humans (Pinker Citation2011). The effect may therefore simply due to changing attitudes over time and not the concomitant increase in economic growth.
Inequality and animal welfare
Holst and Martens (Citation2016) compared animal welfare laws, as measured by the API, with indicators measuring democratic structures, activism groups and numbers of animal welfare groups. There was a positive correlation in each case. This suggests that pressures from activism groups is a factor in improved animal welfare laws, just as suggested for improvements in environmental outcomes (Dasgupta et al. Citation2002; Kasuga and Takaya Citation2017).
Genco (Citation2016) provides further support for the hypothesis that animal welfare laws are related to relative power of special interest groups. Numbers of animal welfare statutes in each US state were positively correlated with revenue from animal charities and negatively correlated with the economic power of hunting and farming groups in the same state. Animal cruelty statutes were fewer in states with high levels of donations to the Democratic Party.
There is also some evidence for the effect of greater equality in improving regulations restricting farmed animal mistreatment, and a decline in meat consumption at the country level (Morris Citation2013). This paper aims to further test the relationship between income, equality and animal welfare, using the VACI and its different components as animal welfare indicators.
Methods
Two economic indicators were used. These were the Gross National Income per person, adjusted for purchasing power parity (PPP) in international dollars, and the Gini coefficient, which is a measure of inequality. The PPP was obtained from World Bank data. This variable was chosen in preference to the unadjusted Gross National Income (GNI), because it provides a measure of the average real spending power of residents.
The Gini coefficient for inequality was obtained from the United Nations Human Development Index, and is a composite figure. The most recent available figure was used. For all countries but three, this was for 2010–2017. For Azerbaijan and Venezuela the 2010–2015 Gini coefficient was used. For New Zealand, the 2018 result for disposable income was used (Perry Citation2019).
Two comparisons for the Gini coefficient were run. The first compared the Gini coefficient for all 50 countries used in the VACI sample set. In the second analysis, only the 17 countries ranked among the world’s top 50 countries in PPP were counted. This is because the effects of greater equality on social conditions is greater among developed countries (Wilkinson and Pickett Citation2009).
The cruelty indices (dependent variables) used for analysis were Producing Cruelty, the two categories of Enabling Cruelty (animals consumed and animal protein consumed), the Sanctioning Cruelty rank, and the ranked overall VACI. The online version of the VACI (Voiceless Citation2018) used 2013 and 2014 data from the FAO for Producing and Enabling Cruelty, and 2014 data from World Animal Protection for Sanctioning Cruelty.
Since the online VACI was published, FAO data for 2018 and 2017 has become available for Producing and Enabling Cruelty respectively. World Animal Protection also updated their API for 2020, allowing this to be used when calculating Sanctioning Cruelty.
Overall differences seen between the VACI data for 2013–2014 and the updated 2018–2020 indices are as follows:
The total number of animals slaughtered per person for all 50 countries increased by 4.9%
Numbers of large animals slaughtered per person (cows, goats, pigs, sheep) declined by 2.5%. This was more than offset by a 5.7% increase in numbers of poultry slaughtered.
There was no difference in the proportion of animal to vegetable protein consumed in the world. There was a 2% increase in vegetable protein consumed, and a 1% decline in meat protein. Dairy protein consumption increased by 4% and egg protein consumption by 9%
Meat consumption per person in the world declined by 1%. This was brought about by a decline in consumption of large animals by 2%–3%, offset slightly by a 1% rise in consumption of poultry flesh.
API scores and therefore Sanctioning Cruelty scores declined. No country achieved an ‘A’ for the 2020 API.
Correlations between economic and animal welfare indicators
Correlations between economic indicators (independent variables) and each animal welfare indicator (dependent variables) were run on an Excel spreadsheet that fitted linear, quadratic, cubic and quartic curves (McDonald Citation2008). The spreadsheet calculates two P values for best fit in the first three polynomials (linear, quadratic, cubic).
The first P value tests the null hypothesis that there is no relationship between the variables for the specific polynomial. The second P value (for the quadratic, cubic and quartic) test the null hypothesis that the true relationship is the lower level polynomial.
Polynomials with the first P value of < 0.05 are considered significant in subsequent analysis. Sometimes there will be a significant fit for more than one polynomial. In this case, the best fit is the highest order polynomial where the first P and the second P value are both < 0.05 (McDonald Citation2008).
The literature on the Kuznet’s curve generally reports a quadratic relationship (e.g. Dasgupta et al. Citation2002). Cubic EKCs with two inflection points have however been reported (e.g. Tsuzuki Citation2014).
Results
Animal welfare indicators and income
Comparisons with purchasing power parity (PPP) and the Producing Cruelty Index showed a cubic relationship, with an inverse inflection at $26–27 K (A), indicative of a Kuznet’s effect. A clear quadratic Kuznet’s effect was found when comparing PPP and the weighted numbers of animals consumed (C), and the overall VACI rank (E). The inflection points were at $41–42 K and $36–37 K respectively.
Figure 1. Relationship between per capita Purchasing power Parity (PPP) and indices of the Voiceless Animal Cruelty Index (VACI). A, Weighted value for numbers of animals slaughtered (Producing cruelty index). B, Proportion of land animal protein to vegetable protein consumed (part of the Enabling Cruelty sub-index). C, Weighted value for numbers of animals consumed (part of the Enabling Cruelty subindex). D, Sanctioning cruelty rank. E = Overall VACI rank. Lines of bests fit are significant (P < 0.05). Outlier countries are shown.
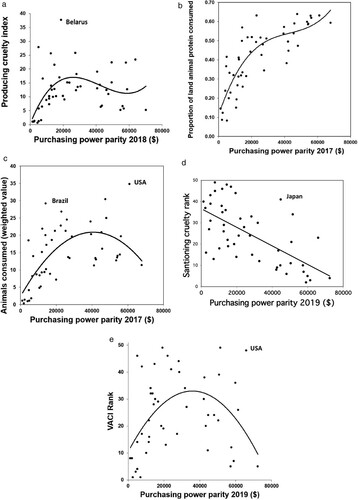
In contrast, the rank for sanctioning cruelty improved in a linear fashion with increasing income (D). Apart from a slight dip at around $50 K, the proportion of animal protein consumed increased with income (B). This mirrors the effect of increased wealth at an individual level on meat consumption (Gossard and York Citation2003).
Animal welfare indicators and inequality
When all 50 countries were used in the analysis, there was no significant correlation between inequality, as measured by the Gini coefficient, and any of the VACI indicators.
When only the 17 high income countries were included however, there was a significant linear increase in animals consumed (Enabling Cruelty sub-index) and the overall VACI rank ().
Figure 2. Relationship between Gini coefficients for the 17 highest income countries and indices of the Voiceless Animal Cruelty Index (VACI). A, Weighted value for numbers of animals consumed (part of the Enabling Cruelty subindex). B, Overall VACI rank. Lines of best fit are significant (P < 0.05).
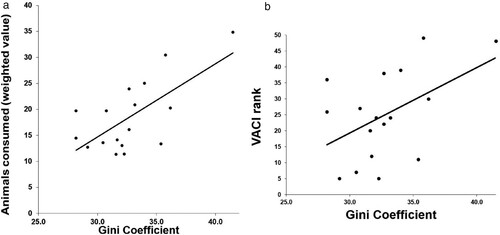
Partial correlations were run to determine whether any relationship between income and inequality, as predicted by the original Kuznets (1959) effect had any influence on the relationship between inequality and cruelty indices. There was no significant correlation between Gini and PPP for the variables and countries tested. Partial correlations confirmed there was a significant increase in weighted animal consumption (P < 0.01) and the overall VACI rank (P < 0.05) with increasing inequality.
Discussion
Relationship with economic growth
There was a Kuznets relationship between economic growth, as measured by PPP per person, and the weighted values for numbers of animals slaughtered (A), and numbers of animal consumed (C). The overall VACI also showed a Kuznet’s effect (E).
In contrast, proportion of animal protein consumed continued to increase with income (B).
This study is the first recorded instance where slaughter or consumption of farmed animals has shown an Animal Welfare Kuznets curve with an inflection point within the normal PPP range for existing countries, where time series data was not used.
This has implications for economic policy because it suggests animal welfare could be improved by raising a country’s average income.
The decline in meat consumption in wealthier countries with increase of average PPP (C) differs from results for meat consumption in 2007, where there was no correlation found between PPP and animal product consumption (Morris Citation2013). This may be related to a general lowering of meat consumption in developed countries in recent years (Dagevos Citation2016; Morris Citation2017). Our own comparisons between 2014 and 2017 have shown a decline in numbers of cows killed. Since it is beef that is mostly consumed by those on high incomes at the individual level (Gossard and York Citation2003), this could have been a contributing factor to people in the wealthier countries eating less meat.
The relationships between income and animal welfare indicators may highlight differences between ‘goods’ and ‘harms’. The Producing Cruelty index and the two criteria for Enabling Cruelty are examples of people actively increasing the harm they cause to animals. These increase with economic growth of a country, due to the ability for individuals within the country to afford these products.
The subsequent decline as growth increases further in some cases (A,C) may be due to the greater awareness, education and choice of animal meat alternatives in these places. It may also be related to factors that have driven improvements in animal welfare in other studies, such as the relative economic power of activism groups (Genco Citation2016), and the presence of democratic structures (Holst and Martens Citation2016).
Sanctioning Cruelty in contrast declined in a linear fashion with increases in economic growth (D). This indicator represents people increasing good will towards animals, through enacting regulations. These regulations may be stricter in high-income countries as they represent the increased resources available.
Another possible reason for stricter regulations in high-income countries could be their preoccupation with seeming to do the right thing in the face of a gruesome reality. In many cases regulations are put in place to placate consumers, who would be more vocal in high income countries, rather than to prevent animal cruelty (Sankoff Citation2005, Citation2009). The government regulator in New Zealand for example has admitted that animal welfare regulations are primarily put in place for market access reasons (MAF Citation2011). Actual enforcement or meaningful specific regulation that helps animals may be slow to materialise (Beatson Citation2008; Morris and Beatson Citation2011). This difference between enactment and actual improvements in animal welfare through enforcement highlights the weakness of the API (World Animal Protection Citation2020), and the Sanctioning Cruelty index of the VACI. It could also account for the reason why no Kunzets effect was found for Sanctioning Cruelty (D).
Relationships with inequality
The relationship between inequality and animal welfare indices in developed countries is aligned with previous findings for animal welfare (Morris Citation2013) and other social indicators (Wilkinson and Pickett Citation2009). This is possibly due to better choices, greater awareness, higher levels of trust and more political power for activism groups in countries that are both egalitarian and developed (Wilkinson and Pickett Citation2009; Genco Citation2016; Holst and Martens Citation2016).
Implications for animal welfare policy
It appears as if more equal developed countries consume fewer animals (A), and this adds weight to calls for improving equality for reasons related to social and environmental justice (Wilkinson and Pickett Citation2009; Wilkinson et al. Citation2010; Stiglitz Citation2012).
Producing Cruelty and consumption decline when the economy improves beyond a PPP income of $27 K and $42 K respectively (A,C), suggesting a positive effect of increasing economic growth beyond this point.
The presence of outliers shows that not all animal suffering can be explained in terms of economics or equality. Cultural and societal differences also play a part.
Outliers from the United States and Brazil for example, showing higher levels of meat consumption than predicted by their per capita PPP values (C,E), may be related to meat being seen as a status symbol.
Meat consumption is associated with high status in the United States, Argentina and Brazil. In the United States, the status of meat consumption even extends to an aversion towards dating vegetarians by U.S. men (Ruby et al. Citation2016). Campaigns to reduce meat consumption in these countries would need to break down cultural barriers to be effective, but may be worth the effort given that there is room for greater reductions in meat consumption. Efforts in countries like India or Korea, where meat consumption is relatively low, would have less of an effect.
The Producing and Enabling indices of the VACI (Voiceless Citation2018) provide a description of the way animals are actually treated. In contrast, the API and the Sanctioning Cruelty Index of the VACI measure good intentions. The weighted value for animal consumption in the VACI shows the same effect with inequality as other social indicators (Wilkinson and Pickett Citation2009). This provides further evidence for the suitability of this VACI index as an indicator for social trends in animal welfare.
Acknowledgements
The assistance of Viktoria Lencses in reviewing the data is gratefully acknowledged.
Disclosure statement
No potential conflict of interest was reported by the author.
References
- Allievi F, Vinnari M. 2012. Investigating the existence of an ‘animal Kuznets curve’ in the EU-15 countries. In: Potthast T, Meisch S, editor. Climate change and sustainable development. Wageningen: Wageningen Academic Publishers; p. 468–474.
- Baek J, Gweisah G. 2013. Does income inequality harm the environment: empirical evidence from the United States. Energy Policy. 62:1434–1437. doi: https://doi.org/10.1016/j.enpol.2013.07.097
- Beatson P. 2008. Accessed February 2020.
- Bradshaw CJ, Gima X, Sodhi NS. 2010. Evaluating the relative environmental impact of countries. PloS One. 5:e10440. doi:https://doi.org/10.1371/journal.pone.0010440.
- Carson RT. 2010. The environmental Kuznets curve: Seeking empirical regularity and theoretical structure. Review of Environmental Economics and Policy. 4:3–23. doi: https://doi.org/10.1093/reep/rep021
- Cole JR, McCoskey S. 2013. Does global meat consumption follow an environmental Kuznets curve? Sustainability: Science, Practice and Policy. 9:26–36.
- Dagevos H. 2016. Exploring flexitarianism: meat reduction in a meat-centred food culture. In Raphaely T, Marinova D, editors. Impact of meat consumption on health and environmental sustainability IGI Global. https://doi.org/https://doi.org/10.4018/978-1-4666-9553-5.ch012. p. 233–243.
- Dasgupta S, Laplante B, Wang H, Wheeler D. 2002. Confronting the environmental Kuznets curve. Journal of Economic Perspectives. 16:147–168. doi: https://doi.org/10.1257/0895330027157
- Frank J. 2008. Is there an “animal welfare Kuznets curve”? Ecological Economics. 66:478–491. doi: https://doi.org/10.1016/j.ecolecon.2007.10.017
- Genco L. 2016. A power conflict approach to animal cruelty: examining how economic power influences the creation of animal cruelty law (unpublished graduate thesis). University of South Florida.
- Gossard MH, York R. 2003. Social structural influences on meat consumption. Human Ecology Review. 10:1–9.
- Hartcher KM, Lum HK. 2019. Genetic selection of broilers and welfare consequences: a review. World’s Poultry Science Journal. doi:https://doi.org/10.1080/00439339.2019.1680025.
- Holst A, Martens P. 2016. Determinants of animal protection policy: a cross-country empirical study. Politics and Animals. 2:1–14.
- Hursthouse R. 1999. On virtue ethics. Oxford: Oxford University Press.
- Kasuga H, Takaya M. 2017. Does inequality affect environmental quality? Evidence from major Japanese cities. Journal of Cleaner Production. 142:3689–3701. doi: https://doi.org/10.1016/j.jclepro.2016.10.099
- Khan SAR, Zaman K, Zhang Y. 2016. The relationship between energy-resource depletion, climate change, health resources, and the environmental Kuznet’s curve: evidence from the panel of selected developed countries. Renewable and Sustainable Energy Reviews. 52:468–477. doi: https://doi.org/10.1016/j.rser.2016.04.061
- Kuznets S. 1955. Economic growth and income inequality. American Economic Review. 45:1–28.
- Lantz V, Martinez-Espineira R. 2008. Testing the environmental Kuznets curve hypothesis with bird populations as habitat-specific environmental indicators: evidence from Canada. Conservation Biology. 22:428–438. doi: https://doi.org/10.1111/j.1523-1739.2008.00885.x
- Lynch K. 2016. Wilful ignorance and self-deception. Philosophical Studies. 173:505–523. doi: https://doi.org/10.1007/s11098-015-0504-3
- [MAF] Ministry of Agriculture. 2011. Statement of intent 2011/2014. Wellington.
- McCollough J, He M, Bayramogl AT. 2016. Pollution havens and their relationship to the environmental Kuznets curve: the case of the US tyre industry. Economic Affairs. 36:258–272. doi: https://doi.org/10.1111/ecaf.12202
- McDonald JH. 2008. Handbook of biological statistics. [accessed 2020 Nov] http://www.biostathandbook.com/HandbookBioStatFirst.pdf.
- Mood A, Brooke P. 2010. Estimating the Number of Fish Caught in Global Fishing Each Year. Fishcount (fishcount.org.uk).
- Morris C. 2017. Taking the politics out of broccoli: debating (De)meatification in UK national and regional newspaper coverage of the meat Free Mondays Campaign. Socialogia Ruralis. doi:https://doi.org/10.1111/soru.12163.
- Morris MC. 2013. Improved animal welfare is more related to income equality than it is to income. Journal of Applied Animal Welfare Science. 16:272–293. doi: https://doi.org/10.1080/10888705.2013.768921
- Morris MC, Beatson P. 2011. Animal suffering in New Zealand: can science make a difference? Kotuitui: New Zealand Journal of Social Sciences Online. 6:124–132.
- Perry B. 2019. Household incomes in New Zealand: trends in indicators of inequality and hardship 1982 to 2018. Wellington: Ministry of Social Development.
- Pickett KG, Wilkinson RG. 2015. Income inequality and health: a causal review. Social Science & Medicine. 128:316–326. doi: https://doi.org/10.1016/j.socscimed.2014.12.031
- Pinker S. 2011. The better angels of our nature. New York: Viking.
- Rasli AM, Qureshib MI, Isah-Chikajia A, Zamand K, Ahmade M. 2017. New toxics, race to the bottom and revised environmental Kuznets curve: The case of local and global pollutants. Renewable and Sustainable Energy Reviews. 81:3120–3130. doi: https://doi.org/10.1016/j.rser.2017.08.092
- Rollin BE. 2016. A new basis for animal ethics: telos and common sense. Columbia Missouri: University of Missouri Press.
- Rozer J, Kraaykamp G, Huijts T. 2016. National income inequality and self-rated health: the differing impact of individual social trust across 89 countries. European Societies. 18:245–263. doi: https://doi.org/10.1080/14616696.2016.1153697
- Ruby MA, Alverenga MS, Rozin P, Kirby TA, Richer E. 2016. Attitudes towards beef and vegetarians in Argentina, Brazil, France and the USA. Appetite. 96:546–554. doi: https://doi.org/10.1016/j.appet.2015.10.018
- Sankoff P. 2005. Five years of the “new” animal welfare regime: Lessons learned from New Zealand’s decision to modernize its animal welfare legislation. Animal Law. 1:7–38.
- Sankoff P. 2009. The welfare paradigm: making the world a better place for animals? In: P. Sankoff, S. White, editor. Animal law in Australasia: a new dialogue. Annandale (NSW): The Federation Press; p. 7–34.
- Sarkodie SA. 2018. The invisible hand and EKC hypothesis: what are the drivers of environmental degradation and pollution in Africa. Environmental Science and Pollution Research. 25:21993–22022. doi: https://doi.org/10.1007/s11356-018-2347-x
- Stiglitz J. 2012. The price of inequality: how today’s divided society endangers our future. New York: W.W. Norton.
- Tsuzuki Y. 2014. Relationship between economic development and pollutant discharge in Southeast Queensland. In: Opportunities for the Critical Decade: Enhancing well-being within Planetary Boundaries. New Zealand Society for Ecological Economics 2013 Conference.
- Voiceless. 2018. The Voiceless Animal Cruelty Index. [accessed 2020 Nov] https://vaci.voiceless.org.au.
- Wang K, Wei Y-M. 2014. China’s regional industrial energy efficiency and carbon emissions abatement costs. Applied Energy. 130:617–631. doi: https://doi.org/10.1016/j.apenergy.2014.03.010
- Willett W, Rockstrom J, Loken B, Springmann M, Vermeulen S, Garnett T. et al. 2019. Food in the Anthropocene: the EATLancet commission on healthy diets from sustainable food systems. Lancet. 393:447–492.
- Wilkinson R, Pickett K. 2009. The spirit level: why equality is better for everyone. London: Allen Lane.
- Wilkinson R, Pickett K, de Vogli R. 2010. Equality, sustainability and quality of life. British Medical Journal. doi:https://doi.org/10.1136/bmj.c5816.
- Williams N. 2008. Affected ignorance and animal suffering: why our failure to debate factory farming puts us at moral risk. Journal of Agricultural and Environmental Ethics. 21:371–384. doi: https://doi.org/10.1007/s10806-008-9087-8
- World Animal Protection. 2020. The Animal Protection Index. https://api.worldanimalprotection.org/.