
ABSTRACT
In this article, we describe the life-time family structures, living arrangements, and residential mobility of 612 15-year-old New Zealanders and consider the differences in experiences of children born to younger and older mothers. All participants had a parent who is a member of the Dunedin Multidisciplinary Health and Development Study. Maternal age at the participant’s birth ranged from 16.3 to 41.0 years. Data on young people’s life-time care arrangements, household composition and shifts were collected from their primary caregiver via a life history calendar. Fewer than half lived in a household consisting of two biological parents and only a fifth had lived in a household consisting of only nuclear family members for all 15 years. Most also experienced multiple changes of address (median 6, range 1–27). Those born to older parents tended to have fewer changes to care arrangements and family structures but most young people experienced a substantial degree of change across their lives. These data indicate that complexity and change are normal in young New Zealanders’ living arrangements. We argue that conventional ideas about family structure should be re-examined.
Introduction
Our previous research (Sligo et al. Citation2017) indicated that young people in Aotearoa New Zealand experience a diverse, complex, and frequently changing set of living circumstances. This is important because this degree of complexity and change is poorly recognised by the policies, practice, and research aimed at supporting young people. In Aotearoa New Zealand, there has also been a general change in family structure over time, with people having children later, repartnering, and having children outside of marriage being more common than was the case in the 1970s (Law Commission Citation2017).
Both local and international findings (Pew Research Center, Citation2015; OECD Family Database Citation2019; Office for National Statistics Citation2019) indicate that diverse family structures are common and while this is acknowledged in some research (Cribb Citation2009; Pearce et al. Citation2018), others argue that the dominant Pākeha family structure in Aotearoa New Zealand is still the nuclear family (Elkington Citation2017). Regarding a nuclear family as the normative standard for family’s living arrangements fails to take into consideration cultural variations in parenting and family systems and structures, reflecting a set of values that do not reflect the current diversity of society (Elkington Citation2017). This perspective can create systemic social issues, including inadequate social support for families that are non-nuclear (Joy and Beddoe Citation2019).
This perspective also implicitly assumes that families with two parents living in the same household are the standard to which other family forms are (usually negatively) compared. One of the potential consequences of such assumptions is the pathologising of what is increasingly a normative human experience: living in a non-nuclear family. Thus, research in the field of family functioning includes work where divorce is considered to be a public health problem (e.g. Vezzetti Citation2016) and, despite its ubiquity, parental separation is considered to be an adverse childhood experience (Felitti et al. Citation1998; Purewal et al. Citation2016; Crouch et al. Citation2019). Similarly, younger parents (who are more likely to live in non-nuclear family arrangements) are often pathologised not only as ‘bad’ parents but also as social problems (McDermott and Graham Citation2005; Perrier Citation2013). However, nuclear families are not necessarily less complex: they are often not static and undergo periods of change: nor are they necessarily ‘well-functioning’ when they are static (Kelly and Emery Citation2003).
The extent of variability in family circumstances in populations has not been well described. Demographic changes to the average age of parenting (it is now 30 for first-time mothers in Aotearoa New Zealand (Statistics New Zealand Citation2018)), means that those parenting in their twenties are now considered younger parents. However, little research has focused on the experience of younger parents who are not adolescents. Rather, research on young parents has typically focused on teenage parents, despite the fact that adolescent birth rates have been in decline world-wide since the 1960s (Furstenberg Citation2016; World Bank Group Citation2020). Similarly, the needs of those who begin parenting after their teens but at younger than the median age are generally ignored in research, policy, and practice.
Research and social views on young parenting for Māori reveal discrimination and colonised viewpoints on young parenting (Strickett and Moewaka-Barnes Citation2012; Elkington Citation2017). However, young parenting is not necessarily perceived to be a disadvantage or to be problematic by young parents themselves, despite young parents being aware of a stigma against younger parenting (McDermott and Graham Citation2005; Strickett and Moewaka-Barnes Citation2012; Elkington Citation2017). Furstenberg (Citation2016) notes that births to young mothers are a product of disadvantage rather than a cause. That is, births to young women are more likely to occur if the young women are already socially and/or economically disadvantaged although the stigma associated with younger parenting may exacerbate any disadvantages already present (Barcelos and Gubrium Citation2014; Ellis-Sloan Citation2014). It should also be noted that there are cultural and other important social differences that are associated with family structure (including the timing of child birth and number of children in a family) and that these differences should be recognised in policy, practice, and research (Didham and Boddington Citation2011; Urale et al. Citation2019).
The widespread changes to family structure in recent decades mean that it is important for researchers and policy makers to continue to reflect on and understand what constitutes ‘family’ and also how this changes over the life course and with time. The current research extends our previous research on family complexity in a sample of 209 young people (Sligo et al. Citation2017) to include a larger, more representative participant group with a broader range of parental ages at the time of the child’s birth, allowing us to compare the lives of children of younger and older mothers. We aim to describe care and co-residence with biological parents and other co-residents, changes to care, and residential mobility across the first 180 months of life for 612 young people.
Methods
The Next Generation Study is a sub-study of the Dunedin Multidisciplinary Health and Development Study (Dunedin study), a longitudinal investigation of health and behaviour in a cohort of 1037 people born in 1972–1973 in Dunedin (Poulton et al. Citation2015). Since 2007, the Next Generation Study has invited each of the 15-year-old biological, step and foster children of this cohort to undertake a multidisciplinary assessment.
Participants
The Next Generation Study participants were born between 1991 and 2004. All participants are the children of Dunedin Study members and therefore not a random population sample. The age range of biological mothers (either Study Members or those who had a child with a Study Member) at the time of the Next Generation participant’s birth was between 16.3 and 41.0 years, with a median age of 26.3 years (the 306 participants with mothers younger than this median form our younger mothers group). The age range of all biological fathers was 17.5–48.3, with a median age of 27.9 at the time of the Next Generation participant’s birth (ages were missing for 31 fathers). Maternal and paternal ages at the time of their child’s birth were correlated at 0.59, p < 0.001. Forty-nine percent (299 of 612) of the participants are girls. At the time of their assessment 525 of the participants were living in New Zealand, 79 in Australia, and eight in other countries. Self-identified ethnicity data were collected using the New Zealand census question, which permits reporting of multiple ethnicities. Sixteen percent (n = 100) identified as Māori, 91% as New Zealand European/Pākeha (n = 556), and 5% (n = 32) as Pacific Island. Twenty-six percent (n = 162) identified with more than one ethnic group. At the time of their assessment 525 of the participants were living in New Zealand, 79 in Australia, and 8 in other countries.
Measures
The life history calendar (LHC) is a chart capturing the people that the Next Generation Study participant lived with, and where they lived between birth and their fifteenth birthday (180 months of data). Trained interviewers guided participants through a description their lives using the LHC as a visual aid (Sligo et al. Citation2011, Citation2017).
Biological parents
The proportion of the 180 months of each participant’s life spent living with each biological parent was calculated. We also assessed the parental care arrangements for each year of life using a modified version of the six care arrangement categories in Smyth et al. (Citation2004):
Category 1: Two biological parent household.
Category 2: Shared care arrangements, each biological parent has at least 35% care.
Category 3: Primary care. Children have a primary parental carer and less than 35% of the time with their other parent.
Category 4: Sole parent care. Children have no residential contact with one of their biological parents.
Category 5: No parental care. Less than 35% contact with both biological parents.
Category 6: Changing care and living arrangements during the course of a year.
Using these categories, we assessed the stability of care on a year-to-year basis (whether the care arrangement remained in place for consecutive 12 month periods or not), the life-time stability of the care arrangements, and the number of care arrangement changes.
Other measures
We also report on the nature, number and duration of the participants’ co-resident relationships (see Sligo et al. Citation2017 for details). Finally, we assessed how many locations each participant had lived in. Remaining at the same address for 180 months meant they had only lived in one location, shifting once meant that they had lived in two locations. Moving to shared care between households would also involve a shift in location.
Results
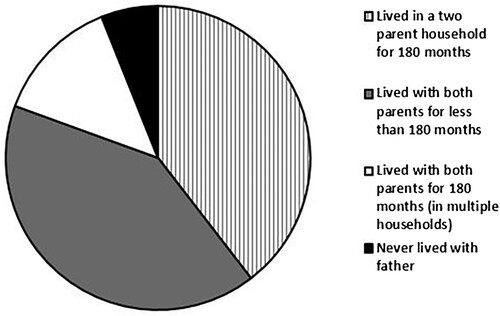
All 612 participants spent at least some of their lives living with their biological mother. Most had spent some time living with both parents. However, 6% never lived with their biological father (see ). Fifty-three percent of the participants (white segment and vertical bar segment combined) spent all 180 months living with both biological parents, although only 40% (vertical bar segment) lived with both parents in the same house for all 180 months: the others (13%) remained in shared parental care after parents separated. Children born to younger mothers were less likely to live in a two-parent house for 180 months and more likely to have a non-resident father (see Supplementary Figure 1a,b).
Figure 1. Time (in months) spent living with biological parents for the whole sample.
Parental care arrangements
Parental care arrangements for each year are shown in . At birth, almost 80% of the sample were in two-parent household care (Category 1), but by age 15, less than half lived in a two-parent household and almost 44% were either in sole parent or some form of multiple-resident care (Categories 2, 3, or 4). The number of children in primary or sole care continued to increase until around age 11 and remained at similar levels after that. At all ages, the biological mother was most likely to be the primary or sole carer (mothers were carers for all 62 children who had sole parents between birth and age one, 104 of 111 at age five, 116 of 123 at age 10 and 120 of 131 at age 15). Category 6 (changing arrangements) was high in the first year of life because participants’ parents often changed living arrangements shortly after the birth of their child. Changing care also increased as participants became teenagers.
Table 1. Care arrangements by year.
Fifty-seven per cent (348 of 612) of participants experienced a change in care arrangements during their lives: only 264 remained in the same care arrangement from birth to age 15 (). Movement between categories was common, so the participants in any given category at age 15 were not necessarily those who had been in that category at birth. For example, 288 (47%) participants were living with both of their biological parents at age 15 but 46 (16%) of these had a different care arrangement at a younger age.
Table 2. Stability of care from one 12-month period to the next for 612 young people.
Data for five-year spans and across the life-time are shown in . The final line shows the number of participants in each category who remained in that category their whole life. Of the 264 participants in the same care arrangement for all 180 months, 242 (92%) were in two-parent households. The other twenty-two were in the sole parent category, (data are only presented for teen’s care arrangements with their biological parents). Of the 37 participants who never lived with their biological father, 23 lived with their mother for their entire lives. The other 14 participants changed care categories either because they entered a care arrangement with other family members, boarded elsewhere, or spent time in state-provided care.
While some changes may have been minor (such as increasing contact with the non-primary caregiver parent), others were more extreme (changing primary caregiver completely). Some participants experienced very frequent changes to their caregiving arrangements on a year-by-year basis (). Not living with either biological parent for the entire 180 months was more common among participants whose mothers were younger than the median age of 26.3 at the participant’s time of birth 20.6% vs 4.9% for those born to older mothers.
Table 3. Frequency of change to care arrangement for 612 young people.
Other household members
In addition to their biological parents, most young people lived with a wide range of people over their lives: the median number of co-residents was seven (). The 306 participants with younger mothers had a median of 9 co-residents (range of 2–33) and a total of 2916 people who have lived with them, whereas participants born to the 306 older mothers had a median of six co-residents (range 2–28, total 1939).
Table 4. Relationship of 4855 cohabitants to the participants.
We also assessed the number of types of different relationships participants had with co-residents. Living in a ‘nuclear family’ (as conventionally defined) consists of three relationship types (mother, father and full biological siblings). Only 126 (20.6%) lived their whole lives in households containing only nuclear family members.
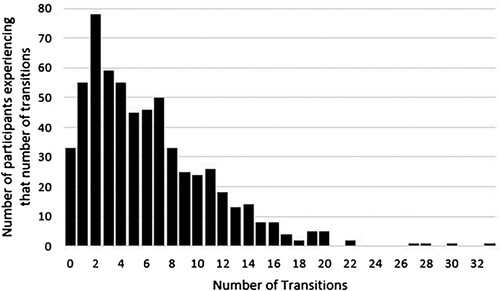
The number of people that participants had lived with for part (but not all) of their lives is shown in . In order to illustrate the number of interpersonal transitions, the counts exclude parents, older siblings and other co-residents that participants had always lived with, but the addition of a younger sibling is included because this marks a transition for the participant. The median number of transitions (people moving into or out of a household/s where a participant lives) a participant experienced was 5 (range 0–33), although it was higher in younger than older mothers (see Supplementary Figure 2a,b).
Figure 2. Frequency of the different people living with the participant in 180 months (where ‘count’ on the y axis refers to the number of participants with that number of cohabitants who moved in or out) for the whole sample.
Moving residence
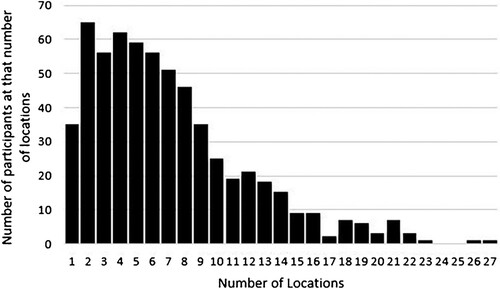
The median number of locations lived in by participants is 6 (range 1–27) for the whole sample, which approximates to a shift in residence every two and a half years from birth to age 15 (). These numbers are slightly inflated by the fact that some participants lived in more than one house due to shared or primary care arrangements. (See Supplementary Figure 3a,b for differences by maternal age.)
Figure 3. Number of locations that young people have lived in by age 15 (where ‘count’ on the y axis refers to the number of participants with who have lived in that number of locations).
Discussion
By age 15 over half of the young people had experienced a change in their care arrangements, 80% lived with a non-nuclear family member and 94% had moved house at least once, and over half had moved more than 5 times. This high rate of change and residential mobility is echoed in other, younger, New Zealand samples such as the Growing Up in New Zealand cohort (Kukutai et al. Citation2020; Morton et al. Citation2020) perhaps indicating this complexity is becoming more common.
As noted, this work includes 209 people for whom data have already been reported (Sligo et al. Citation2017). The median maternal age is higher in the current, larger sample and overall measures indicate that complexity and change are lower among those with older parents. For example, the original sample of 209 participants had more half-siblings than biological siblings, but this is no longer the case for the larger sample. Analysing the larger sample by grouping older and younger mothers (older or younger than the median of 26.3 years) shows that the measures of complexity and change are higher for those participants born to younger mothers.
Overall, however, less than half of participants lived in a household with two biological parents for their whole lives suggesting that a rethinking of how parental separation is conceptualised is required. Complexity and variability of experience associated with care arrangements and household composition are normative. This is not to imply that normative experiences are necessarily good or bad, merely that simple distinctions between those that live in a two biological parent household and those who do not may not adequately capture adversity (White et al. Citation2019). In the future, critical consideration should be given to whether a dichotomous rating of the experience of parental separation is an appropriate way to capture young people’s experience of their family lives. Further research is required to explore the qualitative experiences associated with different and changing family structures, particularly as this research indicates that parental separation is not the only reason family structure changes. Most families experience instability regardless of structure and this seems to be particularly pronounced in families where mothers are younger.
All analyses were on the biological mother’s age (333 Dunedin Study member mothers, 279 mothers who were not Dunedin Study members) at the time of the participant’s birth so this research does not account for multiple children in families. Younger children in multi-child families will have at least one parent who is older at the time of their birth than that parent was when their older biological or half-siblings were born. We also acknowledge that due to the sample being children of Dunedin Study members the sample is inherently biased towards younger parenting due to the age of the Dunedin Study cohort.
Another limitation of the present research is that while it provides a descriptive account of complexity and change, we have not attempted to describe qualitative experiences. Advantage or disadvantage is likely to vary according to whether arrangements occur from necessity or choice. It is also not necessarily the case that household stability represents a lack of adversity (Kelly and Emery Citation2003). A further limitation is that, while there is more cultural diversity amongst the Next Generation Study participants than there is among their Dunedin Study member parents, at least one of their parents was born in New Zealand, which means that they are probably not culturally representative of their generation, which includes many first- and second-generation New Zealanders. Lastly, the median age of both mothers and fathers at the birth of their children in this sample was slightly lower than the median age in the wider population of Aotearoa New Zealand (approximately 30 years: Statistics New Zealand Citation2018). It should be acknowledged however that median age of parenting varies by ethnicity (Statistics New Zealand Citation2018) and that even the consideration of normative ages for child bearing are subject to culturally held assumptions and biases (Didham and Boddington Citation2011).
We separated our analyses on the basis of maternal, not paternal age because maternal ages were available for all participants, whereas a proportion of fathers’ ages were not known. The under-representation of fathers is an issue for much family research work (see for examples: Beckmeyer and Russell Citation2017; Hadfield and Nixon Citation2018). This means that fathers’ roles and relationships with them are often described by other informants or inferred. It is also often the case fathers’ care arrangements with their children are more variable than maternal care arrangements (Hadfield and Nixon Citation2018), which has been under-reported because of the relative absence of father data. In our study, birthdate data was missing almost exclusively for fathers when they had never resided with their children. Although we did not formally collect information on why fathers were non-resident, in almost half of cases mothers volunteered it. Among the reasons were issues with alcohol/drugs/gangs or interpersonal violence. This reminds us again that using the nuclear family as a standard fails to acknowledge that other family formations may be more beneficial to wellbeing.
The strength of the present work is that it was able to compare families with younger and older parents. Secondly, by taking a whole life perspective, we were able to provide insights into the change and complexity that families experience in a way that static measures of family structure do not.
These data indicate that complexity and change are normative in young New Zealanders’ living arrangements. We argue that conventional ideas about family structure should be re-examined. This and other work (e.g. Kelly and Emery Citation2003; Metzler et al. Citation2017; Joy and Beddoe Citation2019; White et al. Citation2019) indicate that researchers should consider a variety of lived family experiences and structures, each with strengths and challenges, rather than assuming there is a norm by which family structure can be measured.
Acknowledgements
The authors would like to thank the Dunedin and Next Generation Study members and their families and friends for their participation and ongoing support. We would also like to thank Professor Richie Poulton, the Director of the Dunedin Study. We are grateful to the study interviewers who collected the data and particularly thank Reg Hume for his work on the database used to store and extract the LHC data.
Disclosure statement
No potential conflict of interest was reported by the author(s).
Additional information
Funding
References
- Barcelos CA, Gubrium AC. 2014. Reproducing stories: strategic narratives of teen pregnancy and motherhood. Social Problems. 61(3):466–481.
- Beckmeyer JJ, Russell LT. 2017. Family structure and family management practices: associations with positive aspects of youth well-being. Journal of Family Issues. 39(7):2131–2154. doi:https://doi.org/10.1177/0192513X17741921.
- Cribb J. 2009. Focus on families: New Zealand families of yesterday, today and tomorrow. Social Policy Journal of New Zealand. 35: 4–16.
- Crouch E, Probst JC, Radcliff E, Bennett KJ, McKinney SH. 2019. Prevalence of adverse childhood experiences (ACEs) among US children. Child Abuse & Neglect. 92:209–218. doi:https://doi.org/10.1016/j.chiabu.2019.04.010.
- Didham R, Boddington B. 2011. Fertility, ethnic diversification and the WEIRD paradigm: recent trends in Maori fertility in New Zealand. New Zealand Population Review. 37:89–104.
- Elkington A. 2017. The everyday lives of young Māori fathers: an explorative study. Journal of Indigenous Wellbeing Te Mauri-Pimatiswin. 2(3):3–17.
- Ellis-Sloan K. 2014. Teenage mothers, stigma and their ‘presentations of self’. Sociological Research Online. 19(1):1–13.
- Felitti VJ, Anda RF, Nordenberg D, Williamson DF, Spitz AM, Edwards V, Marks JS. 1998. Relationship of childhood abuse and household dysfunction to many of the leading causes of death in adults: the adverse childhood experiences (ACE) study. American Journal of Preventive Medicine. 14(4):245–258.
- Furstenberg F. 2016. Reconsidering teenage pregnancy and parenthood. Societies. 6(4):33–40.
- Hadfield K, Nixon E. 2018. He's had enough fathers: mothers’ and children's approaches to mothers’ romantic relationships following the dissolution of previous partnerships. Journal of Family Issues. 39(1):271–295.
- Joy E, Beddoe L. 2019. ACEs, cultural considerations and ‘common sense’ in Aotearoa New Zealand. Social Policy and Society. 18(3):491–497. doi:https://doi.org/10.1017/S1474746419000046.
- Kelly JB, Emery RE. 2003. Children's adjustment following divorce: risk and resilience perspectives. Family Relations. 52(4):352–362. doi:https://doi.org/10.1111/j.1741-3729.2003.00352.x.
- Kukutai T, Prickett K, Atatoa-Carr P, Rata A. 2020. Family structure and change in early childhood and the wellbeing of Tamariki Maori. New Zealand Population Review. 46:70–99.
- Law Commission. 2017. Relationships and families in contemporary New Zealand. New Zealand Law Commission: Wellington.
- McDermott E, Graham H. 2005. Resilient young mothering: social inequalities, late modernity and the “problem” of “teenage” motherhood. Journal of Youth Studies. 8(1):59–79.
- Metzler M, Merrick MT, Klevens J, Ports KA, Ford DC. 2017. Adverse childhood experiences and life opportunities: Shifting the narrative. Children and Youth Services Review. 72:141–149. doi:https://doi.org/10.1016/j.childyouth.2016.10.021.
- Morton SMB, Walker CG, Gerritsen S, Smith A, Cha J, Atatoa Carr P, Chen R, Exeter DJ, Fa’alili-Fidow J, Fenaughty J, et al. 2020. Growing up in New Zealand: a longitudinal study of New Zealand children and their families. Now we are eight. Growing Up in New Zealand: Auckland.
- OECD Family Database. 2019. Age of mothers at child birth and age-specific fertility. http://www.oecd.org/els/family/database.htm.
- Office for National Statistics. 2019. Families and households in the UK. https://www.ons.gov.uk/peoplepopulationandcommunity/birthsdeathsandmarriages/families/bulletins/familiesandhouseholds/2019.
- Pearce LD, Hayward GM, Chassin L, Curran PJ. 2018. The increasing diversity and complexity of family structures for adolescents. Journal of Research on Adolescence. 28:591–608. doi:https://doi.org/10.1111/jora.12391.
- Perrier M. 2013. No right time: the significance of reproductive timing for younger and older mothers’ moralities. The Sociological Review. 61:69–87.
- Pew Research Center. 2015. Parenting in America: outlook, worries, aspirations are strongly linked to financial situation. https://www.pewsocialtrends.org/2015/12/17/1-the-american-family-today/.
- Poulton R, Moffitt TE, Silva PA. 2015. The Dunedin Multidisciplinary Health and Development Study: overview of the first 40 years, with an eye to the future. Social Psychiatry and Psychiatric Epidemiology. 50(5):679–693. doi:https://doi.org/10.1007/s00127-015-1048-8.
- Purewal SK, Bucci M, Gutiérrez Wang L, Koita K, Silvério Marques S, Oh D, Burke Harris N. 2016. Screening for adverse childhood experiences (ACEs) in an integrated pediatric care model. Zero to Three. 37(1):10–17.
- Sligo JL, Buxton J, McComb S, Rothstein D, Salter GH, Hancox RJ. 2011. How do we capture 15 years of complex and meaningful data about young people's lives? Kotuitui: New Zealand Journal of Social Sciences Online. 6(1–2):37–49. doi:https://doi.org/10.1080/1177083x.2011.614624.
- Sligo JL, McAnally HM, Tansley JE, Baxter JM, Bolton AE, Skillander KM, Hancox RJ. 2017. The dynamic, complex and diverse living and care arrangements of young New Zealanders: implications for policy. Kotuitui: New Zealand Journal of Social Sciences Online. 1–16. doi:https://doi.org/10.1080/1177083X.2016.1196715.
- Smyth B, Caruana C, Ferro A. 2004. Father–child contact after separation: profiling five different patterns of care. Family Matters. 67:20–27.
- Statistics New Zealand. 2018. Parenting and fertility trends in New Zealand: 2018. https://www.stats.govt.nz/reports/parenting-and-fertility-trends-in-new-zealand-2018.
- Strickett E, Moewaka-Barnes H. 2012. Marginalising Māori parents. Auckland: Massey University.
- Urale PWB, O'Brien MA, Fouché CB. 2019. The relationship between ethnicity and fertility in New Zealand. Kotuitui: New Zealand Journal of Social Sciences Online. 14(1):80–94. doi:https://doi.org/10.1080/1177083X.2018.1534746.
- Vezzetti VC. 2016. New approaches to divorce with children: a problem of public health. Health Psychology Open. 3(2):1–13.
- White S, Edwards R, Gillies V, Wastell D. 2019. All the ACEs: a chaotic concept for family policy and decision-making? Social Policy and Society. 18(3):457–466. doi:https://doi.org/10.1017/S147474641900006X.
- World Bank Group. 2020. Adolescent fertility rate (births per 1, 000 women ages 15-19). https://data.worldbank.org/indicator/SP.ADO.TFRT.