
 ?Mathematical formulae have been encoded as MathML and are displayed in this HTML version using MathJax in order to improve their display. Uncheck the box to turn MathJax off. This feature requires Javascript. Click on a formula to zoom.
ABSTRACT
Brazilian President Jair Bolsonaro has consistently dismissed the severity of COVID-19, failing to offer guidance and leadership to the governors of federative units responsible for containing the virus and making Brazil an illustrative case of societies most affected by the pandemic due to political negligence and inaction. This article presents a subnational analysis of Brazil’s federative units, examining the effects of policy responsiveness and political capacity on COVID-19 mortality. Specifically, this analysis identifies a conditional relationship between policy effectiveness and governments’ ability to reach and convince their populations to abide by policy recommendations, controlling for other leading explanations of COVID-19 severity (i.e. demographic characteristics, behavioral trends, and preparedness). This work implements subnational measures of political capacity to capture heterogeneity in government responses within the country. Results from random effects regression and a Generalized Additive Model add to recent findings on the role of effective governance in mitigating COVID-19 severity.
RÉSUMÉ
Le président brésilien Jair Bolsonaro n'a cessé de faire abstraction de la gravité de la COVID-19, n'offrant pas de conseils et de direction aux gouverneurs des unités fédératives chargées de contenir le virus et faisant du Brésil un cas illustratif des sociétés les plus touchées par la pandémie en raison de la négligence et de l'inaction politiques. Cet article présente une analyse sous-nationale des unités fédératives du Brésil, examinant les effets de la réactivité et de la capacité politiques concernant la mortalité de la COVID-19. Plus spécifiquement, cette analyse identifie un rapport conditionnel entre l'efficacité politique et la capacité des gouvernements à atteindre et à convaincre leurs populations de se conformer aux recommandations politiques, en contrôlant les autres explications principales de la gravité de la COVID-19 (c'est-à-dire les caractéristiques démographiques, les tendances comportementales et la préparation). Ce travail met en œuvre des mesures sous-nationales de la capacité politique pour saisir l'hétérogénéité des réponses du gouvernement au sein du pays. Les résultats d'une régression à effets aléatoires et d'un modèle additif généralisé viennent s'ajouter aux conclusions récentes de travaux sur le rôle d'une gouvernance efficace dans l'atténuation de la gravité de la COVID-19.
Introduction
Brazil, the most populous country in Latin America, is among the countries most affected by the COVID-19 pandemic. As of November 1st, 2020, Brazil reported 5,545,705 cases and 160,074 deaths due to COVID-19, positioning it with the 18th highest number of COVID-19 attributed deaths per capita in the world (Dong, Du, & Gardner, Citation2020). As new waves of infections continue to sprout around the world, policy makers and politicians have struggled to implement response plans that effectively mitigate the virus’ mortality. Brazil is an illustrative case: President Jair Bolsonaro has consistently dismissed the severity of COVID-19 and has failed to offer guidance and leadership to the governors of states or federative units who are responsible for containing its spread. Despite Brazil’s exemplification of failed policy implementation and government negligence, within-country variance in COVID-19 mortality across federative units is evidence of the relevance of state-specific characteristics that have allowed some subnational governments to be more successful (or less unsuccessful) in mitigating the virus’ severity.
In this paper, I argue that current literature examining the determinants of COVID-19 severity has overlooked structural and political factors that pre-condition some societies to be successful in their fight against the virus. I provide evidence that, in addition to healthcare preparedness, policy stringency, and economic resource availability, governments with high political capacity are more successful in mitigating COVID-19 severity. Specifically, I take a lower-level approach to evaluate the extent to which subnational governments have successfully implemented policy responses. The common nation-level approach in the literature assumes homogeneity within countries’ COVID-19 response strategies. However, in countries such as Brazil where subnational governments have assumed the responsibility for policy-making and implementation, homogeneity may be an incorrect assumption.
In the following sections, I discuss existing explanations to the varying COVID-19 mortality levels across societies and propose additional factors that can supplement these explanations. I also propose and empirically test models that include structural and political variables to determine their importance to government efforts against COVID-19.
Established determinants of COVID-19 mortality levels
Up to this point, literature on COVID-19 that incorporates economic and social factors into epidemiological models has largely focused on social behavior (i.e. mask-wearing and social-distancing), public health policy stringency and timeliness, and demographic characteristics. Among demographic characteristics, analyses of societal age structures have provided the most consistent findings: the elderly are especially vulnerable to the virus. The increasing risk in older population groups is reinforced by the fact that older people are more likely to have underlying health conditions such as respiratory and cardiovascular diseases (Kang & Sook In, Citation2020; Liu et al., Citation2020; Roser, Ritchie, Ortiz-Ospina, & Hasell, Citation2020). In Brazil, the age risk is also observed: about 72% of COVID-19 related deaths were people aged 60 or older (Queiroz & Baptista, Citation2020). In comparison to other severely-affected countries, however, this percentage is lower in part due to Brazil’s younger population: only 13% of the population are above the age of 60 (CitationCIA, 2020).
To analyze the effect of public policy measures, institutions such as the University of Oxford and the University of Miami’s COVID-19 Observatory have developed indicators of policy stringency to understand the cross-national and cross-temporal evolution of government responses to the pandemic. The University of Oxford’s COVID-19 Government Response Tracker (OxCGRT) offers a “Stringency Index”, calculated by aggregating individual sub-indices of relevant government policies including restrictions on public events and gatherings, schools and work-place closures, and travel bans (Hale et al., Citation2020a).
Using the Stringency Index to examine the mitigating effect of policy responses on the pandemic’s mortality toll, Hale et al. found that the early implementation of more stringent policies can contain the growth of fatality (Citation2020b). Similar studies support these findings, concluding that, in addition to population characteristics, low levels of national preparedness, as well as weaker and late government interventions, are associated with higher COVID-19 infections and mortality rates (Chaudhry, Dranitsaris, Mubashir, Bartoszko, and Riazi Citation2020; Dergiades, Milas, Mossialos, and Panagiotidis Citation2020). Replicating the University of Oxford’s initiative, the University of Miami’s COVID-19 observatory developed a “Public Policy Adoption Index” specific to Latin American countries summarizing “the actions of state governments to promote physical distance” (Citation2020). Their calculation also considers government policies related to stay-at-home requirements and restrictions on travel and gatherings, in addition to population mobility trends and the numbers of days since each policy’s implementation. The Observatory offers this policy adoption index for subnational governments as well.
Despite these studies’ consideration of relevant country-level characteristics such as healthcare system preparedness, population age composition, and economic development level, they do not explain the extent to which government policies are effectively enforced (Hale et al., Citation2020b). Exclusively relying on these indices to measure the effect of policy responses is misleading since a policy’s implementation is not equivalent to the population abiding by the policy. Thus, the application of these measures in policy research should be supplemented with indicators of the actual level of success of policy implementation.
Google’s Community Mobility Reports, which present mobility trends throughout the COVID-19 pandemic, provide potential indicators of the extent to which individuals follow policy recommendations. The mobility indicators are calculated by comparing data on visits to different types of locations such as workplaces, grocery stores and pharmacies, and residential areas to a median value of a five-week period representing pre-COVID-19 levels (Google LLC, Citation2020). These trends, obtained from phone tracking data, provide insights into responses to stay-at-home orders.
In general, these explanations have failed to account for differences among countries with similar demographic structures and countries that have implemented similar response strategies. Recognizing the importance of the structural characteristics that predispose governments to success with policy implementation, Stowell et al. (Citation2020) utilize political capacity indicators to measure the ability of governments to mobilize the population to advance their policy goals as determinants of COVID-19 policy success. Overall, relative political capacity indicators have been widely applied as measures of political performance in the areas of demographic change, socioeconomic change, global and civil conflict, and economic development (Arbetman and Kugler Citation1997; Benson and Kugler Citation1998; Feng, Kugler, and Zak Citation2000, Swaminathan and Thomas Citation2007).Footnote1
This analysis thus incorporates relative political capacity into the evaluation of policy effectiveness in Brazil’s subnational units. Previous studies have overlooked the heterogeneity of governance and policy approaches at the subnational level, assuming homogeneity within countries. However, it is especially important to examine subnational units separately when policy-making and implementation responsibilities belong to them. Furthermore, a complete analysis should not exclude measures of government capacity as an essential precondition for the success of policy implementation. The following sections will consequently present empirical methods to test the conditional relationship of policy and political capacity, as well as control for other widely-accepted determinants of the pandemic’s death toll.
Data and model specifications
The extent to which Brazil’s Federative Units have been able to minimize the mortality levels of COVID-19 is examined employing the following statistical model:
Severity: COVID-19 attributed deaths
To measure severity, I collected COVID-19 daily deaths data from the day of each federative unit’s first reported death to the date of this study (November 1st, 2020). The Health Ministry of Brazil (Ministério da Saúde do Brasil, Citation2020) has made this data available to the public through an interactive panel that is updated daily. Ideally, a measure of excess deaths would be a better indicator of the actual death toll due to the pandemic. Unfortunately, data of this kind was not available for the dates of this study. To correct for possible data reporting issues (e.g. deaths reported on the incorrect date), I aggregate the daily data into weekly deaths. After aggregation, each federative unit has between 29 and 32 weeks of daily deaths data depending on the date of the first death. To prevent obtaining non-normal errors during the regression analysis, I log-transform weekly new deaths given its skewed distribution.
Demography, affluence, and urbanization
As discussed previously, demographic characteristics of societies like age structure are among the main aggravating factors of virus mortality. Over the last decade, Brazil has exhibited a rapidly aging population with an 18% increase in the number of people aged 60 or older since 2012 (Paradella, Citation2018). However, Brazil is still a relatively young country compared to others that were also severely impacted by COVID-19 like some European countries. About 2% of the population are 80 and older and 14% are 60 and older. Accordingly, I try both population groups (aged 60 and older and aged 80 and older) as demographic controls. Both are expected to have a positive effect by increasing the number of deaths. GDP per capita is also included as a measure of affluence because of the traditional assumption that wealthier societies possess better healthcare capabilities to confront the crisis and minimize the virus’ severity. Lastly, because of the nature of COVID-19 transmission, a measure of urbanization controls for the increased risk of infection due to crowding in urban areas, which would have a positive effect on the dependent variable.
Mobility and preparedness
Available measures of healthcare system preparedness tend to be limited. Measures of bed availability have been widely used as indicators of hospital capacity (Khera et al,, Citation2020; Palamin and Marson, Citation2020). The number of unoccupied beds (including both ICU and non-ICU beds), available from the Institute for Health Metrics and Evaluation (Citation2020), is calculated by subtracting the average number of total beds normally used at each federative unit from the total number of beds that exist there. Since this variable is calculated with averages, it is time-invariant (i.e. values do not change as deaths or infections increase/decrease). This variable, as a measure of preparedness, is thus expected to reduce mortality levels.
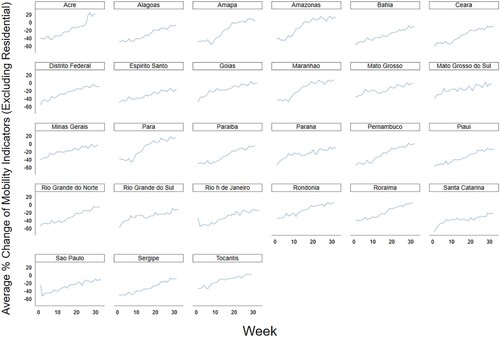
Google’s Mobility Reports (2020), as discussed previously, can serve as an indicator of individuals’ behavior and actual compliance with policy recommendations. , for example, shows the change in people’s movement to and from workplaces, grocery stores, retail businesses, public transportation stations, and parks for the period of study. The behavior of the federative units seems to be homogenous, with an initial substantial decrease of movement that then consistently increased to normal levels by the beginning of November 2020. Some federative units, such as Santa Catarina, exhibited an increasing but less rapid trend to normal levels of mobility. The mobility average used to build the figure does not include movement to and from residential areas since this component moves in the opposite direction. As such, I expect to see a positive relationship between severity and the lagged value of mobility, with less deaths occurring as people stay home.
Figure 1. Mobility % Change by Federative Unit.
Policy responsiveness
Also utilizing Oxford’s Stringency Index, Stowell et al. (Citation2020) construct a policy measure that takes into account the context of the pandemic’s severity. It is calculated incorporating a context component by dividing the Stringency Index by the lagged value of infections as follows:
This measure offers the same information as the Stringency Index, but it also evaluates the policy in proportion to the level of infection in the subnational unit. Again, this variable is also logged to normalize its skewed distribution. I calculate this measure with the University of Miami’s COVID-19 Observatory Public Policy Adoption Index. The effect of policy responsiveness is expected to be conditional on the government’s level of political capacity. As such, this relationship is operationalized with an interaction term.
Political capacity
To measure political capacity, I calculate the Relative Political Reach (RPR) indicator, first proposed and modelled by Organski (Citation1958) and Arbetman and Kugler (Citation1997). RPR establishes “the degree to which the government influences and penetrates into the daily lives of individuals” to mobilize them to advance policy goals (Arbetman-Rabinowitz et al., Citation2011: 14-20). I calculate RPR following the model specified in Arbetman and Kugler (Citation1997) and Kugler et al. (Citation2012: 40):
where the ratio of economically active population to total population is regressed on the unemployment rate, the secondary education attainment rate education, the population younger than 16 years old (Brazil’s working age) and urbanization percentage. The theoretical rationale behind this measure considers that by avoiding taxes and regulations, individuals in the informal sector avoid government scrutiny, exhibiting attitudes of distrust towards the authorities. Using the activity rate (i.e. the portion of population who are economically active) as the dependent variable, we obtain the predicted activity rate for each state, representing the portion of the population that the government can convince to abide by their policy goals.Footnote2 The final RPR value is calculated by dividing the actual activity ratio by the predicted values. Accordingly, an RPR lower than 1 will indicate under-performance in comparison to the predicted value, while a value larger than 1 will reflect over-performance. This calculation is based on the assumption that a large informal labor sector reduces the government’s leverage on the labor force. I then expect this variable to moderate the effect of policy responsiveness in preventing COVID-19 mortality, with an increase in its substantive effect as RPR increases.
The estimation techniques of this study include both random effects regression and a Generalized Additive Model (GAM).Footnote3 Hypothesis testing is also implemented for a preliminary comparison of severity between politically capable and non-capable federative units. The use of a random effects regression with time-series cross-sectional data allows for the effects of time-invariant variables to be estimated, which is essential for a structural comparison of the federative units. The use of a random effects model implies the assumption that the unobserved characteristics of the federative units do not affect the behavior of the explanatory variables. Accordingly, controlling for unobserved effects that might be correlated with the error term is necessary to avoid biased estimates (Wooldridge, Citation2012). I thus include in the model the aforementioned controls often found in the existing literature that might be affecting the explanatory variables. To account for the nonlinear relationship between time and weekly deaths, I additionally include controls for week and week squared in the random effects model. Given that a semi-parametric technique can more appropriately model this non-linear relationship, the robustness of the resulting coefficients is examined with a GAM, which models the week variable non-parametrically while still estimating the effect of the remaining covariates linearly.Footnote4
Results
Preliminary analysis: hypothesis testing
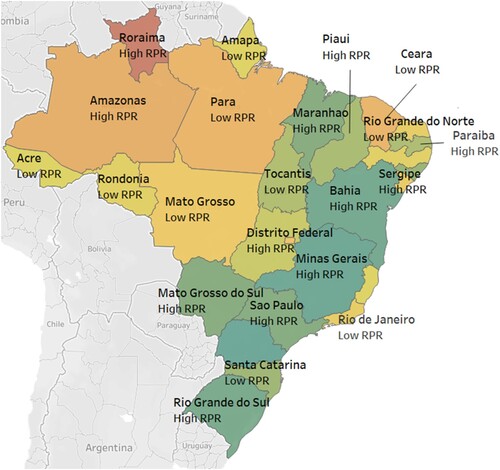
To compare mortality levels group averages of cumulative mortality and maximum weekly deaths between highly capable and less capable federative units, I divide the sample to conduct hypothesis testing. displays a choropleth map colored by the maximum value of weekly deaths per 100,000 individuals that each federative unit had during the period of study. A greener color indicates fewer deaths, and a redder color indicates more deaths. The federative units are also labeled as “high RPR” if their RPR score is larger than or equal to the median value, while those with RPR scores below the median value are labeled “low RPR.” Most federative units with high political capacity exhibit the lowest maximum weekly deaths relative to all federative units. However, Roraima and Amazonas are among the federative units with the highest maximum deaths, despite being categorized as politically capable.Footnote5
Figure 7. Map of Brazil by Maximum Weekly Deaths and RPR score.
To establish whether there is a difference between the severity levels of both groups, I run two t-tests comparing the mean values of maximum daily and cumulative deaths per 100,000 individuals. Tables A and B show the results of the hypothesis tests. Both tests provide evidence to reject the null hypothesis that the difference between mean values of severity for high vs low RPR federative units is zero. On the contrary, both alternative hypotheses are statistically significant: the difference between federative units with low political capacity and those with high political capacity is larger than zero.
Regression
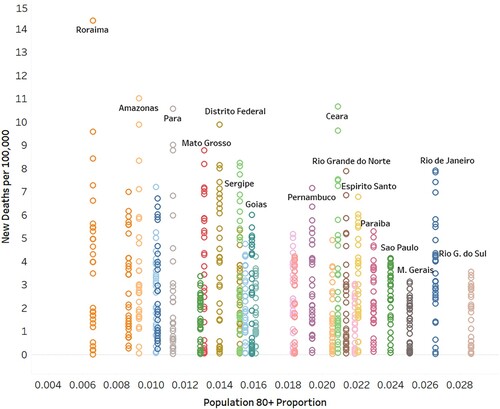
Table C presents results of random effects regressions with an AR(1) disturbance and standardized coefficients, as well as the GAM results.Footnote6 All variables in Model 1 except for excess bed capacity are statistically significant. Policy responsiveness and GDP per capita have the largest substantive effect in reducing COVID-19 deaths. As expected, urbanization levels increase the severity given the nature of transmission of the virus. Urban regions tend to have higher population densities, which in turn increase the risk of transmission. The directionality of the elderly coefficient is negative, contrary to expectations and to the findings of existing literature.Footnote7 A closer examination of the relationship between mortality and the percent of the population aged 80 and older in Brazil’s Federative Units (displayed in ) indicates that federative units with older populations had lower mortality rates during the period of study. The federative unit of Roraima further increases the negative slope of the relationship with 14.4 deaths per 100,000 during week 14 of the analysis. Although an examination of Brazil’s COVID-19 deaths by age group is beyond the scope of this analysis, a 0.58 correlation between available beds and the percent of population aged 80 and older might indicate a higher level of preparedness by federative units with older populations.
Figure 2. Population 80+ vs. New Weekly Deaths per 100,000.
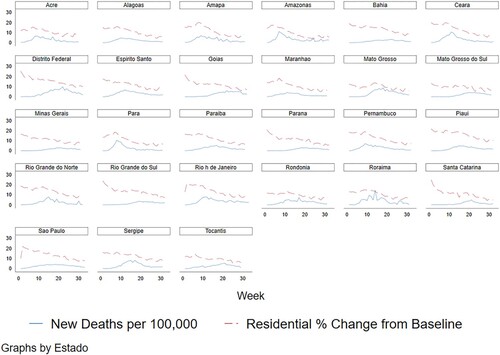
Also contrary to expectations, the mobility indicator has a negative relationship with deaths, as if more movement decreased severity. Nevertheless, the reversed sign could be attributed to endogeneity.Footnote8 Since the change in mobility trends is also responsive to the mortality of the virus, there is evidence for simultaneity even when the variable is lagged. As shown in , movement behavior was also highly responsive to the number of deaths observed for some federative units such as Amazonas, Mato Grosso, and Para. Model 3 drops the week and week squared variables. Although the directionality and relative importance of the coefficients is not affected, the effect of responsiveness and RPR is inflated, reflecting the variance that was also being captured by time.
Figure 3. Residential Mobility and New Deaths per 100,000 individuals.
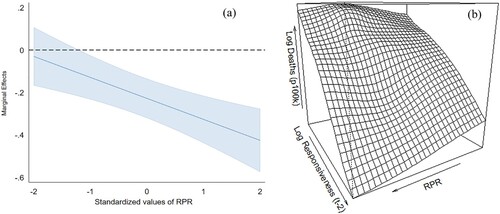
The addition of the interaction term in Model 2 increases the explained within variance of daily new deaths per 100,000 individuals by five percent, and the coefficient of responsiveness is also increased. The variance in new weekly deaths for each federative unit over time is thus better explained when the model accounts for the conditional relationship between political capacity and policy responsiveness. Interpreting the individual coefficients of the interaction’s constituent terms as their effect when the moderating variable is zero, RPR does not have a statistically significant effect on lessening deaths when responsiveness is zero (when the policy index to number of infections ratio is equal to one) (Brambor, Citation2006; Cohen et al, Citation2002). Politically capable governments need policies with stringency levels that are responsive to the observed severity in order to mitigate the virus. In other words, political capacity is not enough to prevent deaths when policy responsiveness is deficient. However, RPR is still necessary for the effectiveness of policy responsiveness. The marginal effects plot of responsiveness on the number of deaths per 100,000 individuals, exhibited in (a), suggests that the effect of responsiveness is not statistically significant at low levels of RPR. Only for federative units with standardized RPR higher than −1.2 (equivalent to 0.9 unstandardized RPR) will responsiveness have an effect in minimizing deaths. Acre, Alagoas, Ceara, Rondonia, and Tocantis all have RPR lower than 0.9. Moreover, as RPR increases, the effect becomes more negative, further reducing the number of deaths per 100,000 individuals. For federative units with RPR scores of 1.1 (equivalent to 1.07 standardized RPR) as an example, the effect of responsiveness is around −0.33, such as in the case of Bahia. (b) also shows a perspective plot generated with the GAM estimates of the relationship between logged deaths (per 100,000), RPR, and logged responsiveness. Deaths are at their minimum when political capacity and policy responsiveness are at their maximums.
Figure 4. (a) RE Marginal Effects of Responsiveness at increasing levels of RPR (95% Confident Intervals) and (b) GAM Perspective Plot.
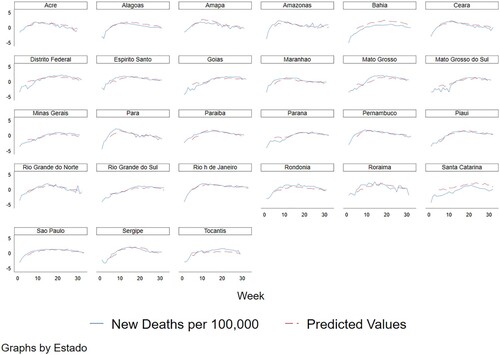
additionally presents predictive margins of the logged values of new deaths per 100,000 individuals for different levels of responsiveness. At RPR values greater than 0.5, high levels of responsiveness will yield the lowest number of deaths. Contrarily, low levels of responsiveness result in the highest severity. To evaluate the fit of the model, shows the actual values of logged new deaths per 100,000 overlayed over the predicted values of a model with unstandardized coefficients.Footnote9 The predicted values closely match the actual values. The predicted values for Santa Catarina and Bahia do not fit as well in comparison to other federative units. After a closer examination, this is due to the mobility trends for the two federative units, which remained at lower levels when the behavior of the population of other federative units started to go back to normal levels.
Figure 5. Predictive Margins of New Deaths per 100k (Log) for different levels of Responsiveness.
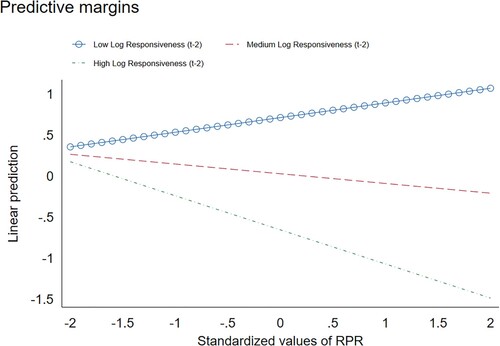
Figure 6. Predicted Values vs Actual Values of New Deaths per 100k (log).
Discussion and conclusion
After examining the conditional effect of responsiveness and political capacity on COVID-19 severity, I find that the success of policy responses is moderated by the government’s ability to mobilize the population to abide by their recommendations. Although policy responsiveness has the most substantive effect in reducing COVID-19 attributed deaths, this effect is conditional on the political capacity of subnational governments. Further, I find evidence for the empirical usefulness of the RPR indicator as a measure of government’s political capacity, or specifically, their leverage over the population under their control. In other words, assessing the size of the informal labor sector as an indicator of the population over which the government has less leverage can inform estimations of the extent to which policy implementation will be successful. The effects of GDP per capita and urbanization are also consistent with existing literature, but their effect is relatively less substantive than policy factors. Findings remain robust across estimation techniques and model specifications. Consequently, they can more holistically inform policy-making so that the process of implementation is more effective.
Since this research only concerned Brazil, the generalizability of the findings can be assessed by applying the model to other societies at the subnational level. It can be applied to other non-centralized countries where the responsibility of policy design and implementation is assumed by subnational governments. The time period of the study also did not cover the entire duration of the pandemic, excluding important events such as the appearance of the P.1 variant in January 2021 and subsequent waves of infection that were more severe. Future research that extends the time period could then attempt to address problems of endogeneity with the mobility variable and explore potential explanations of the counter-intuitive negative relation between older populations and COVID-19 mortality in Brazil.
Disclosure statement
No potential conflict of interest was reported by the author(s).
Additional information
Notes on contributors
Ana Ortiz Salazar
Ana Ortiz Salazar is currently pursuing her doctoral degree in International Politics and Political Science with concentrations in Computational Analytics and World Politics at Claremont Graduate University, from where she also received her master's degree in Applied Data Science and International Studies. She is a Research Fellow at the TransResearch Consortium.
Notes
1 See Kugler and Tammen (Citation2012) for a detailed review of relative political capacity and its applications.
2 See Arbetman, Citation1990 and Arbetman, Citation1994 for a detailed explanation or Relative Political Reach
3 A Breusch-Pagan Lagrange multiplier (LM) test indicates that the variance across the federative units (panels) is different from zero; as such, a random effects regression is a more appropriate econometric model than pooled OLS.
4 With GAM the time variable is modelled by a sum of smooth functions. See Hastie and Tibshirani (Citation1986) for a more detailed discussion.
5 Potential explanatory factors of this discrepancy to consider in future research are the federative units’ location in the Amazon rainforest, where access to healthcare is limited and potable water is scarce (See Castro et al., Citation2019).
6 Results from panel-data unit-root tests confirm stationarity of the dependent variable. A Wooldridge test for autocorrelation in panel data (Table D) shows evidence of first-order serial correlation, as such a random effects regression with a first-order autoregressive disturbance is used for estimation (xtregar option in Stata). See Baltagi and Wu (Citation1999) for details. See Appendix (Tables E and F) for results of unit-root and serial autocorrelation tests.
7 Using population aged 60 and older as a control instead of 80 and older also yields a negative coefficient and does not affect the robustness of the results (See Table G in Appendix). Population aged 80 and older is preferred since 60 and older is even more highly correlated (0.62) with the measure of bed availability.
8 The direction, and statistical and substantive significance of coefficients are not affected when this variable is removed.
9 See Table H in Appendix.
References
- Arbetman, M. (1990). “The Political Economy of Exchange Rate Fluctuations.” PhD diss., Vanderbilt University.
- Arbetman, M. (1994). The concept of political penetration. In proceedings of the conference on Political Capacity and Economic behavior, organized by the center for Politics and economics, Claremont: Claremont Graduate School.
- Arbetman, M., & Kugler, J. (eds.). (1997). Political Capacity and Economic behavior. Boulder: Westview Press.
- Arbetman–Rabinowitz, A., Fisunoglu, A., Kang, K., & Kugler, J. (2011). Relative political capacity dataset (Version 2.4) August 2020. https://doi.org/10.7910/DVN/NRR7MB
- Baltagi, B. H., & Wu, P. X. (1999). Unequally spaced panel data regressions with AR(1) disturbances. Econometric Theory, 15, 814–823. doi:10.1017/S0266466699156020
- Benson, M., & Kugler, J. (1998). Power parity, democracy, and the severity of internal violence. Journal of Conflict Resolution, 42, 196–209.
- Brambor, T., Clark, W. R., & Golder, M. (2006). Understanding interaction models: Improving empirical analyses. Political Analysis, 14, 63–82.
- Castro, M. C., Baeza, A., Codeço, C. T., Cucunubá, Z. M., Dal’Asta, A. P., De Leo, G. A., et al. (2019). Development, environmental degradation, and disease spread in the Brazilian Amazon. PLoS Biology, 17(11), e3000526. doi:10.1371/journal.pbio.3000526
- Central Intelligence Agency (CIA). The World Factbook 2020. (2020). https://www.cia.gov/library/publications/the-world-factbook/geos/br.html.
- Chaudhry, R., Dranitsaris, G., Mubashir, T., Bartoszko, J., & Riazi, S. (2020). A country level analysis measuring the impact of government actions, country preparedness and socioeconomic factors on COVID-19 mortality and related health outcomes. EClinicalMedicine. 25.
- Cohen, J., Cohen, P., West, S. G., & Aiken, L. S. (2002). Applied multiple regression/correlation analysis for the behavioral sciences. ProQuest Ebook Central https://ebookcentral-proquest-com.ccl.idm.oclc.org.
- COVID-19 Observatory, University of Miami. (2020). Public Policy Adoption Index. http://observcovid.miami.edu/methodology/.
- Dergiades, T., Milas, C., Mossialos, E., & Panagiotidis, T. (2020). Effectiveness of Government Policies in Response to the COVID-19 Outbreak. SSRN Electronic Journal.
- Dong, E., Du, H., & Gardner, L. (2020). An interactive web-based dashboard to track COVID-19 in real time. The Lancet Infectious Diseases, 20(5), 533–534.
- Feng, Y., Kugler, J., & Zak, P. (2000). The Politics of fertility and economic development. International Studies Quarterly, 44, 667–693.
- Google LLC. (2020). Google COVID-19 Community Mobility Reports. [Data set]. Google. https://www.google.com/covid19/mobility/.
- Hale, T., Angrist, N., Kira, B., Petherick, A., Phillips, T., & Webster, S. (2020a). Variation in Government Responses to COVID-19 Version 7.0. Blavatnik School of Government Working Paper. www.bsg.ox.ac.uk/covidtracker.
- Hale, T., Hale, A. J., Kira, B., Petherick, A., Phillips, T., Sridhar, D., … Angrist, N. (2020b). Global Assessment of the Relationship between Government Response Measures and COVID-19 Deaths. COVID-19 SARS-CoV-2 preprints from medRxiv and bioRxiv.
- Hastie, T., & Tibshirani, T. (1986). Generalized Additive models. Statistical Science, 1(3), 297–310.
- Institute for Health Metrics and Evaluation. (2020). COVID–19 mortality, infection, testing, hospital resource use, and social distancing projections. Seattle, United States of America: Institute for Health Metrics and Evaluation (IHME), University of Washington.
- Kang, S.-J., & Sook In, J. (2020). Age-Related morbidity and mortality among patients with COVID-19. Infection & Chemotherapy, 52(2), 154–164.
- Khera, R., Jain, S., Lin, Z., Ross, J. S., & Krumholz, H. (2020). Evaluation of the Anticipated Burden of COVID-19 on Hospital-Based Healthcare Services Across the United States. medRxiv: the preprint server for health sciences, 2020.04.01.20050492. https://doi.org/10.1101/2020.04.01.20050492.
- Kugler, J., & Tammen, R. L. (2012). The performance of nations. Lanham, Md: Rowman & Littlefield.
- Liu, W., Tao, Z.-W., Wang, L., Yuan, M.-L., Liu, K., Zhou, L., … Hu, Y. (2020). Analysis of factors associated with disease outcomes in hospitalized patients with 2019 novel coronavirus disease. Chinese Medical Journal, 133, 1032–1038.
- Ministério da Saúde do Brasil. (2020). Painel Coronavírus. https://covid.saude.gov.br/.
- Organski, A. F. K. (1958). World politics. New York: Knopf.
- Palamim, C. V. C., & Marson, F. A. L. (2020). COVID-19 - The availability of ICU beds in Brazil during the onset of pandemic. Annals of Global Health, 86(1), 100. Published 2020 Aug 13. doi:10.5334/aogh.3025
- Paradella, R. (2018). Elderly population increases 18% in 5 years and surpasses 30 million in 2017. Agência IGBE. https://agenciadenoticias.ibge.gov.br/en/agencia-news/2184-news-agency/news/21005-elderly-population-increases-18-in-5-years-and-surpasses-30-million-in-2017#:~:text=The%20Brazilian%20population%20has%20remained,released%20today%20by%20the%20IBGE.
- Queiroz, B. L., & Baptista, E. A. (2020). Regional Covid-19 Mortality in Brazil by Age. Retrieved from osf.io/vt76z.
- Roser, M., Ritchie, H., Ortiz-Ospina, E., & Hasell, J. (2020). Coronavirus Pandemic (COVID-19). https://ourworldindata.org/coronavirus.
- Stowell, N., Immormino, J., Ortiz Salazar, A., Zeng, Y., & Arbetman-Rabinowitz, M. (2020). Politics, Policy, and Pandemic Control. Manuscript submitted for publication.
- Swaminathan, S., & Thomas, J. (2007). Saving the next generation: Political capacity and infant mortality decline in India's states. International Interactions, 33(3), 217–242.
- Wooldridge, J. M. (2012). Introductory econometrics: A modern approach (5th edition). Mason, Ohio: South-Western Cengage Learning.
Appendix
Table A. Hypothesis Testing (t-test) Max Daily Deaths per 100k – High vs. Low RPR.
Table B. Hypothesis Testing (t-test) Cumulative Deaths per 100k – High vs. Low RPR.
Table C. Random Effects Regression with AR (1) Disturbance (Standardized Coef.) and GAM Results.
Table D. Wooldridge test for autocorrelation in panel data (H0: no first order autocorrelation).
Table E. Levin-Lin-Chu Unit Root Test for Logged New Deaths (p 100k) (Ha: Panels are Stationary) (AR Common Across Panels).
Table F. Im-Pesaran-Shin Unit Root Test for Logged New Deaths (p 100k) (Ha: Some panel are Stationary) (AR Panel Specific).
Table G: Random Effects Regression with AR (1) Disturbance (Standardized Coef.) Results (Pop 60 and older).
Table H: Random Effects AR (1) Regression Unstandardized Coefficients.