
 ?Mathematical formulae have been encoded as MathML and are displayed in this HTML version using MathJax in order to improve their display. Uncheck the box to turn MathJax off. This feature requires Javascript. Click on a formula to zoom.
ABSTRACT
This paper examines the structural political and economic determinants of country-level severity of the COVID-19 pandemic. By conducting an empirical analysis of 118 countries through the first wave of the pandemic, we show that – unlike natural disasters and past viral outbreaks – national wealth has not insulated countries from the most severe outcomes of COVID-19. Further, we show that timely and responsive policy measures are vital, but so too is the capacity of governments to compel their populations to adhere the chosen policies. While a society's age structure is a key determinant of its COVID-19 mortality rate, we demonstrate that political capacity, combined with an appropriate policy response, outweighs economic and demographic factors in forecasting within-country severity of the pandemic.
RÉSUMÉ
Cet article examine les déterminants politiques et économiques structurels de la gravité de la pandémie de COVID-19 au niveau des pays. En réalisant une analyse empirique de 118 pays pendant la pandémie, nous montrons que – contrairement aux catastrophes naturelles et aux épidémies virales passées – les richesses nationales n'ont pas protégé les pays des conséquences les plus graves de la COVID-19. En outre, nous montrons que des mesures politiques opportunes et réactives sont essentielles, mais que la capacité des gouvernements de contraindre leurs populations à adhérer aux politiques choisies l'est tout autant. Si la structure d'âge d'une société est un facteur déterminant de son taux de mortalité par COVID-19, nous démontrons que la capacité politique, associée à une réponse politique appropriée, l'emporte sur les facteurs économiques et démographiques pour prévoir la gravité de la pandémie à l'intérieur d'un pays.
Introduction
The global COVID-19 pandemic has affected some countries more severely than others. Unlike the West African Ebola epidemic, COVID-19 has transcended regional and economic constraints to cause severe loss of life and socioeconomic disruption throughout the world. Advanced, affluent democracies with expansive health systems have been no exception. In fact, contrary to common expectations, wealthy nations have often experienced a rapid spread of the virus and underperformed relative to developing nations in this respect. Thus, the within-country severity of the pandemic is dependent upon more than economic development and national resources. In this paper, we explore the elements that affect a country's death rate from the COVID-19 pandemic and find that structural political factors, in combination with policy responsiveness, form the leading determinants of a successful national pandemic response. More specifically, our results indicate that (1) national wealth is associated with higher, not lower, COVID-19 mortality rates, (2) better performing governments do have lower death tolls, (3) the ability of policy responsiveness to effectively reduce mortality is conditional on government's structural capacity, and (4) measures of politics and policy responsiveness supersede economic development and age structure in their association with effective COVID-19 pandemic response.
In the early period of the outbreak, China demonstrated that prior to the development of a vaccine, four behavioural policies can combine to limit contagion. They include the wearing of a face covering, thorough handwashing, social distancing, and contact tracing. Nations that promptly adopted such policies – such as Greece, South Korea, and New Zealand – have managed lower cumulative death rates than otherwise comparable nations. Countries that did not – such as Brazil, Colombia, and the United States – extended infection and face a far more difficult task in containing the pandemic (Hale et al., Citation2020b). Yet policy alone does not sufficiently account for between-country variation in death rates. Governments must also implement such programmes effectively.
While even the most effective governments were unable to prevent the initial outbreak of COVID-19, high levels of political capacity enable governments to properly implement the policies necessary to minimize the continued spread of the disease. For our purposes, political performance is defined as the measurable “ability of governments to reach their population” and to “extract economic resources from that population … to secure the long-term survival of the political structure” (Arbetman-Rabinowitz et al., Citation2013, p. 8). As such, governments that can reach their populations promptly and persuade or coerce them to adopt proper safeguards, tend to reduce the rate of disease transmission. Conversely, structurally dysfunctional governments will fail to prevent rapid and deadly expansion in infection, regardless of affluence or policy position.
Mitigating the effects of the COVID-19 pandemic, as well as future viral outbreaks, is of the highest priority to policymakers throughout the world. Yet existing literature has failed to properly account for the varied results observed among countries with similar pandemic response plans and demographic structures, as well as the contradictory outcomes of economically disparate nations. The following analysis examines world data from the first wave of global infections and reveals the effectiveness of policy to be conditioned on government's capacity to mobilize compliance with the policy measures and to extract resources from the population for such purposes. Ultimately, we find the timely adoption of appropriate policy measures to be a necessary but insufficient condition for effective management of the COVID-19 outbreak. A country's overall ability to constrain the effects of the virus is pre-set by the government's existing structural political capacity. Moreover, these features outweigh economic and demographic factors in determining effective pandemic response. Governments which possess the ability to reach and extract resources from their population are far more likely to successfully impose the stringent policies necessary to control the crisis and moderate the resultant socioeconomic and demographic implications.
Literature review
COVID-19 in the context of pandemics
Despite continuing political debate regarding the utility of face masks, handwashing, social distancing, and contact tracing, the medical and public health communities agree that these steps are necessary to reduce the spread of COVID-19 (CDC, Citation2020; Mayo Clinic, Citation2020; WHO, Citation2020a). Of these measures, social distancing and the associated stay-at-home orders are the most costly and controversial. However, the practice of imposing isolation to control outbreaks dates to the Black Death of 1346-1353, which is estimated to have killed between 30 and 60 percent of the European population. Though officials of the time were unaware of the precise source of the plague, Old and New Testament references to “days of purification” prompted the practice of quarantine. The practice was effective and reducing population mobility has been a common containment technique ever since (Snowden, Citation2019).
Public opposition to quarantine is as old as the practice itself. Government action taken during the Black Death prompted uprisings across England, France, and Italy. By restricting commerce, isolation and mobility restriction policies risk exacerbating inequality, growing poverty rates, and undermining overall community cohesion (Snowden, Citation2019). Yet allowing the unrestrained spread of the disease bears its own unequal risks. Mortality during the Black Death was so disproportionately concentrated among the working class that it produced a post-pandemic labour shortage. The bacterial Cholera outbreaks of the nineteenth Century were disproportionately concentrated in lower income communities. The Spanish Flu outbreak of 1918–1920 saw global mortality rates between 2.5 and 5 percent. However, the death rate within the Navajo Nation was an astounding 12 percent and the mortality rate within predominantly black U.S. cities was “a shocking 1,123 per 100,000 people” (Wade, Citation2020). With respect to COVID-19, data from the first wave of infections indicates that though elderly populations are the most at-risk, mortality rates are higher among minority and low-income populations (Gordon, Citation2020).
Economic development
While wealthy countries are unable to avoid catastrophes such as natural disasters and global pandemics, evidence suggests that richer governments “can provide implicit disaster insurance through effective regulation and planning,” as well as better infrastructure and post-event emergency care (Kahn, Citation2005, p. 277). This relationship has been demonstrated empirically in the context of both natural disasters and outbreaks of communicable diseases, with lower socioeconomic development correlating with higher catastrophe event death rates (Austin & McKinney, Citation2016; Kahn, Citation2005). In fact, research comparing crude incidence rates of COVID-19 between districts in Barcelona, Spain from February 2020 to April 2020 shows a significant inverse correlation between per capita income and COVID-19 infections (Banea-Diez, Barroso, Cordeiro-Coelho, Diaz, & Grau, Citation2020). However, Chaudhry, Dranitsaris, Mubashir, Bartoszko, and Sheila (Citation2020) reach an opposite conclusion, finding that high per capita gross domestic product may actually be associated with higher mortality. As with analyses of the HIV epidemic in Africa through the 1990s, it may be “an oversimplification to identify poverty as a key driving force in the spread of the pandemic” (Love, Citation2004, p. 640).
While such research on the relationship between economic development and the human toll from pandemics and natural disasters appears fundamentally sound, it tends to either ignore structural political factors or conflates them with economic development itself. Notably, Banea-Diez et al. (Citation2020) fail to consider politics in their analysis. Kahn (Citation2005) argues that “nations with higher quality institutions suffer less death from natural disasters” but simply uses per capita income, democracy, and inequality as proxy measures for the soundness of political institutions. We seek to rectify this oversight by explicitly incorporating the capacity of political institutions independent of regime type and level of development.
Age structure
Despite significant variations in cross-national COVID-19 fatality rates, the vulnerability of the elderly to the virus has been consistently observed across societies. In general, COVID-19 fatality reporting data suggests that case fatality ratios (CFRs) largely depend on the age distribution of the population and their underlying health conditions. Though people aged 80 and older typically constitute the smallest portion of confirmed cases, their group CFR tends to be the highest (CDC, Citation2020; Kang & Jung, Citation2020; Lithander et al., Citation2020; Roser, Ritchie, Ortiz-Ospina, & Hasell, Citation2020; WHO, Citation2020b; Wu & McGoogan, Citation2020). This exponentially increasing risk based on age is reinforced by the fact that elderly people are more likely to have underlying health conditions such as respiratory and cardiovascular diseases (Liu et al., Citation2020; Roser et al., Citation2020).
Goldstein and Lee (Citation2020) calculate COVID-19 age-specific death rates for China, South Korea, Italy, Spain, France, Germany, England, and the United States. Their findings reveal consistent age patterns in COVID-19 mortality rates across these countries. Ultimately, mortality rates appear to increase by about ten percent every year after age thirty. Thus, given the consistency of this mortality pattern, we examine other non-demographic factors that may serve to mitigate the spread. Specifically, we suspect that governments’ policy responses and political capacity contribute to the significant differences in COVID-19 mortality.
Policy responses
Policy responses and containment plans have varied across societies. The University of Oxford's COVID-19 Government Response Tracker (OxCGRT) offers a “cross-national, cross-temporal measure to understand how government responses have evolved over the full period of the disease's spread” (Hale et al., Citation2020a). The project calculates a “Stringency Index” for each country using an aggregate of individual sub-indices of government policies, including mobility-based restrictions on gatherings, public events, and travel. Applying the Stringency Index to assess the relationship between government responses and COVID-19-related deaths has shown that the early implementation of more stringent policy can reduce mortality rates (Hale et al., Citation2020b).
Similar country-level studies support these findings, concluding that low levels of national preparedness, as well as weaker and late government interventions, in addition to population characteristics, are associated with higher COVID-19 infections and mortality rates (Chaudhry et al., Citation2020; Dergiades, Milas, Mossialos, & Panagiotidis, Citation2020). However, Hale et al. (Citation2020a) acknowledge that the Oxford indices do not account for the effectiveness of a government's response or policy enforcement. While they do control for age structure, population density, GDP per capita, and health capacity, their analysis does not measure “the extent to which government interventions are successfully implemented,” nor does it account for “potential confounders that might have otherwise reduced deaths” (Hale et al., Citation2020b). Accordingly, to correctly assess the effectiveness of policy on reducing the severity of the virus, it is necessary to examine the ability of governments to implement the proposed policies in the first place. We explicitly model this ability through measures of relative political capacity.
Political capacity
The policies a government selects are independent from its capacity to implement them in a coherent way and compel its population to adhere to them. It is one thing to mandate that non-essential workers remain at home for a time. It is quite another to induce people to follow the mandate. The latter requires sufficient political capacity.
Political capacity—the extent to which governments can extract the resources needed to implement their policy agenda and mobilize the population to abide by that agenda—is a key determinant of a government's policy implementation success. All else being equal, a more capable government should be able to implement whichever policies it selects more effectively and efficiently than should a less capable government. Relative Political Capacity (RPC) is a three-pronged approach to modelling government capabilities relative to their respective levels of economic development and independent of regime type or level of democratization. Its components include relative political reach (RPR), relative political extraction (RPE), and relative political allocation (RPA). RPR measures the extent to which a government can penetrate and mobilize its population. RPE captures the capacity of a government to extract resources from its population in the form of tax revenue. RPA measures the efficiency with which a government allocates its revenue relative to an optimal set of allocations. These components have been have been widely used to explain and forecast government performance in the areas of global conflict, economic development, socioeconomic change, and demographic change (Arbetman & Kugler, Citation1997; Benson & Kugler, Citation1998; Feng, Kugler, & Zak, Citation2000; Swaminathan & Thomas, Citation2007). For instance, Swaminathan and Thomas (Citation2007) find that Indian state governments with high levels of political capacity can reduce infant mortality, especially in low- and middle-income states. As such, measures of political capacity can bring light to macro characteristics of societies that allow governments to minimize the severity of the COVID-19 virus. Their inclusion here is vital, as it enables us to move beyond Kahn’s (Citation2005) proxies and account for the actual capacity of institutions.
Methodology
How do policy responsiveness and political capacity affect the severity of pandemics such as COVID-19? We argue that policy choices must be appropriately calibrated and responsive to the severity of the pandemic within a given country. Further, we argue that the capacity of a government to penetrate its population and compel adherence to policy should reduce severity of the pandemic. To capture the extent to which political factors affect the evolution of the pandemic, we propose the following general function:
Severity is reflected by death rates. Political performance captures the structural capacity of governments to reach into their populations and compel adherence. Controls for economic affluence and age structure are used to account for non-political factors.
Given the nonlinear, time-dependent nature of pandemic spread, we follow the latest empirical research on COVID-19 severity by applying a generalized additive model (GAM) as our primary estimation technique (Prata, Rodriques, & Bermejo, Citation2020; Wu et al., Citation2020). GAMs are frequently applied to problems of ecology and virology because of their efficiency with respect to combining fixed, random, and nonlinear effects while maintaining the interpretability of parametric outcomes. Using GAM as our primary estimator allows us to model the time-based path dependence of death tolls through a series of nonparametric, polynomial smoothing functions estimated by restricted maximum likelihood (REML) (Wood, Citation2017). We also apply a random effects linear panel regression to the data to demonstrate the robustness of our key findings to the estimation technique employed.Footnote1Footnote2
To examine the relationship between politics, policy, and the severity of the pandemic, we test the following two hypotheses:
The severity of the COVID-19 pandemic is reduced by timely and responsive policy choices.
The severity of the COVID-19 pandemic is reduced by the capacity of government to penetrate its population and compel action.
To test these hypotheses, we employ the following statistical model:
where severity is measured by total deaths per 100,000 people, while log(GDPPC) represents the natural log of GDP per capita in real 2010 US dollars, and Elders is the proportion of the population over age 80. Responsiveness is an indicator of the governments’ policy response to the pandemic relative to the within-country severity of the outbreak. RPR is an indicator of political capacity. Our dependent variable, total deaths per 100,000 people, as well as the independent variables GDP per capita and government responsiveness, are logged to approach a normal distribution and improve accuracy of the parameters. Government responsiveness is also lagged two weeks to allow time for the effects of policy on death rates to take place. Following Wu et al. (Citation2020), s(week) represents a nonparametric smoothing function applied by the GAM estimator to the number of weeks since each country reported at least ten cumulative deaths from the virus.
Data
The model specification outlined above relies upon data collected from multiple sources (, appendix) and covering the period from January 1, 2020 to August 31, 2020. Due to the on-going, high-risk nature of the pandemic, we elect to analyze this period as an approximation of the first wave of global infections. Of course, within-country dynamics will vary. We control for variation in the onset of the pandemic by beginning analysis at the point where a given country meets or exceeds ten reported COVID-19 deaths.
Total deaths per 100,000 people
National daily counts of the total number of reported COVID-19 deaths were obtained from the Institute of Health Metrics and Evaluation (IHME). We aggregated the daily counts to weekly sums and then converted to a death rate per 100,000 people by dividing the weekly value by the population total and multiplying by 100,000. The distribution of this calculated feature is positively skewed. Therefore, we transformed this variable by taking its natural log prior to analysis.
GDP per capita
Per capita gross domestic product was collected from the World Bank Human Development dataset. This value is measured on an annual basis, with 2019 being the most recent available data. Thus, within our weekly dataset, a country's GDP per capita is constant. Its cross-country distribution is also positively skewed and warrants a log transformation prior to analysis. Additionally, because prior research shows per capita GDP to be correlated with rates of infection and death (Banea-Diez et al., Citation2020; Chaudhry et al., Citation2020), it was necessary to select a panel regression technique capable of working with constant independent variables, as detailed in the Methodology section above.
Policy responsiveness
Our measure of policy responsiveness is derived from the weekly average of Oxford University's Stringency Index and infection rate data from IHME. The Stringency Index is the simple average of nine individual, ordinal component indicators, eight of which capture the strictness of “lockdown style” policies while the nineth relates to public information campaigns (University of Oxford, Citation2021).Footnote3 We are not concerned with the stringency of government response in a vacuum. Rather, policy should be proportional to the within-country severity of the pandemic. Therefore, we construct the measure of policy responsiveness by dividing the average weekly Stringency Index scores by the two-week lagged rate of infections per 100,000 people. This feature is then logged to normalize its distribution.
Thus, policy responsiveness represents policy stringency given conditions on the ground rather than policy stringency without context, allowing for the comparison of policy stringency between countries facing different conditions. Further, while stringency itself is largely driven by the spread of the virus, responsiveness captures the timeliness of policy implementation, which is crucial to mitigating the spread of a virus capable of rapid, often asymptomatic transmission.
Population over age 80
Data documenting the proportion of a country's population that is aged 80 and older was obtained from the World Bank Human Development dataset. As with GDP per capita, this value does not vary on a weekly basis.
RPR
Relative Political Reach (RPR) is our key political capacity measure (Kugler & Tammen, Citation2012). RPR estimates the degree to which the government is involved in the economic activities of the population, relative to expectations, given the education and employment levels of the populace (Arbetman & Kugler, Citation1997; Benson & Kugler, Citation1998; Organski & Kugler, Citation1980). It establishes the degree to which the government influences and penetrates into the daily lives of individuals’ (Arbetman-Rabinowitz et al., Citation2013, pp. 14–20).
RPR is measured as the ratio of the actual economically active population to the predicted economically active population. The predicted activity rate is estimated with the following formula:
where Bureaucracy is the ratio of government wages to total expenditures; Education is the secondary education attainment rate; Pop Age is the percentage of a population under 16 years old; Population is the total population; Social Security is social security tax revenue as a percent of GDP; and Urbanization is the percentage of a population living in an urban setting.
The groundwork for relative political capacity can be traced to Organski (Citation1958). It was later modelled and expanded by Organski and Kugler (Citation1980), Organski, Kugler, Johnson, and Cohen (Citation1985), and Arbetman (Citation1990). Arbetman (Citation1990) addressed methods for identifying the size of the informal economy, subsequently incorporating controls for the degree to which economic activity occurs outside the purview of the government. Thus, this capacity indicator reveals the effectiveness of governments. If the value exceeds one, that government may be considered strong and effective, relative to other nations with comparable levels of economic development. However, if it is lower than one, that government's relative capacity would be considered lower than average (Benson & Kugler, Citation1998). Notably, these measures are calculated on an annual basis and do not vary within countries in our data set.
Week
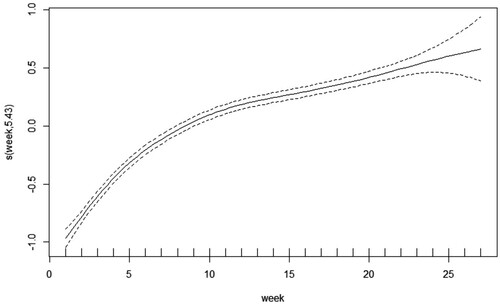
As previously mentioned, cumulative death tolls from COVID-19 increase non-linearly over time. We therefore include a variable for time, in weeks, starting with the first week that each country had reported at least ten cumulative deaths from COVID-19. As mentioned, GAM methods allow us to model nonlinear, non-parametric relationships through additive polynomial smoothing functions. visualizes the nonlinear trajectory of death rates over time for this data generated by the GAM estimator. We aggregate our data to the weekly level to correct for the time-varying ways that deaths are reported between countries.
Figure 1. Visualization of the non-linear, time-dependent trajectory of deaths per 100,000 people generated by the GAM estimator. The y-axis represents the standardized dependent variable (deaths per 100,000 people, logged).
Results
presents the empirical results of our model specification as applied to 116 countries over a maximum of 27 weeks, beginning with the first week in which each country reported at least ten total deaths from COVID-19. All variables are centred and standardized with a mean of zero and standard deviation of 1. This is done to allow for direct comparison of their relative impacts. The results provide strong support for our hypotheses that policy responsiveness and political capacity reduce death rates from COVID-19.
Table 1. Random effects panel regression models of total COVID-19 deaths per 100,000 people as a function of per capita GDP, age structure, government responsiveness, and political reach.Footnote6
Model (1) in shows that the age distribution of a population and GDP per capita account for a substantive portion of between-country differences in deaths per 100,000 people. Together, these factors account for 56.6 percent of the overall variance in mortality rates. This is the base from which we estimate the impact of political capacity and policy responsiveness. Model (2) demonstrates the impact of political and policy factors on COVID-19 death rates. The inclusion of the political performance and policy responsiveness variables improve the model fit by 16 percentage points, a 29 percent increase from the base model (1). Model (3) presents the results of a random effects linear panel regression as a check on the robustness of our findings to the chosen estimator. It supports the robustness of our key findings; the coefficients for RPR and policy stringency remain negative and statistically significant, though with minor differences in their respective magnitudes. In sum, the results suggest that a pandemic will take its toll regardless of the capabilities and polices that governments adopt, but mortality can be substantially diminished in societies that have effective political performance and adopt timely, sufficiently stringent policies in the face of the pandemic.
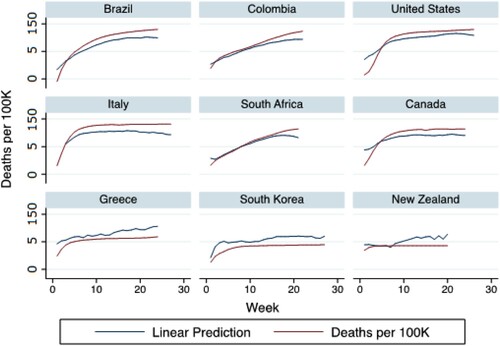
demonstrates how accurately the predictions of our model conform with reality. These countries were selected with the intent of representing a cross-section of geographic regions, levels of economic development, and cross the range of the dependent variable within our sample. The accuracy of predicted values across this subset of countries is relatively consistent, though South Africa and Colombia show some divergence in the later weeks of available data. Overall, the accuracy of the model predictions provides strong support for our hypothesis and indicates that the inclusion of structural and policy variables provides powerful insight into the prospects of containing a pandemic.
Figure 2. Time series of deaths per 100,000 people overlaid with predicted values. The y-axis is on a logarithmic scale.
Consider the results in detail. The coefficients of GDP per capita are positive and statistically significant at p < 0.01. There are several possible explanations for the apparent positive relationship between GDP per capita and death rates for this sample. First, people from wealthier countries tend to be more mobile and enjoy more international travel, facilitating the spread of the virus in its early stage. During the period of our analysis, countries with GDP per capita at or higher than our sample's median saw an average 16 percent reduction in mobility, whereas those with GDP per capita lower than the median showed a 26 percent reduction (Google LLC, Citation2020).Footnote4 Second, wealthier countries tend to have better quality data and superior statistical capacity (Brookings Institution, Citation2020). This may lead to more complete reporting of deaths from COVID-19 in wealthier countries. Finally, the coronavirus reached wealthier countries earlier than developing countries on average. The correlation coefficient between logged GDP per capita and the number of weeks since reaching ten reported deaths is 0.57. Given that deaths accumulate over time, countries with longer panels will tend to have more deaths counted by the end of their respective panels.
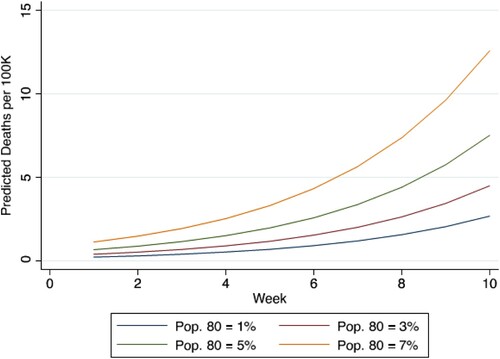
The coefficients for population over age 80 are positive and significant across the board. This confirms the commonly reported fact that COVID-19 is most deadly among elderly populations (CDC, Citation2020; Kang & Jung, Citation2020; Lithander et al., Citation2020; Roser et al., Citation2020; WHO, Citation2020b; Wu & McGoogan, Citation2020). demonstrates how the relative size of a country's elderly population has affected mortality in the face of this pandemic. By week 10, countries in which one percent of their population are age 80 and older are expected to have suffered 2.7 deaths per 100,000 people, whereas those in which seven percent of their population are age 80 and older are expected to have suffered 12.6 deaths per 100,000 people, all else being equal. Clearly, demographic structure affects the mortality of this pandemic.
Figure 3. Predicted marginal effects of elderly populations on mortality rates.
Our empirical results support the specific hypotheses that political capacity and policy responsiveness each effectively reduce the severity of COVID-19 in terms of death rates. Countries that responded to the pandemic with timely and appropriately stringent policies experienced significantly fewer deaths per capita through the first wave of the pandemic than countries that were less responsive. Further, countries with greater political capacity, that can more efficiently and effectively penetrate their populations and compel adherence, suffered significantly fewer deaths per capita than did less capable governments.Footnote5 shows the predicted marginal effects of policy responsiveness on death rates over time.
Figure 4. Predicted marginal effects of policy responsiveness on COVID-19 death rates over time.
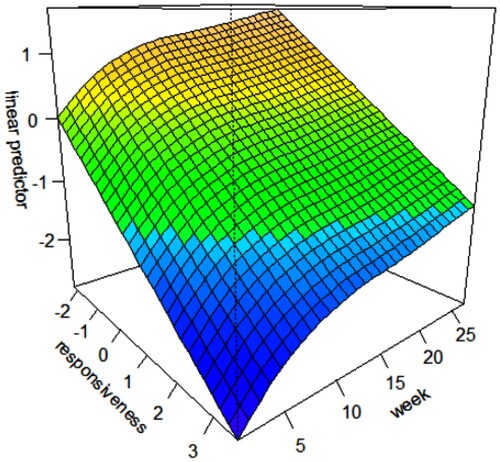
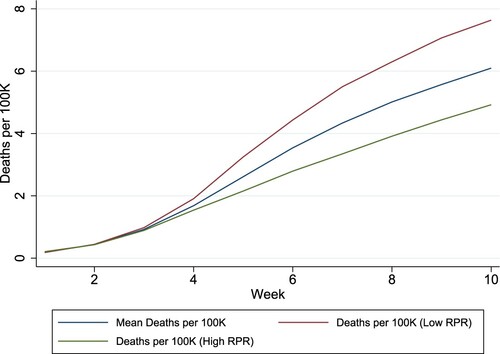
While policy responsiveness and political capacity each have independent, statistically significant dampening effects on COVID-19 severity, the empirical results in suggest that the selection of appropriate and timely policies appears significantly more impactful. Nevertheless, the extent to which a government can penetrate and compel its population can have a tremendous substantive impact. offers a visual representation of the relationship between RPR and the trajectory of coronavirus deaths over time. The sample is separated around the median level of RPR and demonstrates the extent to which political reach saved lives. By the tenth week after suffering its first ten deaths, the average country in this sample had suffered 6.1 deaths per 100,000 people. In contrast, those countries with lower-than-average political reach suffered an average of 7.6 deaths per 100,000 people while those countries with higher-than-average reach suffered 4.6 deaths per 100,000 people.
Figure 5. Mean reported COVID-19 deaths for low and high levels of RPR.
Based on the relative magnitude of coefficients in and the marginal effects displayed in , the responsiveness of government policy to the severity of the pandemic is the most critical factor affecting the death rate from COVID-19. highlights this relationship for a range of developed and developing countries with varying levels of COVID-19 severity.
Figure 6. Overlaid time series plots of policy responsiveness and reported COVID-19 deaths per 100,000 people.
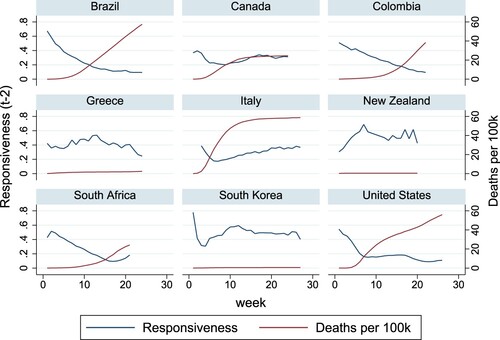
In , New Zealand and South Korea are seen to have selected and maintained timely and appropriately stringent policies, effectively mitigating the spread of the virus from the outset, leading to very low death tolls. In stark contrast, the United States was less responsive to the virus’ spread over time. This lack of sustained policy responsiveness in the face of a highly contagious virus contributed to the United States’ disproportionately large number of deaths. Canada was moderately responsive and eventually wrested control over the pandemic.
We see a similar story in the developing world. Brazil failed to maintain or increase policy stringency as the coronavirus quickly spread and therefore never gained control of the pandemic. This is a key reason for its explosive death toll. Colombia represents a similar story; its government failed to maintain responsiveness to the rising infection rate, eventually leading to a large and exponentially increasing death toll. South Africa began to lose control of the pandemic, but eventually responded appropriately and reduced the spread.
Discussion
In this paper, we show that structural political variables and policy response are strong predictors of mortality rates related to the COVID-19 pandemic. We find that policy choices and the capacity of governments to mobilize their populations are key to the limiting the number of deaths from the pandemic. Governments must enact timely and sufficiently stringent orders but also benefit from the capacity to compel their people to follow them. Political capacity is therefore a key determinant of death tolls in the face of this global pandemic.
This research demonstrates that the timing and stringency of policy measures have been a key to mitigating the death toll from COVID-19 over the first eight months of the pandemic. Crucially, it also demonstrates that the mitigation of death rates is contingent upon the capacity of governments to implement the policies they have selected. RPR may therefore be used to identify particularly vulnerable countries at the onset of a pandemic. More generally, this suggests that relative political capacity can be used in tandem with demographic indicators to identify potential hotspots and target resources in the crucial first weeks and months of a global pandemic.
Another key implication of this research is that demographic factors which otherwise make a population vulnerable, can be overcome by responsive policies and the capacity to mobilize populations to follow them. Countries with relatively large elderly populations tend naturally to be most vulnerable to this pandemic. Yet governments have considerable agency in this regard. An efficient and effective government that crafts and enacts responsive policies can protect its people from the worst outcomes regardless of demographic structure.
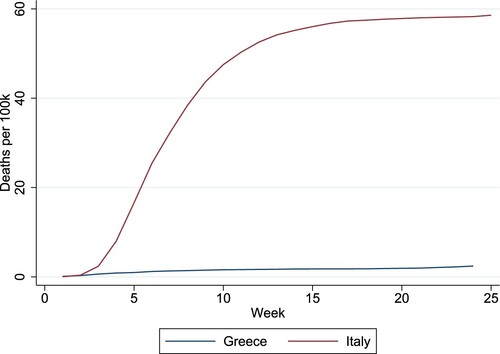
A comparison of Italy and Greece illustrates the extent to which capable governments implementing responsive policies can save many lives despite a considerable demographic disadvantage. Italy and Greece are each in the 99th percentile with over seven percent of their populations age 80 or older. They are each relatively wealthy Mediterranean democracies within the European Union. Despite these and other similarities, Italy and Greece have experienced starkly different outcomes with respect to COVID-19 (). By the 20th week since suffering 10 reported deaths from the coronavirus, Italy had suffered 58 deaths per 100,000 people while Greece had suffered fewer than two deaths per 100,000 people.
Figure 7. Comparison of death tolls from COVID-19 in Greece and Italy.
What accounts for this extreme difference in outcomes if not age structure, wealth, regime type, or geographical location? Based on our empirical results, the key differences between these two countries are government capacity and policy responsiveness. Greece's RPR is nearly one standard deviation higher, and its mean responsiveness is more than one half standard deviation higher than those of Italy. Despite a slew of demographic similarities, Greece selected more appropriately strong policies and was better equipped to compel its population to adhere to them, thus allowing Greece to mitigate a potentially severe death toll in a way that Italy could not. This highlights the significant impact that politics and policy have on the severity of this pandemic.
A comparison of the United States and Canada tells a similar story (). By the 20th week since reporting ten deaths from COVID-19, the United States had experienced 43 deaths per 100,000 people, while Canada had experienced 24 deaths per 100,000 people. Canada suffered nearly half the death rate of the United States despite having a larger vulnerable elderly population.
Figure 8. Comparison of death tolls from COVID-19 in Canada and the United States.
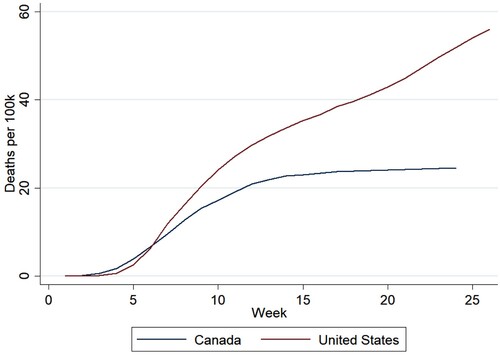
What explains this stark difference in severity? As in Greece and Italy, the key differences between the United States and Canada are in political capacity and policy responsiveness. RPR in the United States is approximately one-half standard deviation lower than that of Canada. Further, the United States was significantly less responsive in its policy measures than was Canada; the United States’ mean responsiveness score was nearly one standard deviation lower than that of Canada for the first 20 weeks of the pandemic. Compared to Canada, the United States enacted less timely, less responsive policies and was less capable of implementing them, leading to far more severe outcomes despite a demographic advantage.
The empirical analysis of the preceding section also has implications for foreign policy. Namely, it is in the interest of high-capacity states to make capacity building a key component of foreign policy toward their neighbours and trading partners. First, international travel and migration were key drivers of the cross-border spread of COVID-19 in those crucial first weeks and months. A high-capacity state is generally more effective and efficient at compelling its population to reduce mobility and avoid international travel in an emergency such as the onset of a global pandemic. A country that can rapidly implement and compel adherence to orders intended to reduce international travel thus creates a favourable situation for its neighbours. Therefore, it is in the best interest of high-capacity states with comparatively low-capacity neighbours and trade partners to craft foreign policy toward bolstering state capacity. Second, economic shocks are shown to spread through trade networks (Glasserman & Peyton Young, Citation2016). COVID-19 has undeniably carried with it tremendous economic shocks. Therefore, if a high-capacity state can help to improve the capacity of its trade partners, it may be able to reduce the magnitude of pandemic-related economic shocks to its own trade network. In that sense, improving the political capacity of one's trade partners reduces one's own vulnerability to the economic consequences of a global pandemic.
Despite substantive and statistically significant findings, this research faced several limitations. First, data quality, reporting practices, methodologies, and statistical capacity vary greatly from country to country. Data reported by less developed countries may be incomplete. Countries vary in how and when they report deaths from COVID-19. Some countries may have changed reporting practices mid-pandemic, while others may simply be unable to keep up with death tolls or distinguish COVID-related deaths from other deaths due to insufficient medical capacity.
Second, this research was conducted mid-pandemic. As such, it only speaks to the first wave of COVID-19. It is plausible that the effects of political capacity and policy stringency are substantively different in the second and third waves. Future research should consider the long- term severity of COVID-19. Political capacity and policy stringency are also likely to have a significant impact on the dissemination of a vaccine. This is another potential area for further research. As there appears to be significant within-country variation in the spread and severity of the pandemic, future research could also apply the general model herein to the subnational level.
Third, death rates are but one measure of pandemic severity. There is also tremendous economic devastation associated with stay-at-home orders and the subsequent shuttering of businesses. Yet it is not clear whether timely, stringent policies could have staved off the necessity of future lockdowns and mitigated some of the worst, long-term negative economic impacts. Future research would benefit from an examination of economic recovery from COVID-19 in the context of political capacity and policy responsiveness.
Despite these limitations, this research offers novel, generalizable insights into the impacts of politics and policy on pandemic containment. Timely, responsive policies and the capacity of government to implement them are crucial determinants of mortality in the face of viral pandemics like COVID-19. Simply put the capacity of a government to mobilize its people during a crisis saves lives.
Disclosure statement
No potential conflict of interest was reported by the author(s).
Additional information
Notes on contributors
Nicholas Stowell
Nicholas Stowell is a research fellow at TransResearch Consortium. He earned his PhD in Political Science from Claremont Graduate University in 2021.
Joseph Immormino
Joseph Immormino is a PhD candidate in Political Science with concentrations in Computational Analytics and American Politics at Claremont Graduate University. He is a research fellow at TransResearch Consortium, where his work focuses on empirical evaluations of subnational government's political capacity and their implications for effective policy implementation.
Ana Ortiz Salazar
Ana Ortiz Salazar is a PhD candidate in the International Politics and Political Science program at Claremont Graduate University, with concentrations in Computational Analytics and World Politics. She is a research fellow at the TransResearch Consortium, where her work focuses on the political capacity of subnational governments and its implication on effective policy implementation.
Yuzhu Zeng
Yuzhu Zeng is a PhD Candidate in Political Science at Claremont Graduate University and TRC research fellow, focusing on International Relations and Comparative Politics. Her research interests include governments' political capacity, relations between the US and China, the impact of inequality in the developing world, and demographics changes within a subnational framework.
Marina Arbetman-Rabinowitz
Marina Arbetman-Rabinowitz PhD is a Research Associate at the Maldonado Institute at Claremont Graduate University and at La Sierra University. As a consultant, she worked for the US Government, World Bank, private banks, and financial institutions worldwide. Her research focus is on political and economic development, natural disasters, and conflict. Her expertise is in empirical modelling, data analysis, and measurement. She has done research on political capacity computation and evaluation at the international and subnational level for the last 35 years.
Notes
1 A Breusch-Pagan Lagrangian multiplier test for random effects demonstrates significant cross-country variance, suggesting that a random effects panel regression is superior to a pooled ordinary least squares estimation technique.
2 A Breusch-Godfrey/Wooldridge test confirms serial correlation in the data. Further, a Dickey-Fuller test shows that the data is nonstationary. Therefore, recognizing the nonlinear, time-dependent trajectories of virus severity, and the subsequent issues this may cause with linear estimation techniques, we present the results of the random effects linear panel regression only as check on the robustness of our GAM result to the chosen estimator.
3 The component indices used to construct the Stringency Index include school closing, workplace closing, cancelling public events, restrictions on gatherings, closing public transit, stay-at-home requirements, restrictions on internal movement, international travel controls, and public information campaigns.
4 The average percent change in mobility was calculated with an average of Google's Community Mobility indicators (excluding residential change), which compares mobility trends to “the median value, for the corresponding day of the week, during the 5-week period Jan 3–Feb 6, 2020 ” as a baseline.
5 The empirical analysis conducted herein was concluded in September of 2020. It is noteworthy that an examination of the most recently updated data does not indicate a substantive change from the first wave to the second wave and beyond. RPR and policy responsiveness continue to contribute to fewer deaths from COVID-19 while GDP per capita and the proportion of population age 80 and older continue to be associated with more COVID-19 deaths.
6 We posit that RPR indicates political capacity independent of regime type. While not included here the addition of a common measure of regime type—Polity Index—neither improves the explanatory power of the model nor does it affect the substantive findings with respect to RPR or policy responsiveness.
References
- Arbetman, M. (1990). The political economy of exchange rate fluctuations (Doctoral Dissertation). Vanderbilt University.
- Arbetman, M., & Kugler, J., eds (1997). Political capacity and economic behavior. Boulder: Westview Press.
- Arbetman-Rabinowitz, M., Kugler, J., Abdollahian, M., Kang, K., Nelson, H. T., & Tammen, R. L. (2013). Political performance. In J. Kugler & R. L. Tammen (Eds.), The performance of nations (pp. 7–48). Maryland: Rowan and Littlefield Publishers, Inc.
- Austin, K. F., & McKinney, L. A. (2016). Disaster devastation in poor nations: The direct and indirect effects of gender equality, ecological losses, and development. Social Forces, 95(1), 355–380.
- Banea-Diez, J. M., Barroso, M., Cordeiro-Coelho, S. I., Diaz, J. L., & Grau, M. (2020). Impact of COVID-19 outbreak by income: Hitting Hardest the most deprived. Journal of Public Health, 42(4), 698–703.
- Benson, M., & Kugler, J. (1998). Power parity, democracy, and the severity of internal violence. Journal of Conflict Resolution, 42, 196–209.
- Brookings Institution. (2020). The unreal dichotomy in COVID-19 mortality between high-income and developing countries. https://www.brookings.edu/blog/future-development/2020/05/05/the-unreal-dichotomy-in-covid-19-mortality-between-high-income-and-developing-countries/.
- CDC. (2020). Coronavirus Disease 2019 (COVID-19). https://www.cdc.gov/coronavirus/2019-ncov/need-extra-precautions/older-adults.html.
- Chaudhry, R., Dranitsaris, G., Mubashir, T., Bartoszko, J., & Sheila, R. (2020). A country level analysis measuring the impact of government actions, country preparedness and socioeconomic factors on COVID-19 mortality and related health outcomes. EClinicalMedicine, 25, 1–8.
- Dergiades, T., Milas, C., Mossialos, E., & Panagiotidis, T. (2020). Effectiveness of government policies in response to the COVID-19 outbreak. SSRN Electronic Journal, 1–26. doi:10.2139/ssrn.3602004
- Feng, Y., Kugler, J., & Zak, P. (2000). The politics of fertility and economic development. International Studies Quarterly, 44, 667–693.
- Glasserman, P., & Peyton Young, H. (2016). Contagion in financial networks. Journal of Economic Literature, 54(3), 779–831.
- Goldstein, J. R., & Lee, R. D. (2020). Demographic Perspectives on Mortality of Covid-19 and Other Epidemics, NBER Working Papers 27043. National Bureau of Economic Research, Inc.
- Google LLC. (2020). COVID-19 Community Mobility Reports. https://www.google.com/covid19/mobility/.
- Gordon, S. (2020). Why Are Minorities Hardest Hit By COVID-19? WebMD https://www.webmd.com/lung/news/20200506/why-are–minorities-hardest-hit-by-covid-19#1.
- Hale, T., Angrist, N., Kira, B., Petherick, A., Phillips, T., & Webster, S. (2020a). Variation in Government Responses to COVID-19 Version 7.0. Blavatnik School of Government Working Paper. www.bsg.ox.ac.uk/covidtracker.
- Hale, T., Hale, A. J., Kira, B., Petherick, A., Phillips, T., Sridhar, D., … Angrist, N. (2020b). Global assessment of the relationship between Government Response measures and COVID-19 deaths. COVID-19 SARS-CoV-2 Preprints from MedRxiv and BioRxiv. doi:10.1101/2020.07.04.20145334
- Kahn, M. E. (2005). The death toll from natural disasters: The role of income, geography, and institutions. The Review of Economics and Statistics, 87(2), 271–284.
- Kang, S.-J., & Jung, S. I. (2020). Age-Related morbidity and mortality among patients with COVID-19. Infection & Chemotherapy, 52(2), 154–164.
- Kugler, J., & Tammen, R. (2012). Performance of nations. Lanham: Rowman and Littlefield.
- Lithander, F. E., Neumann, S., Tenison, E., Lloyd, K., Welsh, T. J., Rodrigues, J. C. L., … Henderson, E. J. (2020). COVID-19 in older people: A rapid clinical review. Age and Ageing, 49(4), 501–515.
- Liu, W., Tao, Z.-W., Wang, L., Yuan, M.-L., Liu, K., Zhou, L., … Hu, Y. (2020). Analysis of factors associated with disease outcomes in hospitalized patients with 2019 novel coronavirus disease. Chinese Medical Journal, 133, 1032–1038.
- Love, R. (2004). HIV/AIDS in Africa: Links, livelihoods & legacies. Review of African Political Economy, 31(102), 639–648.
- Mayo Clinic. (2020). Coronavirus: What is it and how can I protect myself? https://www.mayoclinic.org/diseases-conditions/coronavirus/expert-answers/novel-coronavirus/faq-20478727.
- Organski, A. F. K. (1958). World politics. New York: Knopf.
- Organski, A. F. K., & Kugler, J. (1980). The War ledger. Chicago: University of Chicago Press.
- Organski, A. F. K., Kugler, J., Johnson, T., & Cohen, Y. (1985). Births, deaths and taxes: The demographic and political transitions. Chicago: University of Chicago Press.
- Prata, D. N., Rodriques, W., & Bermejo, P. (2020). Temperature significantly changes COVID-19 transmission in (sub)tropical cities of Brazil. Science of the Total Environment, 729. doi:10.1016/j.scitotenv.2020.138862
- Roser, M., Ritchie, H., Ortiz-Ospina, E., & Hasell, J. (2020). Coronavirus Pandemic (COVID-19). https://ourworldindata.org/coronavirus.
- Snowden, F. M. (2019). Epidemics and society: From the Black death to the present. New Haven: Yale University Press.
- Swaminathan, S., & Thomas, J. (2007). Saving the next generation: Political capacity and infant mortality decline in India’s states. International Interactions, 33(3), 217–242.
- University of Oxford. (2021). Covid-19 Government Response Tracker. Retrieved from Blavatnik School of Government: https://www.bsg.ox.ac.uk/research/research-projects/covid-19-government-response-tracker.
- Wade, L. (2020). An unequal blow. Science, 368(6,492), 700–703.
- WHO. (2020a). Coronavirus Disease (COVID-19) advice for the public. https://www.who.int/emergencies/diseases/novel-coronavirus-2019/advice-for-public.
- WHO. (2020b). Coronavirus Disease (COVID-19) Situation Report – 198. https://www.who.int/docs/default-source/coronaviruse/situation-reports/20200805-covid-19-sitrep-198.pdf?sfvrsn=f99d1754_2.
- Wood, S. N. (2017). Generalized additive models: An Introduction with R. Boca Raton: CRC Press.
- Wu, Y., Jing, W., Liu, J., Ma, Q., Yuan, J., Wang, Y., … Liu, M. (2020). Effects of temperature and humidity on the daily new cases and new deaths of COVID-19 in 166 countries. Science of the Total Environment, 729, 1–7.
- Wu, Z., & McGoogan, J. M. (2020). Characteristics of and important lessons from the coronavirus disease 2019 (COVID-19) outbreak in China: Summary of a report of 72,314 cases from the Chinese center for disease control and prevention. JAMA, 323(13), 1239–1242.
Appendix
Table A1. Data descriptions and sources.
Table A2. Slope Difference Tests: Pairwise Comparisons of Marginal effects of Responsiveness on Total COVID-19 deaths per 100,000 people.
Table A3. Average Marginal Effects of Responsiveness on Total COVID-19 deaths per 100,000.
Table A4. Summary statistics.