
 ?Mathematical formulae have been encoded as MathML and are displayed in this HTML version using MathJax in order to improve their display. Uncheck the box to turn MathJax off. This feature requires Javascript. Click on a formula to zoom.
ABSTRACT
South Africa has been the worst hit by Covid-19 on the African continent and is experiencing devastating consequences. The goal of this study is to look at the role of underlying socio-economic factors and the quality of government policy responses in mitigating the impact of Covid-19 in South Africa against the backdrop of a multi-decade HIV epidemic. In the first phase of our analysis, we look at South Africa’s HIV experience. This analysis, using national level yearly data, shows that government capability plays an important role in mitigating the socio-economic consequences of the HIV epidemic. In the second phase of our analysis, we test whether a similar pattern, regarding the role of government capacity in containing the impact of Covid-19, holds true at the subnational level. The results show that rather than the level of income and wealth being the most decisive factors, the ability of the government to mobilize and influence the population’s behavior is key to mitigating the impact of Covid-19 pandemic. With the arrival of several vaccines around the globe, these findings regarding the centrality of government capacity at the national as well as the subnational level have important implications for addressing the Covid-19 pandemic and future disasters.
RÉSUMÉ
L'Afrique du Sud a été le pays le plus touché par le COVID-19 sur le continent africain, et elle en subit des conséquences dévastatrices. L'objectif de cette étude est d'examiner le rôle des facteurs socio-économiques sous-jacents et la qualité des réponses politiques du gouvernement dans l'atténuation de l'impact du COVID-19 en Afrique du Sud, dans le contexte d'une épidémie de VIH qui dure depuis plusieurs décennies. Dans la première phase de notre analyse, nous examinons l'expérience de l'Afrique du Sud en matière de VIH. Se basant sur des données annuelles au niveau national, cette analyse montre que la capacité du gouvernement joue un rôle important dans l'atténuation des conséquences socio-économiques de l'épidémie de VIH. Dans la deuxième phase de notre analyse, nous examinons si un schéma similaire concernant le rôle de la capacité du gouvernement à contenir l'impact du COVID-19, se vérifie au niveau infranational. Les résultats montrent que plutôt que le niveau de revenus et de richesses, en tant que facteurs les plus décisifs, c'est la capacité du gouvernement à mobiliser et à influencer le comportement de la population qui est essentielle à l'atténuation de l'impact de la pandémie de COVID-19. Avec l'arrivée de plusieurs vaccins dans le monde, ces résultats concernant la centralité de la capacité du gouvernement au niveau national ainsi qu'au niveau infranational, ont d'importantes implications pour faire face à la pandémie de COVID-19 et aux catastrophes futures.
Background
Pandemics are not new to South Africa. The country faced smallpox in the eighteenth and nineteenth centuries, bubonic plague and pneumonic plague from 1901 to 1907, and Spanish flu from 1918 to 1919; furthermore, it has faced HIV since 1982 and continues to have the largest population of people living with HIV in the world. In addition to its experience with pandemics, South Africa has a history of extreme inequality as a legacy of its apartheid regime, and in most past epidemics, social prejudices and racial inequality have been used as a scapegoat. The socio-economic realities of South Africa have complicated the pandemic response, in that stringent measures exacerbate economic hardships for the most vulnerable parts of population.
South Africa is the country most severely impacted by Covid-19 relative to the rest of Africa, and it continues to struggle with the HIV/AIDS epidemic as well. The demographic segments directly affected by these viruses are not the same, but the consequences are felt throughout the population. For example, HIV has left over 2 million orphaned children who, in many cases, were taken care of by the population most vulnerable to Covid-19: grandparents. Furthermore, there is evidence that the effects of Covid-19 will be exacerbated by HIV for many reasons, among them the disruption in the distribution of antiretroviral therapy (ART), affecting the 63% of adults and children that are taking it.
South Africa’s experience with the HIV epidemic has not only shaped the response to Covid-19 but has also presented further challenges in a country already dealing with an epidemic. The socio-economic impact of the government response has also produced mixed results. The most important distinction between the government’s response to Covid-19 and its response to HIV has been a reliance on the scientific community and a swift implementation of “one of the world’s earliest and strictest lockdowns” (BBC News, Citation2020). However, the economic cost of the lockdown has further exposed deep-rooted social and economic inequities in South Africa, where the most severely impacted are also in the poorest segment of society where self-isolation is not an option and severe restrictions only exacerbate the issues of unemployment, hunger and lack of access to care. According to the World Bank, the economy of South Africa contracted by 7% in 2020, which is expected to increase its poverty by 2 million people (The World Bank in South Africa, Citation2021).
At the provincial level in South Africa, the socio-economic impact of the pandemic against the stage set by existing health crises is further complicated by the economic and political dynamics within the provinces and intergovernmental relations with the central government.
South Africa and Covid-19
The virus arrived from Europe via Cape Town very early on and spread very quickly. During the first wave, scientists estimated that roughly between a one-third to one-quarter of one percent of the population had been infected by July 2020. The second variant, which started accelerating in November 2020, spread much faster, showing an acceleration of infections and deaths. As vaccines became available, the third wave – in April and May 2021 – highlighted the importance of rapid vaccination. The omicron variant, first discovered in South Africa in November 2021, set off the fourth wave of the pandemic with severe economic consequences, as controversial travel bans ensued further exacerbating socio-economic hardships, mass unemployment and business losses in the tourism industry.
South Africa implemented one of the strictest lockdowns globally, which has also had a huge impact on the economy, disproportionately affecting the poorest segments of the population who were unable to participate in the stay-at-home economic trends. As Schröder, Bossert, Kersting, and Aeff (Citation2021) point out, the lack of sufficient compliance with lockdown apparent from the use of shared mobility services such as the widely used and highly crowded minibus transportation system made containment challenging. The country declared a State of National Disaster on 15 March 2020, followed by a complete lockdown on 26 March 2020 with the highest (level 5) restrictions, constraining all activities outside of essential travel and services (Nwosu & Oyenubi, Citation2021). The restrictions were gradually relaxed to level 3 over time, allowing for some non-essential economic activities from 1 June 2020, lasting until 17 August 2020, with level 2 restrictions commencing on 18 August 2020 (Nwosu & Oyenubi, Citation2021). The restrictions were adjusted to level 1 on 24 December 2020, only to be expanded again to level 3 on 13 February 2021, as a response to the more contagious South African variant of the virus resulting in the second wave of Covid-19 (South African Government, Citation2021). Thus, over the last year since the coronavirus pandemic in South Africa, there has been a significant drop in economic activities.
The fourth wave of infections, caused by the omicron variant, had a relatively lower rate of hospitalizations in South Africa in comparison to the prior variants, attributed to its young population and therelative increase in immunity from vaccination or disease; however, the travel bans that followed had dire economic consequences, with a loss to tourism projected at $63 million between December 2021 and March 2022 (Washington Post, Citation2022).
The economic losses resulting from the pandemic have had a significant health impact by driving up food insecurity, reducing access to water and electricity and limiting access to care in an already broken and divided healthcare system (Francis, Valodia, & Webster, Citation2020). A recent survey of South Africa showed that during the 2020 lockdown, the percentage of the population suffering from hunger increased to 34%, from 11.3% in 2019. Given the existing deep socio-economic inequalities in South Africa, inequities will increase still further from the pandemic. Inhospitable living conditions have also worsened health outcomes as social distancing in overcrowded areas is impossible and has continued to increase the income and health inequities in South Africa (Nwosu & Oyenubi, Citation2021).
What explains Covid-19 deaths – is it politics or economics?
The world will not know the full effects of the current pandemic until a few years from now. Those effects will be evaluated in economic terms on productivity or trade or distribution of income, in political terms on regime changes or authoritarian rule, in demographic terms on expectancy of life or birth rates, in public health terms on mental health and in many other dimensions. Given that we are still in an active health crisis, analyzing the aftereffects is not feasible. Instead, the immediate consequences are deaths and numbers of infected individuals, and even those metrics tend to be undercounted in most countries due to a lack of data reporting infrastructure or simply because without a Covid-19 test, some deaths may be attributed to other causes, or Covid-19-infected individuals may not be aware of their infected state. The reported death figures hint at the accuracy of the previous statement: the average number of deaths per million in the world as of May 2021 is 927, and while the USA reports 1811 and Brazil 2078, South Africa reports show 916 deaths per million (Worldometer, Citation2021). South Africa’s calculated excess deaths in the past 12 months stand at 157,000, of which 85% were Covid-19 related; that is 2.5 times higher than the official statistics (Reuters, Citation2021).
The literature on the politics of pandemic management is fast developing. Guillen’s (Citation2020) work on what explains the heterogeneity in pandemic response of various countries looks at the effects of regime type, state capacity and income inequality on the management of the health crisis. According to Guillen’s national-level analysis, state capacity rather than being a democracy or a dictatorship was a more important determinant of successful disaster mitigation. Furthermore, Guillen found that economic inequality was related to reduced compliance with social distancing measures. Aksoy, Eichengreen, and Saka (Citation2020) found that trust in a government was an important determinant of epidemic response; moreover, countries with weak governments and other risk factors suffer further erosion of trust during health crises. Roberts (Citation2020) also found trust in leadership to be essential for containing infectious diseases. Abrams and Szefler (Citation2020) studied the social determinants of health outcomes and found that social and health inequities compound the effect of Covid-19 morbidity.
The developing literature and Covid-19 studies post pandemic will focus on international comparisons, and while that reference point is important to understand the global dynamics, the approach in this paper is that countries are often treated as homogeneous units when they are not. Clearly, the different approaches that subnational units have embraced have determined the different results. Although it is painstaking to analyze each country as a different unit, the more granular level of analysis will offer a better understanding of the policy behavior within a country before numbers are aggregated, which often leads to averaging the differences. South Africa is an important case to analyze among developing countries because it has been one of the countries most affected by HIV, and although it is wealthier than most African countries, it has a very unequal distribution of income. So, the expectations are that previous experience with pandemics, and more specifically the ongoing HIV epidemic, would render better containment of the negative consequences of Covid-19. At the same time, not all South Africans have access to running water, often they live with extended family in the same dwelling, and they are more vulnerable because of the high prevalence of tuberculosis (TB), malaria and HIV, which should make their health outcomes less encouraging. Looking at deaths as a metric for success or failure at the subnational level helps minimize the effects of disparity in reporting across countries since the underreporting will be normally distributed among the provinces.
Covid-19 has had a strong negative effect on economic growth around the world, but developing countries have suffered the most. South Africa’s economy contracted in 2020 by 8.2%; it grew by under 5% in 2021, a positive rebound considering that in the five years prior to the outbreak, the economy grew at a very low pace of 0.79% annually (Africa Development Bank Group, Citation2021). However, the omicron variant and its economic repercussions have reduced the 2022 growth forecast to 1.6% (OECD, Citation2021). The grim forecast has serious implications for geographic areas within the country where there is a higher concentration of poverty and which tend to be associated with worse health outcomes; this is especially true when analyzed at the subnational level.
South Africa has a wide regional divide between the richest and the poorest provinces (BusinessTech, Citation2020). Gauteng, home to Johannesburg, and Western Cape, which is home to Cape Town, have large differences in their respective per capita incomes compared to the rest of the provinces. Eastern Cape and Limpopo both have very high levels of poverty and inequality. Eastern Cape, despite its three large harbors and relatively well-developed transportation system, is the poorest province in terms of Subnational Gross Domestic Product (SGDP) per capita. In Limpopo, with its economy based on mining and agriculture, 67.5% of the adult population lives below the poverty line (The WorldAtlas (Citationn.d., states that the number is 78%).
The demographic distribution of deaths due to Covid-19 in South Africa looks different than that in developed countries, partly due to differences in life expectancy. In South Africa in 2018, life expectancy at birth was 64 years old, which is 16 years less than that in developed countries. In most developed countries, most deaths occurred in the over-80 cohort. In the US, for example, the Centers for Disease Control and Prevention (CDC) reports that 47% of deaths happened in the 80-plus range. In South Africa, 31.7% of the deaths occurred in the 70 or over bracket but a lot of the official deaths occurred in much younger brackets: 27.2% in the 60–69 group and 21.5% in the 50–59 group. The distribution of deaths is similar to the deaths in the black or Hispanic communities in the US. South Africa has a much younger population with lower expectancy of life and comorbidities from HIV, TB and malaria (CDC, Citation2021). Therefore, the pandemic has affected a relatively younger population in South Africa.
The economic and demographic profile of a country can partly explain the level of pandemic deaths in a country, but active government persuasion to promote safe practices to minimize the spread of the disease and the subsequent hospitalizations and deaths is key to controlling the devastation caused by the disease. A government that can mobilize its population and is able to convince them to accept its recommendations can advance its policy goals (Arbetman, Citation1990; Arbetman-Rabinowitz et al., Citation2012). Populations that abide by the rule of law, that share ideology or values and that are financially stable are more likely to be amenable to trusting the government. As such, the segment of the economically active population that is part of the informal workforce is more likely to disregard government advice. The informal economy is a proxy for the population that is less likely to trust the government. But not all countries publish statistics on the size of the informal economy. The informal sector contributes to economic productivity; so, similar levels of productivity achieved with fewer registered workers implies that more production is happening outside government scrutiny and it will be more difficult for the government to reach that segment of the population.
At the core of mitigating the effect of biological disasters is the implementation of public health measures. For example, during the HIV/AIDS epidemic the government had to persuade the population to follow safer sexual behaviors, such as the use of condoms, as well as destigmatize the diagnosis so the affected population would take ART on a consistent basis. In the case of Covid-19, the main mandates have been to wear masks, keep social distance and, whenever the situation requires it, to observe the lockdown. Political performance assesses the effectiveness of governments to implement these stated policies.
Stay-at-home orders have been a way to protect families from coming into contact with infected individuals outside their bubble. This is difficult to do when workers, some infected, came from other parts of the country, abiding by the orders but bringing the virus with them. Mobility measures this concept, although the cause and consequence can be seen from two perspectives. People may stay at home because the government has asked them to, or people may do so as a response to fear.
Finally, we posit that subnational units that align with the politics of the central government will receive more resources to avert the dire consequences of the virus. One way of measuring this concept is to look at the percentage of seats in the provincial legislatures vis-à-vis the central government. Voter apathy is prevalent in South Africa, and voter turnout has continuously declined over the years (Fiva, Geys, Heggedal, & Sørensen, Citation2021). While there are 48 political parties in South Africa’s fractionalized political system, the African National Congress (ANC) has always had the majority since their inception at the end of apartheid in 1994. Despite ANC’s majority, their votes have been decreasing over the years and have been captured by a new splinter party, the Economic Freedom Fighters (EFF). The official opposition party is the Democratic Alliance (DA), an Afrikaans-led party that achieved 21% of the vote in the last national-level elections (Fiva et al., Citation2021). In South Africa’s case, political alignment is not a viable measure because only one of the nine provinces has a premier who does not belong to the ANC. Instead, our measure will focus on which provinces have increased the representation of the opposition.
Model and methodology
In this section, we will test the models positing the influence of politics and economics on containment of disease at the provincial level. Our main hypothesis argues: “The more capable governments are in extracting resources and in mobilizing the population, the more effective the implementation of their health policies will be and the greater will be the mitigation of negative consequences of pandemics.”
HIV model
Since Covid-19 devastation in South Africa occurred against the backdrop of HIV, we first run two simple models for South Africa at the national level to analyze how politics and economics have affected the incidence of and the number of deaths due to HIV. We are interested not only in the incidence of HIV, which clearly is affected by the response of the population to the public health mandates, but also in the number of deaths because they are also affected by the response to public campaigns to destigmatize HIV and accept ART as a long-term treatment. The political capacity measures at the national and subnational level are conceptually similar. Many studies choose to use GDP per capita as a control for level of wealth or income. The use of GDP per capita conceals how the population lives by averaging the poor and the wealthy; therefore, it does not tell us anything about the distribution of income or wealth amassed by each socio-economic group.
In the HIV model, we use income inequality, represented by the share of the top 1% developed by the World Inequality Database (Citation2021), instead of GDP per capita as our economic measure. Another rationale for using inequality data instead of GDP per capita is that during biological disasters it is not the countries that are on average richer that have mitigated the effects the most, as has also been observed in the case of Covid-19. The data for the share of top 1% is not available at the provincial level; therefore, it is not included in the subnational Covid-19 model (Lehohla, Citation2017). Instead, we use provincial GDP per capita to explore the role of provincial governments’ capacity in mitigating the severity of the Covid-19 pandemic.
We test the following model for South Africa at the national level to analyze the factors that affect the incidence of HIV and the number of deaths due to HIV. Given a small sample size for national-level data, we opt for a basic regression model to avoid overspecification.
Specified as follows:
We use the simple ordinary least squares (OLS) regression to test the HIV model. The variable of interest for our HIV model is incidence of HIV, which measures the number of new HIV cases among the uninfected population expressed per 1000 uninfected population in the year before the period. We also use the incidence of HIV, which is a UNAIDS estimate obtained from the World Inequality database (2021). The total number of observations is 58.Footnote1 The analysis of the HIV crisis at the subnational level should be the natural next step, but data for that time period is not available. The subnational analysis explores the political and economic determinants of containing the impact of Covid-19. Given the deep income and health inequities in South Africa, income equality measured by share of top 1% per province is the ideal economic variable, but due to data limitations at the provincial level, we opt for income per capita as the economic variable. The two dimensions of political performance are captured by the variables relative political reach (RPR) and relative political extraction (RPE), the former measuring the ability of a government to mobilize its population and the latter estimating the effectiveness of a government in extracting resources required to meet its policy objectives.
Using the above HIV model renders the following results:
The two equations produce similar results: politics has a strong influence in health policy implementation through RPR; surprisingly, however, RPE is not significant. In the HIV model, the political reach dimension of political performance matters the most for reducing the number of cases and deaths. The models explain over 72% of the variance. This shows that governments that can mobilize and influence the population’s behavior tend to have lower levels of HIV incidence and of deaths due to HIV. These two equations also show that the more concentrated the income is in the higher echelon of the population, the more negative effects there are on HIV consequences.
While national-level analysis shows interesting results that highlight the role of politics and inequality, often we find that countries are not homogeneous in their responses to policy implementation or in their success. The Covid-19 crisis has highlighted these differences in many countries, but many other examples can be drawn from any policy that is not federally mandated. And even then, when the law applies to all states or provinces equally, the willingness to implement, monitor and exert accountability differs at the subnational level. The next section explores the factors that influence the severity of Covid-19 at the subnational level in South Africa.
Covid-19 model
The Covid-19 model is built taking into account that the crisis is still developing, and we use aggregated weekly data instead of annual which requires a model that comingles annual indicators that are time-invariant with more granular data. We analyze the first wave with the assumption that the behaviors will not change although the crisis might be amplified in subsequent waves unless further health policies are implemented, such as vaccination.
To test the hypothesis regarding the role of government capacity in mitigating the impact of Covid-19, we applied the following mechanism:
We specified the model as follows:
where Severity represented total cumulative deaths per 100,000 population for each province, and GDP per capita was measured by constant Rand in 2010. Pop 70 specified the population group of age 70 and older. RPR is the political capacity measurement, while DummyDA indicates the political parties relative to previous elections. Mobility measures the movement of people during the pandemic, while week/week2 are the time variables that represent weeks of deaths in each province. We control the weeks to monitor the relationship between the time and Covid-19 deaths. Finally, β indicates the main coefficients, and
is the error term.
The political capacity measures as well as the economic and demographic variables are time-invariant within a short period since they are reported annually; therefore, the appropriate methodology to test the hypothesis is to apply a random effects model. This allows us to control variables that cross levels and the changes across various sectors that account for individual heterogeneity. Therefore, it is suitable for multilevel or hierarchical modeling (Torres-Reyna, Citation2007). However, the severity of Covid-19 in South Africa over time is not linear. Accordingly, the linear regression mechanism might not be the best fit to explain the model.Footnote2 Thus, we employed the generalized additive model (GAM) to improve the accuracy of the testing.Footnote3 The GAM estimated the smooth components of the model using non-parametric smoothers via restricted maximum likelihood (REML) (Hastie & Tibshirani, Citation1990; Wood, Citation2017). It also increases the efficiency of the model. Additionally, we show the results of the random effects for robustness checks.
Data
In this study, we used multiple resources to test the model specifications. It accounts for the first wave of Covid-19 from 23 March to 30 August in nine provinces.Footnote4 Severity and mobility are recorded weekly, while the units of the economic factor, demographic controls and political capacity are annual. In terms of data process, normalization uses the min–max to rescale the variables, which is highly affected by outliers, especially when the dataset is not smooth and skewed. On the other hand, standardization rescales the data to the mean and the standard deviation (unit variance), which is recommended. Therefore, all variables in this study used standardized scales to make the coefficient comparable.
Severity
To explain severity, we chose to measure deaths; this is much more accurate than infection rate since the lack of testing would render a more inaccurate counting. We are aware that even deaths are undercounted by the official calculations of excess deaths. The measure of Covid-19 severity is total cumulative deaths per 100,000 population.Footnote5 The Covid-19 data was collected from the South Africa provincial dashboard.Footnote6 Due to the time-varying nature of the reports of deaths from weekdays to weekends for each province, we utilize the cumulative deaths as the weekly base. The skewed data distribution and outliers may bias the regression model and results. Thus, using the logged deaths variable allows us to normalize the data distribution. As noted, cumulative death counts only recorded Covid-19 deaths.
GDP per capita
Ideally, we would have used the subnational-level distribution of income, but in absence of this data, we used the most common proxy (albeit a faulty one): GDP per capita, collected from The Department of Statistics – South Africa. By controlling the GDP per capacity at the subnational level, we examined how the economic development impacted the efficiency of governments and COVID-19 outcomes. We logged this variable to re-scale the distribution.
Population 70 and over
The population data was collected from Statistics South Africa (Citation2021a). The elderly population is the most vulnerable group facing the pandemic. The population over 80 is the most affected group in developed societies, but in South Africa the life expectancy is lower, and accordingly we lower the threshold. Therefore, we controlled the population 70 years old and older in the model to observe how the aging population contributes to the severity of Covid-19 in South Africa. The variable is the percentage of the elderly population over the total population in each province.
Political capacity
Governments are active agents that influence the national agenda but are constrained by the mandate of stakeholders. Capable, autonomous governments need material and human resources to advance their policy goals. They do not maximize extraction because this would generate resistance and jeopardize their goal of permanence, but they will not be so “laissez-faire” as not to obtain sufficient resources to implement their desired goals. Theoretical examination of state capacity and governance have been prolific in recent years, yet few time series indicators and measures applicable to the national and subnational levels exist to assess the extent to which governments have political influence within a society. In this paper, we will present a measure of political extraction, using taxation models, and establish a measure of relative political reach that reflects the human resources available to a society based on informal labor sectors and insights from Arbetman (Citation1990) and on earlier work on political capacity (Organski & Kugler, Citation1980). Later on, Hanson & Sigman (Citation2021) noted that state capacity exerted a considerable influence on outcomes of economic development, civil conflict and international security. They provided multiple dimensions to measure state capacity.
Relative political reach
Measuring political mobilization has been a challenge for researchers. RPR measures the degree to which the population accepts the presence of government in their lives: societies characterized by little trust in elites or governments are more likely to actively avoid the government, cutting out involvement in economic and other interactions. This can also reflect a lack of trust. Human resources in a population are important not only because they will produce more in terms of increasing national power but also because they can be mobilized to support the agendas of policymakers, including the choice to go to war or to make significant economic reforms (Arbetman, Citation1990).
RPR estimates measure the degree to which the government is involved in economic activities of the population relative to the degree expected given the education and employment of the population. The groundwork for this measure can be found in Organski (Citation1958), and it was initially modeled and then expanded upon by Arbetman (Citation1990), Arbetman and Kugler (Citation1997) and Arbetman-Rabinowitz et al. (Citation2012), addressing existing methods for identifying the size of the informal economy, also defined as the degree to which economic activity occurs outside the purview of the government. While recognizing that a direct measure of informal activity poses challenges, due to the lack of published standardized data, particularly in cross country analysis, in the case of South Africa, we have been able to access data on the informal sector at the subnational level. South Africa’s Statistics Office (Statistics South Africa, Citation2021b) now publishes data that computes the number of individuals in the informal sector, so we were able to improve on the original model. On the other hand, statistics for education and age at the subnational level are not readily available in time-series format. Conceptually it is the same: RPR measures the working population in the formal sector controlling for labor variables and wealth; the unexplained portion of the model corresponds to the population that for political reasons the government has not been able to mobilize. The RPR formula is calculated as below:
where: Labor Force = labor force/total population, Year = the year; the fiscal model was calculated from 2010 to 2019. In running the weekly model, we used the results from the last available year; Informal sector = informal workers/working-age population, Bureaucracy = government employees/total population, and SGDP = subnational-level constant GDP, base 2000.
In general, a government with higher RPR can mobilize its population and get them to obey the public health directives, thus reducing the severity of COVID-19. On the other hand, less capable governments respond more slowly and are less able to mobilize the population to apply the virus-control policies. The provinces in which RPR is higher than average are relatively more capable of pursuing their policies. Thus, in this study, political capacity plays an essential role for local governments to deploy policies.
Relative political extraction
During a pandemic, governments need to convince their population to abide by the advice of health officials, especially when there are many constraints such as poverty, size of household and even a lack of running water, and align their behavior accordingly. But all provinces need to provide resources to expect that their populations will follow the stay-at-home orders and be able to bring food to their families’ tables. Therefore, this indicator of political capacity, RPE, measures the government’s capacity to extract resources to implement the desired policy (Arbetman & Kugler, Citation1997; Benson & Kugler, Citation1998; Organski & Kugler, Citation1980). The groundwork for this measure can be traced to Organski (Citation1958). The formula that been used to calculate South Africa RPE is shown below:
where Total Revenue includes all revenue generated within a state; Year: the fiscal model was calculated from 2010 to 2019. In running the weekly model, we used the results from the last available year; Fed TransfersFootnote7 are “federal transfers from the central government to the subnational governments such as grants, shared taxes, subsidies, including equitable shares and conditional grants” as published by the Department of Statistics, South Africa; and Mining represents value added in mining and quarrying, defined as “the value of output of the mining and quarrying industries less the value of intermediate consumption (intermediate inputs)” as published by the Department of Statistics, South Africa.
The capacity indicator reveals the effectiveness of governments. As with RPR, this index is calculated relative to the other provinces. The provinces that show RPE values higher than 1 are relatively more capable at directing resources to meet their policy objectives – in this case, minimizing the number of Covid-19-related deaths.
Mobility
To measure compliance with the stay-at-home orders, we use mobility. Population movement affects Covid-19 substantially, as the transmissions of the virus were mainly through individual interactions and travel among the provinces. Studies such as that of Schröder et al. (Citation2021) have shown that reduction in mobility led to a drastic reduction of cases, with “an increase of the doubling time from about 2.5 to about 18 days.” Thus, mobility is an important control. Google Mobility Data Reports (Citation2020) provides daily reports of where people go during the pandemic. It captures daily mobility trends in different sectors, such as grocery, work, park or other places. So, it also can be a proxy of political responses to the government guidelines. Grocery and other activities are in the opposite direction to residential movement. Therefore, in this study, we used only residential mobility to draw an intuitive picture of whether people stay home more or less during a pandemic.
Political dummy
Given the fact that the ANC has had the majority for over 25 years and that eight of the nine provinces have a premier who is affiliated with the ANC, to account for political alignment we compute for each province the increase in votes for the official opposition party (DA) relative to the last election in 2014. Provinces in which the DA has increased their representation are coded as 1. Ideally, we would code the three main parties (at the national level: ANC, 57.5%; DA, 20.77% and EFF, 10.8%); the other 45 parties have had less than 3% of the vote. The EFF is a new party that has captured a high percentage of votes for a new party, and there is no history from which to calculate changes.
Week/week2
Week and week squared are the time variables. Since we converted daily deaths to the weekly base, and the deaths over time are not linear, as we mentioned before, the week variables therefore capture the number of weeks when each province started to report data. We add week/week2 in the random-effects model to capture the curvature of the trend, as commonly used in other studies analyzing growth pattern and spread dynamics of COVID-19. The flexibility of GAM does not require such quadratic modeling. We present the results in the next section, showing the random effects model with week/week2 and the GAM without time controls are consistently stable.
Evidence from Covid-19 models
We test three different models, presented in , to examine economic and political variables that impact the severity of Covid-19. In the first basic model, Model 1, where politics is excluded, the explanatory power of Covid-19 lies with the economic variables. Higher levels of GDP per capita seem to be associated with higher deaths. A similar pattern is observed in Model 2 and GAM Model 3; however, the coefficient on the GDP per capita is reduced in subsequent models after adding politics.
Table 1. Random effects regression and generalized additive model (GAM) using total Covid-19 deaths per hundred thousand as dependent variable.
While this may seem counterintuitive at first, in the case of Covid-19 it has been observed that richer countries have experienced a higher level of deaths than poor countries, showing that wealth may not be a main determinant of severity mitigation of Covid-19, but age and co-morbidities are. Other explanations driving a positive link between wealth and severity of Covid-19 are better data in affluent provinces, and under-reported deaths of the poor.
Examining the role of politics after accounting for politics, both models – the random effects Model 2 and GAM Model 3 – show stable results. Politics in Model 3 adds 16% to the explanatory power of the basic model. In the case of South Africa, RPR and RPE, as explained earlier, are both key determinants of policy success. The two models show similar results that are also consistent with observations in South Africa’s fight with Covid-19. Both political variables, RPR and RPE, show that government capacity renders the best results for limiting the severity of Covid-19. RPR, similar to the HIV model, shows that compliance with government policies such as lockdown can help reduce the number of deaths.
RPE reflects the fact that governments require resources in order to enact policies. Taxation represents willingness on the part of the population (or enforcement ability on the part of the government) to transfer resources from private individuals to the government. This resource transfer is the bridge between politics and money; taxation demonstrates an endorsement or at least acceptance of a government by the population. RPE is significant and also has the expected sign, showing that mobilization of resources by subnational government units is important for reducing the severity of Covid-19.
The political alignment dummy is also significant in both models 2 and 3, indicating that ANC-backed central government has been rewarding provincial governments loyal to them and where ANC has been winning elections. Allocating more resources to loyal provinces allows ANC to increase its influence by allocating more resources to feed the population and fight Covid-19, and in the hopes of improving voter mobilization to stop the decrease in share of votes that the ANC has experienced since its 1994 inception.
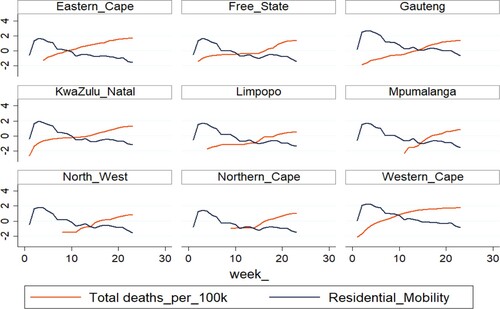
Surprisingly, mobility is not significant in Model 1 and Model 2 and has the opposite effect in Model 3, showing that limiting mobilization is associated with an increase in the number of deaths. While this is not what we expect in most countries, we argue that South Africa is a rare case, along with India for example, because dwellers in larger economic centers that had shut down had to return to their hometowns/townships to survive; these townships have more crowded living arrangements where social distancing was virtually impossible and severe restrictions only exacerbated the issues of unemployment, hunger and access to care. This again shows that in South Africa’s overcrowded townships, a remnant of the apartheid era, decreasing mobility through an extreme lockdown without a carefully thought-out policy implementation can have the opposite of the intended effect.
shows that mobility and deaths do not follow the same pattern, and as mobility decreases, the decline in total deaths, measured by deaths per hundred thousand, does not follow. In fact, in some cases, a decline in mobility is accompanied by an increase in the number of deaths, further validating our assertion that decline in mobility is not a key predictor of success in containing the virus.
Figure 1. Total deaths per hundred thousand and residential mobility by province. The y-axis represents a transformation of total deaths per hundred thousand, and the x-axis is the number of weeks. For the transformation, we logged the total deaths per hundred thousand to solve the issue of skewed distribution of the data. The figure compares the trajectory of the two variables: mobility (calculated as a percentage of total movement) and total deaths per hundred thousand (with a log transformation).
The provincial map of deaths per 100,000, presented in , shows that Mpumalanga, Limpopo and North West had the lowest numbers of deaths in the first wave of Covid-19. Northern Cape, Guateng and Kwazulu had average numbers of deaths. The highest numbers of deaths per 100,000 were observed in Western Cape and Eastern Cape. Accordingly, in , Mpumalanga, Limpopo and North West have relatively high RPR (above 1). Mpulanga has the highest RPR but also low RPE and Limpopo has an uptrend in both RPR and RPE, while North West has the highest RPE and average RPR. This indicates that political capacity can help to mitigate the severity of Covid-19.
Figure 2. Provincial map of South Africa, RPR and deaths per 100,000.
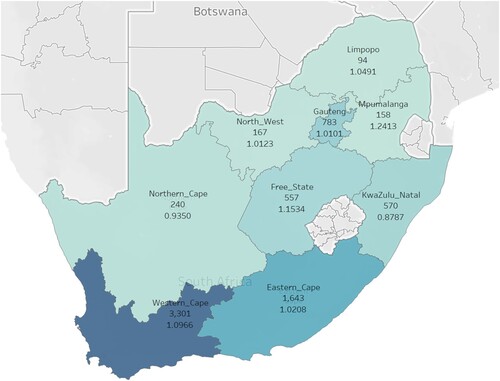
Table 2. Data points for RPE and RPR by provinces for 2019.
Conclusions
The goal of this paper was to examine the political and economic determinants of the severity of Covid-19 in South Africa at the subnational level, utilizing data from the first wave of the pandemic. Future analysis would look at whether the political system responded with the same pattern to subsequent waves. The vulnerability to Covid-19 is heightened by the prevalence of HIV, as people with HIV have an increased risk of death from Covid-19. We investigated two separate models, one utilizing yearly national-level data for HIV and the other using weekly Covid-19 data at the provincial level. The goal of both the national and subnational models is to identify the economic and political variables that can explain the successful mitigation of devastating consequences of biological disasters. The evidence from our HIV national-level analysis and Covid-19 subnational analysis shows that politics does matter and is a better predictor than level of income of mitigating the effects of pandemics. The subnational Covid-19 analysis shows similar findings at the provincial level, indicating that it is capable governments and not income level that is central to containing a pandemic.
While the expectation is that rich governments are better equipped to deal with crises such as biological disasters, we find that the most important drivers of success are how the wealth is distributed and how effective the subnational governments are in gaining the favor of the central government as well as in mobilizing resources and influencing the population’s behavior. These findings are especially important as the fourth wave of Covid-19, with the arrival of the highly virulent omicron variant, continues to overwhelm health systems worldwide and cause economic turmoil. Ultimately, the subnational governments’ response, which includes wider testing, acquisition and distribution of vaccines and encouraging vaccination compliance while balancing socio-economic challenges, will be central to recovery.
While several studies have looked at the role of trust and state capacity in mitigating health crises at the national level, very little has been done at the granularity of subnational units’ response. This study makes an important contribution by acknowledging the socio-economic and political non-homogeneity of subnational governments, as well as the political alignment between the central government and the subnational units, and the impact of this alignment on disaster mitigation. We acknowledge the limitation of using weekly Covid-19 deaths over excess deaths; however, because of the unavailability of official weekly excess deaths data, we think that using official Covid-19 deaths is a parsimonious indicator and expect that future work using excess deaths, once this information becomes available, will strengthen our results given the dispersion. Future direction of this work would include looking at whether the patterns observed in South Africa hold true for other countries at different levels of development. Subsequent research with a wider country set would be a natural next step as more reliable data becomes available, to produce actionable findings with implications for disaster mitigation policies.
Disclosure statement
No potential conflict of interest was reported by the authors.
Additional information
Notes on contributors
Ayesha Umar Wahedi
Ayesha Umar Wahedi is an Adjunct Professor at Portland State University and a Fellow at TransResearch Consortium. Her research interests include economic and political reform in emerging financial markets, capital flows and international trade, multinational corporations and their role in development, and economic/financial networks of terrorism. In her research, she also collects and analyzes sub-national public finance data to calculate government political capacity for subnational governments. She has calculated measures of political capacity at the subnational level for Pakistan to study the impact of foreign aid on terrorism, the results of which are published in Will Foreign Aid Help Curb Terrorism in Pakistan? with M. Arbetman-Rabinowitz (2012). Her most recent research focus is on cyber-terrorism especially as critical services become digitized in the post-pandemic world, natural disasters and climate change.
Yuzhu Zeng
Yuzhu Zeng is a PhD student in Political Science at Claremont Graduate University and TransResearch Consortium (TRC) research Fellow. She is focusing on International Relations and Comparative Politics. Her research interests include political capacity of governments, relations between U.S. and China, impact of inequality in developing world, and demographic within a subnational framework. Her current research is provincial migration and political capacity in China. She obtained an MBA from University of La Verne and received her M.A in International Studies from Claremont Graduate University.
Marina Arbetman-Rabinowitz
Marina Arbetman Rabinowitz is a research professor at Claremont Graduate Institute- Maldonado Institute and Adjunct Professor at La Sierra University. She is also a TRC board member and works extensively with this research group. Publications pertinent to this issue include Political Capacity & Economic behavior M. Arbetman-Rabinowitz (1997), several chapters on political capacity the effects on policy in the Performance of Nations (2012) and in Conflict and Cooperation (2020) at the regional and subnational levels. Her research has focused on empirical measures of government capacity based on national and subnational fiscal models and the relation between the shadow economy and productivity on population mobilization. Other recurrent topics have been conflict and economic recovery from war, the importance of foreign aid on which she has published extensively. Her current research is moving towards natural disasters. Her expertise is in data analysis, measurement, policy/ program evaluation and quality control applied to business and development and has worked as a consultant for US Government, IMF, World Bank, AmeriCorps, State of New Mexico and private banks and financial institutions worldwide.
Notes
1 The World Inequality Dataset came from Work Inequality Database (Citation2021).
2 As a first step, we introduced a “naïve” estimate of a pooled OLS regression to test out the relationship between COVID-19 severity and independent variables. As expected, the OLS model did not estimate the time-invariant variables and did not capture the unobserved effects of the subnational units of South Africa. Therefore, we used the random effects model and generalized additive model for our analysis.
3 We use GAM with restricted maximum likelihood for smoothness selection to estimate our hypothesis due to the non-linear relationship between the severity and time variables.
4 As the model only captures the first wave, we also extended the timeline until May 2021. The results are constantly stable.
5 We opt for cumulative deaths over excess deaths because cumulative death is an official statistic that is readily available. Excess deaths would be a better choice if available weekly, but it is not calculated for shorter time periods in a timely manner. It would be worth exploring the difference between the two models in a subsequent study, once the excess deaths estimate becomes available.
6 The dashboard of provincial South Africa Covid-19 data came from Media Hack Collective (Citation2021).
7 Our primary data source is The Department of Statistics – South Africa (Citation2021b).
References
- Abrams, E. M., & Szefler, S. J. (2020). COVID-19 and the impact of social determinants of health. The Lancet Respiratory Medicine, 8, 659–661.
- Africa Development Bank Group. (2021). South Africa economic outlook. https://www.afdb.org/en/countries/southern-africa/south-africa/south-africa-economic-outlook
- Aksoy, C. G., Eichengreen, B., & Saka, O. (2020). The political scar of epidemics. The London School of Economics and Political Science. Systemic Risk Centre. https://www.systemicrisk.ac.uk/sites/default/files/2020-08/dp-97.pdf
- Arbetman, M. (1990). The political economy of exchange rates fluctuations. Nashville: Vanderbilt University.
- Arbetman, M., & Kugler, J. (1997). Political capacity and economic behavior. New York: Routledge.
- Arbetman-Rabinowitz, M., Kugler, J., Abdollahian, M., Kang, K. K., Nelson, H. T., & Ronald L, T. (2012). Political performance. In J. Kugler & R. J. Tammen (Eds.), The performance of nations. Lanham: Rowan and Littlefield Publishers.
- BBC News. (2020). Coronavirus: South Africa eases strict lockdown as cases drop. https://www.bbc.com/news/world-africa-54186040
- Benson, M., & Kugler, J. (1998). Power parity, democracy, and the severity of internal violence. Journal of Conflict Resolution, 42(2), 196–209.
- BusinessTech. (2020). The staggering difference between the richest and poorest provinces in South Africa. Retrieved May 20, 2021, from https://businesstech.co.za/news/finance/369730/the-staggering-difference-between-the-richest-and-poorest-provinces-in-south-africa/
- Centers for Disease Control and Prevention. (2021). What to know about HIV and COVID-19. https://www.cdc.gov/coronavirus/2019-ncov/need-extra-precautions/hiv.html#:~:text=Based%20on%20limited%20data%2C%20we,increased%20risk%20for%20severe%20illness
- Fiva, J. H., Geys, B., Heggedal, T., & Sørensen, R. (2021). Political alignment and bureaucratic pay. Journal of Public Administration Research and Theory. doi:10.1093/jopart/muaa053
- Francis, D., Valodia, I., & Webster, E. (2020). Politics, policy, and inequality in South Africa under COVID-19. Agrarian South: Journal of Political Economy, 2277976020970036, 342–355.
- Google LLC. (2020). Google COVID-19 community mobility reports. [Data set]. Google. https://www.google.com/Covid-1919/mobility/
- Guillen, M. (2020). The politics of pandemics: Why some countries respond better than others. Knowledge@Wharton [Unpublished]. https://knowledge.wharton.upenn.edu/article/politics-pandemics-countries-respond-better-others/
- Hanson, J., & Sigman, R. (2021). Leviathan’s latent dimensions: Measuring state capacity for comparative political research. The Journal of Politics, 83(4), 1495–1510. https://doi.org/10.1086/715066
- Hastie, T. J., & Tibshirani, R. J. (1990). Generalized additive models. Chapman & Hall/CRC. ISBN: 978-0-412-34390-2.
- Lehohla, P. (2017). Poverty trends in South Africa: An examination of absolute poverty between 2006 and 2015 (Report No. 03-10-06). Statistics South Africa. http://www.statssa.gov.za/publications/Report-03-10-06/Report-03-10-062015.pdf
- Media Hack Collective. (2021). Coronavirus in South Africa provinces. https://mediahack.co.za/datastories/coronavirus/provinces/
- Nwosu, C. O., & Oyenubi, A. (2021). Income-related health inequalities associated with the coronavirus pandemic in South Africa: A decomposition analysis. International Journal for Equity in Health, 20(1), 1–12.
- OECD. (2021). Economic forecast summary. South Africa Economic Snapshot. https://www.oecd.org/economy/south-africa-economic-snapshot/
- Organski, A. F. K. (1958). World Politics. New York: Alfred A. Knopf.
- Organski, A. F. K., & Kugler, J. (1980). The war ledger. Chicago: University of Chicago Press.
- Reuters. (2021, May 13). S.Africa’s Covid-19 deaths toll much higher than official tally-report. https://www.reuters.com/world/africa/safricas-covid-19-death-toll-much-higher-than-official-tally-report-2021-05-13/
- Roberts, A. (2020). Pandemics and politics. Survival, 62(5), 7–40.
- Schröder, M., Bossert, A., Kersting, M., & Aeff, S. (2021, March 2). COVID-19 in South Africa: Outbreak despite interventions. Scientific Reports, 11, 4956.
- South African Government. (2021). Regulations and guidelines-coronavirus COVID-19. https://www.gov.za/Covid-19/resources/regulations-and-guidelines-coronavirus-Covid-19
- Statistics South Africa. (2021a). Census: Population projections. [Data set]. http://www.statssa.gov.za/
- Statistics South Africa. (2021b). The department of statistics South Africa. [Data set]. http://www.statssa.gov.za/
- The Washington Post. (2022, January 6). South Africa tourism was just starting to rebound. Then omicron arrived. https://www.washingtonpost.com/travel/2022/01/06/south-africa-omicron-tourism-travel-bans/
- The World Bank in South Africa. (2021, May 20). The World Bank’s strategy in South Africa reflects the country’s development priorities and its unique leadership position at sub-regional and continental levels. Retrieved, May 20, 2020, from https://www.worldbank.org/en/country/southafrica/overview
- Torres-Reyna, O. (2007). Panel data analysis fixed and random effects using Stata (v. 4.2). Data & Statistical Services, Princeton University, 112.
- Wood, S. N. (2017). Generalized additive models: An introduction with R. Boca Raton: CRC Press.
- WorldAtlas. (n.d.). The richest and the poorest provinces of South Africa. https://www.worldatlas.com/articles/the-richest-and-poorest-provinces-of-south-africa.html
- World Inequality Database. (2021). https://wid.world/data/
- Worldometer. (2021, May 20). Covid-19 coronavirus pandemic. Retrieved May 20, 2021, from https://www.worldometers.info/coronavirus/