
 ?Mathematical formulae have been encoded as MathML and are displayed in this HTML version using MathJax in order to improve their display. Uncheck the box to turn MathJax off. This feature requires Javascript. Click on a formula to zoom.
ABSTRACT
We analyze the first wave of COVID-19 fatalities in Spain at the subnational level to identify why some Autonomous Communities (ACs) were more successful at minimizing mortality levels. Our work adds to emerging literature on policy implications of pandemics and the role of governments in containing crises. Additionally, because national responses to crises are not homogeneous, we develop empirical measures of subnational political capacity. We investigate the relative capacity of governments in mobilizing the population to follow national health policy recommendations and extracting resources to implement those policies. Furthermore, we examine the effects of political alignment between the subnational and central governments in determining the country’s success containing the outbreak. Through a random-effects panel regression and a generalized additive model, we find that wealth and demography account for half of the variance in COVID-19 deaths across ACs, while including political capacity and alignment increases the variance explained above 70%.
RÉSUMÉ
Nous analysons la première vague de décès liés au COVID-19 en Espagne au niveau infranational afin d’identifier les raisons pour lesquelles certaines communautés autonomes (CA) ont mieux réussi que d’autres à minimiser les taux de mortalité. Notre recherche s’ajoute à la littérature émergente sur les implications politiques des pandémies et le rôle des gouvernements pour contenir les crises. En outre, les réponses nationales aux crises n’étant pas homogènes, nous élaborons des mesures empiriques de la capacité politique infranationale. Nous étudions la capacité relative des gouvernements à mobiliser la population pour suivre les recommandations de la politique nationale de santé, et à extraire des ressources pour la mise en œuvre de ces politiques. En outre, nous examinons les effets de l’alignement politique entre les gouvernements central et infranationaux dans la détermination du succès du pays à contenir la flambée épidémique. Par le biais d’une régression de panel à effets aléatoires et d’un modèle additif généralisé, nous constatons que la richesse et la démographie expliquent la moitié de la variance des décès liés au COVID-19 entre les CA, tandis que l’inclusion de la capacité et de l’alignement politiques augmente la variance expliquée au-delà de 70 %.
Introduction
Spain was one of the earliest countries to be highly affected during the first wave of the Coronavirus Disease 2019 (COVID-19) pandemic. The shape of the demographic pyramid of European countries—characterized by aging populations and longer life expectancies—has preconditioned them to be more severely impacted by the pandemic than other countries. As we write this analysis, most of the developed world has entered a second wave, which has caught policymakers by surprise since they lacked a common understanding of levers to support public health advise and mitigate the consequences. This second wave has shown a rapid increase in infections, affecting a much younger and less vulnerable segment of the population, but for now inflicting a substantially lower number of deaths in Spain. Epidemiological models have adeptly predicted and simulated the potential levels of infections and deaths under different scenarios. Nevertheless, these models have failed to include structural explanations in their analyses, as well as unique characteristics of subnational units that might predispose them to exhibit different severity outcomes.
The most common explanatory variables incorporated into the examination of COVID-19 mortality levels include demographic, behavioral, and sociological variables such as the age structure of the population, a country’s exposure to travellers, degree of urbanization, and the number of multigenerational households. Other available tools have also been effective toward evaluating and informing policy alternatives. For instance, Spain’s Ministry of Health has established a “traffic light” system, which determines the level of risk for municipalities with populations of 5,000 or greater through the evaluation of several metrics, such as transmission potential and ICU capacity (Linde, Citation2020). Analysts are also benefitting from Google’s Community Mobility reports, which compare mobility trends to “the median value, for the corresponding day of the week, during the five-week period Jan 3-Feb 6, 2020” (Google LLC, Citation2020). These mobility indicators provide insights about the individual’s response to shelter-in-place orders and mobility restrictions. Another widely used indicator, the University of Oxford’s COVID-19 Government Response Tracker (Hale et al.,Citation2020a), offers a “cross-national, cross-temporal measure to understand how government responses have evolved over the full period of the disease’s spread” (et al., Citation2020b). The project’s “Stringency Index,” calculated as an aggregate of government measures (i.e. restrictions on gatherings, closings of workplace and schools, stay-at-home requirements), has been applied in analyses that show that a more “stringent” government response, and early implementation of that response, can reduce the average growth rate in deaths (et al., Citation2020c). The data is offered at the global level, except for the mobility index. Although they offer detailed explanations of different policy approaches, they do not consider the extent to which they are successfully implemented and followed by the population. It is left to researchers to examine the effect of political and societal factors on the success of government policies.
Accordingly, we posit that the analyses and evaluations lack a political perspective. Both the political context of the country and the capacity of the government to implement its policy agenda strongly contribute to the success or failure of plans that minimize the number of infections and deaths. Political capacity accounted for by two concepts, regardless of political ideology or form of government: (1) the capacity of local governments to mobilize the population to trust and follow official advice; and (2) the capacity of local government to collect resources that enable them to implement their policies (Organski & Kugler, Citation1980; Arbetman-Rabinowitz & Kugler, Citation1997; Arbetman-Rabinowitz et al., Citation2012). Without a mobilized population and without resources, governments cannot have long-term success in advancing their goals. Accordingly, we incorporate measures of political capacity into our analysis, which are designed to facilitate a structural comparison among subnational units (in our case, Spain’s Autonomous Communities). Furthermore, when the responsibility of response is assumed by the central government in conjunction with the subnational administrative units, the political alignment of the central government and sublevels of governance will have an impact on the easiness of coordination and the successful implementation of a cohesive response plan. As such, we consider the degree of political alignment between the central government and each Autonomous Community. The examination of the distinct characteristics of each subnational unit is necessary since the response is not centralized and the analysis of the country as a homogenous unit is misleading.
The data across Europe shows that, in most countries, the second wave has been less lethal due to improved medical understanding of the disease and its treatment. Mortality level reductions have varied across countries, from 17% in Belgium to 70% in Denmark, yielding an average decline in mortality of 45%. However, other countries have experienced worse trends during the second wave of the virus than they experienced during the first: the number of deaths in Poland increased tenfold, Romania saw a 230% increase in deaths, and Portugal and Hungary have experienced lesser but similar shifts in mortality (Worldometer, Citation2020). Overall, lessons from the first wave of the pandemic have informed policy responses to the second wave (Griffin, Citation2020). We thus expect our findings to contribute to the creation of strategies that minimize the mortality levels of COVID-19.
In the following sections, we discuss the national and subnational context of the country in terms of the severity of the virus and the political environment. We then proceed to examine the severity of the first wave in Spain’s Autonomous Communities, measured in deaths during the months of March through the end of August 2020 (i.e. the first wave of the pandemic). Our goal is to identify relevant factors that explain the differences in COVID-19 deaths across Autonomous Communities. We start by describing the situation outlook in the country.
The national context
The number of cases and deaths in Spain have been among the highest in Europe and the world. exhibits a comparison among a sample of European countries, which were the first to suffer the most severe impact of the virus. At the time of writing, Spain ranks sixth in number of cases worldwide. In deaths per million individuals, the outcome is even more dire: Spain ranks fifth with 850 deaths per million individuals (compared to the world average of 164.4). Not counting city states, Spain ranks third in the world with regard to highest deaths per million (Worldometer, Citation2020).
Figure 1. Cumulative deaths per one million individuals for a sample of European countries.Footnote1
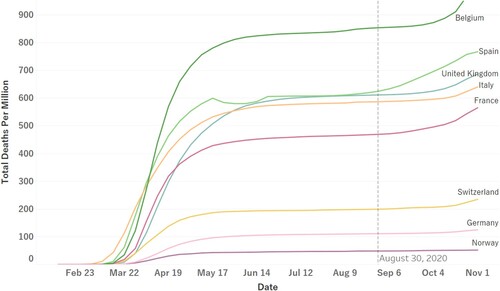
Spain’s initially high rates of infection and death are attributed to its characteristically older population. Spain’s population pyramid shows a large segment of aging population, with 6% of the population currently over the age of 80 and 19.3% over the age of 65 (Pérez Díaz, Abellán García, Aceituno Nieto, & Ramiro Fariñas, Citation2020). More specifically, as with Italy, higher infection and death rates were attributed to outbreaks in nursing homes with inadequate medical staffing, knowledge, or equipment to treat patients and to slow the spread. In reality, the elderly in Spain is very self-sufficient and independent: 18% of single-person households are over 80 (850,000) and actively participate in politics (Tyora, Citation2019).
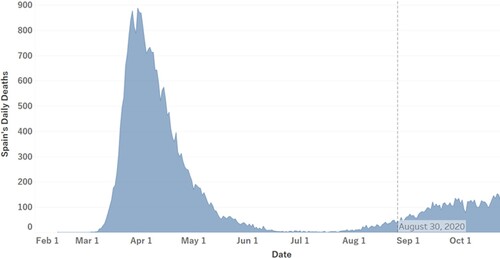
When COVID-19 was first detected in Spain, the main policy goal was to “flatten the curve” so that the healthcare system would not be overwhelmed. Throughout the pandemic, the Spanish healthcare system has reached levels above capacity several times, especially in urban areas where the virus spreads at a very quick pace (Condes & Arribas, Citation2021). displays the number of COVID-19 deaths during the period of our analysis and the beginning of the second wave. Through the second wave thus far infections have climbed sharply, and hospitalizations have started to overwhelm the system; as new daily cases accumulate, we expect this trend to continue.
Figure 2. Nationwide daily deaths due to COVID-19 in Spain from February through August 2020.Footnote2
The rapid spread of the virus urged the national government to rapidly implement a response plan in coordination with the governments of Autonomous Communities. Yet, coordination has shown to be difficult because of political polarization that has intensified over the last few years. The 2019 elections, the fourth held since 2015, exhibited the expansion of separatism, political polarization, and as expected in a country that has not performed well economically in the last decade, voters assign high salience to unemployment and economic crises. Although Spain employs a multi-party system, for the past 40 years it has been mainly governed by two parties: the leftist Spanish Socialist Workers Party (PSOE, by its Spanish initials) and the more conservative Popular Party (PP). In 2019, after months of political stalemate, an agreement between the PSOE and the Podemos party (also left-wing) formed Spain’s first coalition government since the 1970s, giving Pedro Sanchez Perez-Castejón his second term as Prime Minister despite not having won the required absolute majority of Parliament votes (176) to form a government. The credibility of the government coalition has been weakened by accusations of “radicalism” from right-wing parties, and long-established conservative governments in significant Communities such as Madrid, which has been ruled by the PP for the past 25 years. The pronounced political polarization has intensified disagreement between several Autonomous Communities and the central government, causing delays in the implementation of a nationwide response.
Infection prevention measures are essential to contain the severity of the virus until available treatments are proved effective and a vaccine is developed. Despite the lack of a unified message and strategy from the central government at the initial stages of the pandemic, national compliance of stay-at-home orders remained high as shown in , which shows how Oxford’s stringency index of the national government’s policy approach, weekly deaths, and mobility change over time. The mobility measure in , captures an average of the percentage change in trends of travel to and from grocery stores, transit stations, parks, workplaces, recreational and retail businesses throughout the period of our analysis (Google LLC, Citation2020).Footnote3 The correlation between mobility and stringency at the national level is −0.74, and since there is no data for Spain’s policy stringency at the subnational level, we expect subnational-level mobility to capture the effect of policy stringency. The simultaneous path of mobility and deaths goes against the commonly assumed cause–effect relationship between these two variables. suggests that the directionality might not be as clear: policy and behavior are also responsive to severity levels. In the following sections, we will test if this effect directionality is clearer at the subnational level.
Figure 3. Deaths, Stringency Index, and Mobility Percent Change: State of Emergency March 14-June 21.
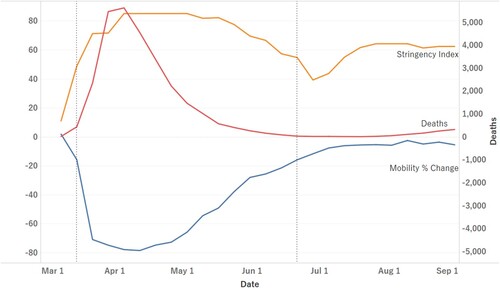
It is also apparent from that fatigue settled in over time: the national state of emergency (implemented on March 14th, 2020) officially ended on June 21st, 2020, yet the trend shows mobility increasing to normal levels since the end of April. Still, the Spanish population has generally grown more amenable to recommended measures. As of August 2020, only 10% of the population reported not wearing masks as compared to 20% in May (Viñas, Citation2020). In spite of the current general agreement about the effectiveness of mask-wearing in containing the spread of the virus, during the first wave of the pandemic, policy-makers were still debating its efficacy, leading to mixed messaging and lack of consistent mask-wearing recommendations (Centro de Coordinacion y Alertas de Emergencia Sanitaria, Citation2020).
Yet, Spain’s situation appears slightly paradoxical: in spite of the public abiding by public health measures, the mitigative measures have been less effective than expected (Pichel, Citation2020). A national-level examination of policy responses and changes in behavior, such as mobility trends and mask-usage, does not offer an in-depth understanding of the success or failure of these measures. A more detailed examination of the different Autonomous Communities reveals a more complete picture of the situation—the response is not uniform across subnational units.
The subnational context
Due to the politically polarized environment, the subnational units have had to fend for themselves and foster partnerships between one another, facing a central government that refuses to take charge and implement a coordinated response. A recent survey by the Spanish Centre of Sociological Research (Centro de Investigaciones Sociológicas, CIS) found that 15.8% of respondents would like the central government to take over the fight against the pandemic, but only 4.8% would like their Autonomous Community to do so on their own (CIS, Citation2020). However, 72.3% would like a collaborative response between the central government and the Autonomous Communities.
The lack of collaboration and increased fatality is not only a result of partisan politics, but also of a highly regionalized healthcare system. Recognizing the importance of the role that each Autonomous Community plays in the provision of public services, such as healthcare and education, the central government approved a financial support fund in mid-June. This fund would disburse 16 billion Euros to Autonomous Communities and Cities (i.e. Ceuta and Melilla) in four payments as a non-reimbursable credit to mitigate the budgetary impact of the pandemic. Nine billion Euros would be exclusively allocated towards healthcare expenditures, two billion towards education, and five billion towards economic recovery from tax deficits and reduced use of public transportation (La Moncloa, Citation2020). For the first disbursement in July, each Autonomous Community was allocated resources according to criteria considering intensive care unit (ICU) admissions (30%), hospitalizations (25%), number of cardiopulmonary resuscitation (CPR) tests performed (10%) and protected population equivalent (35%).Footnote4
The criteria for allocation were not supported by the presidents of six Autonomous Communities. Madrid and Cataluña considered total population a better indicator of healthcare needs, more rural Autonomous Communities questioned the resources allocated to transportation, and the tourism centers of the country who make up 12.3% of national gross domestic product (GDP) demanded more resources towards economic recovery (Spain National Statistics Institute, Citation2020). Grievances with the allocation of financial support for the pandemic have also been expressed by the Spanish population. Surveys indicate that 57% of Spaniards do not trust the government’s coalition to handle the pandemic, and 75% would like to see more collaboration between the Presidents of the Autonomous Communities and Pedro Sanchez Perez-Castejón’s coalition (Cruz, Citation2020).
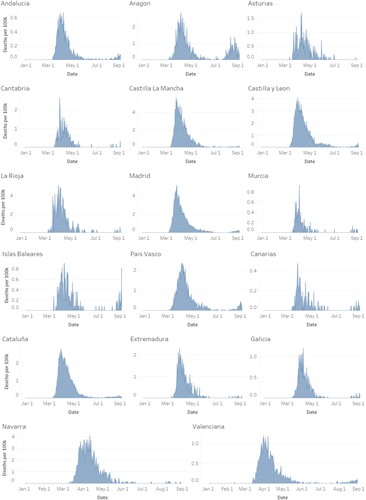
displays the number of daily deaths per 100,000 individuals for each Autonomous Community throughout the period of analysis. With the exceptions of Aragon and Islas Baleares, most communities did not see the start of a second spike until after August 2020. Similar to the national picture, most communities experienced the highest severity between the months of March and May. Castilla La Mancha, La Rioja, and Madrid had the highest spikes, seeing up to 5.6, 5.2, and 5.1 daily deaths per 100,000 respectively. Whereas Madrid has the highest population density among the 17 subnational units, Castilla La Mancha is among the three least densely populated. Similarly, Madrid has consistently had the highest GDP per capita, while Castilla La Mancha is among the five poorest Autonomous Communities. These differences in demographic and economic characteristics, which have been shown to be important predictors of severity at the national level, exemplify the need for a more detailed subnational level analysis that considers political factors.
Figure 4. Subnational daily deaths due to COVID-19 in ACs from February through August 2020.Footnote5
We posit that the structural capacity of the subnational units, regardless of a conditioned disbursement of financial aid and demographic differences, gives the Autonomous Communities great leverage when it comes to influencing the behavior of the population and implementing policy. Consequently, our model attempts to identify the determinants of differences in the lethal effects of COVID-19 among Autonomous Communities. We focus on the political capacity of the subnational units, and the effect of political leanings on effective policies. We test if shared ideologies with the central coalition coupled with local political capacity makes cooperation and coordination more effective in lessening the severity of COVID-19 in Spain’s Autonomous Communities.
Data and model specifications
Political capacity is not a new concept. It has proven to be an effective explanatory variable for the successful advancement of a government’s policy agenda. Kugler, Organski, Johnson, and Cohen (Citation1983) and Arbetman-Rabinowitz and Kugler (Citation1997), for instance, show that political capacity reduces fertility rates, more strongly in developed countries, and decreases mortality rates overall. In a more comparative approach, Swaminathan and Thomas (Citation2007) find that Indian state governments with high levels of political capacity are able to reduce infant mortality, especially in low-and middle-income states. Consequently, we expect that in addition to the established explanations of mortality during the pandemic, political capacity will play a significant role in containing the severity of the pandemic.
Severity: COVID-19 deaths
As a measure of severity, we collected daily COVID-19 deaths for each Autonomous Community from the Spanish Ministry of Health (Centro de Coordinación y Alertas de Emergencia Sanitaria, Citation2020a), which has made daily detailed reports (Reports No.1 – No.197) publicly available since the beginning of the crisis. To account for possible data reporting issues, we also collected data from the University of Washington’s Institute for Health Metrics and Evaluation (IHME) (Citation2020). We attribute a few differences in weekly deaths to data corrections from the Spanish government that are captured on different dates by the IHME data. Overall, the sources converge on cumulative deaths, with a correlation between cumulative deaths from the two sources of 0.99. Accordingly, we conduct our analysis using the Spanish Ministry of Health’s data.
We are aware that COVID-19 fatality data only shows a partial version of the actual mortality levels of the pandemic. Official counts may not provide a comprehensive account of the severity since deaths are usually considered COVID-19-related based on varying definitions and administrative data gathering processes. Furthermore, those individuals who are not tested post-mortem might not be included in the actual count. Many scholars thus prefer to use excess death data when measuring actual COVID-19 mortality levels. Even though we do not have access to excess deaths data for Spain at the subnational level, using the same type of mortality measure for all Autonomous Communities eliminates some bias in the comparison across units.
Weekly data was collected from the week each Autonomous Community had its first COVID-19 attributable death to the last week of August 2020, the most recent date included in our analysis. As a result, the number of weeks for each Autonomous Community ranges from 24 to 26 total weeks. We use the log of cumulative deaths per 100,000 individuals for every week as our dependent variable. A Im-Pesaran-Shin unit root for heterogeneous panels (Im, Pesaran, & Shin, Citation2003) suggests our dependent variable is stationary. Additionally, using cumulative deaths allows us to correct for daily discrepancies in the reporting of deaths.
Established explanations
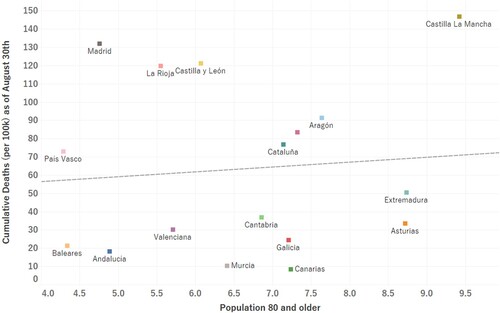
We include the percentage of the population aged 80 years and older as a control, given that it has been the most affected demographic group. A common trend in COVID-19 fatality reporting data suggests that case fatality ratios (CFRs) largely depend on the age distribution of the population and their underlying health conditions. Even though people ages 80 and older usually constitute the smallest portion of confirmed cases, the CFR associated with this age group tends to be the highest (WHO, Citation2020; CDC, Citation2020; Wu & McGoogan, Citation2020; Kang & Jung, Citation2020; Roser, Ritchie, Ortiz-Ospina, & Hasell, Citation2020). shows the percent of the population aged 80 years and older against the total cumulative deaths per 100,000 individuals that each Autonomous Community had as of August 30th. Although there is an observed positive relationship, the relationship does not seem to be very strong, suggesting the need to consider other explanatory factors.
Literature on past public health pandemics and epidemics shows commonalities in implemented policy responses from social distancing and isolation during the 1918 “Spanish flu,” to contact tracing, disinfection, and testing during the most recent Ebola outbreak (Bell et al., Citation2016; Martini, Gazzaniga, Bragazzi, & Barberis, Citation2019; Ewing, Citation2021). Given that vaccines were not yet available during the period of analysis, the effective implementation of preventive policy measures such as stay-at-home recommendations was essential. Accordingly, as discussed in the national context section, we also introduce Google’s mobility trends into our analysis as indicators of changes in individual mobility throughout the pandemic on a weekly basis (Google LLC, Citation2020). Given the nature of COVID-19 transmission, the common assumption is that a mobility reduction impacts severity through a reduction of infections. This metric also partially reflects the pandemic response of each Autonomous Community; a visual representation () and explanation are included in the previous section on national context. Lastly, we control for GDP per capita, which is traditionally included because of the assumption that more resources equate to more favorable circumstances to confront the crisis.
Political coordination and cooperation
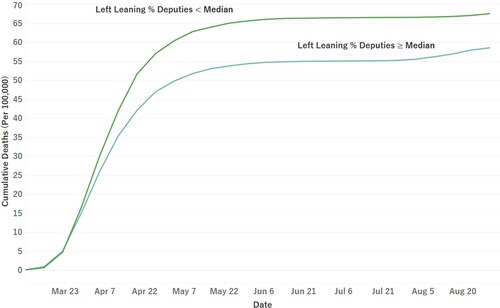
Given the leftist nature of the current central government coalition, deputies advocating for the interests of the Autonomous Communities and the political parties they represent will find favorable circumstances to advance those interests if they are more politically aligned with the governing coalition (in this case, if they are more leftist). Similarly, policy agendas laid out by the governing coalition are more likely to be accepted and implemented by Autonomous Communities with whom they are politically aligned. This has been observed throughout the course of the COVID-19 pandemic, during which the central government has struggled to work with more right-leaning Autonomous Communities to implement a coordinated response. shows the average cumulative deaths among Autonomous Communities according to their political leaning. The gap between the mortality paths suggests that political ideology should be further examined. We therefore expect Autonomous Communities closely aligned to the central government to have an easier time limiting the severity of the virus.
Figure 5. Cumulative deaths per 100,000 individuals VS population 80 and older in Spanish Autonomous Communities.
To operationalize the likelihood of coordination and cooperation between the central and subnational governments, we construct a dummy variable that takes a value of “1” when the percentage of left-leaning deputies (including left-leaning separatists) in Congress for each Autonomous Community is above the national median.Footnote6 This is also under the assumption that the population of each Autonomous Community elects deputies that align with and advocate for its preferences. In the same way, even with a similar political leaning to that of the central governing coalition, subnational governments must be able to mobilize their population to follow the implemented policy strategies in order to mitigate the severity of the virus. As such, we interact this variable with the Relative Political Reach (RPR) indicator, discussed in the following section.
Political capacity: relative political extraction and reach
Highly capable governments – those able to extract the resources needed to implement their policy agenda and mobilize the population to abide by that agenda – should outperform other communities in the mitigation of COVID-19. Relative Political Extraction (RPE) operationalizes the ability of governments to “appropriate portions of the national output to advance public goals” (Arbetman-Rabinowitz & Kugler, Citation1997; Arbetman-Rabinowitz et al., Citation2012; Kugler, Kang, Rabinowitz, & Kugler, Citation2015). The indicator of each Autonomous Community is estimated following a modified version of the developed societies model specified by Arbetman-Rabinowitz & Kugler, Citation1997 and Kugler and Tammen (Citation2012, p. 40):
where “tax” is the tax revenue of the Autonomous Community (in current prices), “AC’s GDP” is the Autonomous Community’s nominal domestic product, “exports” is total exports in current prices, and “AC’s GDP pc” is the GDP per capita of the Autonomous Community. Due to the unique economic agreement between Pais Vasco and the central government, there is no data available for the Community’s tax revenue. As such, transfers received by Pais Vasco from the central government are used instead, given that the ratio relative to GDP is almost equivalent to the median tax ratio for the rest of Spain. The final RPE value is calculated by dividing the actual tax ratio by the predicted values, using this methodology we infer that what is not explained directly by economic variables is the result of political behavior. We expect that high levels of RPE will be associated with a less severe outcome, since high scores of RPE will indicate more resources extracted and hence more resources available to finance comprehensive policy responses.
The second component of political capacity, Relative Political Reach (RPR), measures the ability of governments to mobilize populations under their control to advance their policy goals (Arbetman-Rabinowitz & Kugler, Citation1997; Arbetman-Rabinowitz et al., Citation2012). RPR is calculated following an adjusted version (due to data availability) of the model specified in Arbetman-Rabinowitz and Kugler (Citation1997) and Kugler and Tammen (Citation2012, p. 40):
where the activity rate of the working age population (“activity rate”) is regressed on the unemployment rate (“unemployment”), the secondary education attainment rate (“education”), and population density (“PopDensity”), measured as inhabitants per square kilometer. The final RPR value is calculated by dividing the actual activity ratio by the predicted values. The RPR indicator assumes that given the same level of output, ceteris paribus, having less employees in the formal sector implies that part of the production is coming from the informal sector. Therefore, the government has much less leverage to mobilize the informal sector segment of the labor force. We infer that the gap between the explanatory power of the demographic variables and their predicted values represents the portion of the population that the government can influence and mobilize.
We recognize, however, that our analysis should account for the recent political context of the country, considering that subnational governments can be constrained or enabled by central governments. Specifically, we expect the impact of RPR on mortality to be conditional on the easiness of coordination between the central government and each Autonomous Community. We therefore propose the following general function:
We specify our model as follows:
We initially run a random effects panel regression so that the effects of time-invariant variables can be estimated. Furthermore, including time-invariant variables allows us to include structural variables that are central to our argument. The use of a random effects model implies the assumption that the unobserved characteristics of the Autonomous Communities do not affect the explanatory variables. As such, we should control for unobserved effects that might be correlated with the error term. We therefore include in our model other important time-constant controls, such as demographic and economic factors, that we think might be affecting the explanatory variables (Wooldridge, Citation2012). We utilize an interactive term between RPR and government coalition to test the hypothesized conditional effects: high political capacity is necessary but not sufficient to mitigate the severity of the virus. The same is then true for political alignment, which without political capacity does not reduce deaths. The time component is squared to model the non-linear trend of mortality, improving the model’s fit. Recognizing that the relationship between time and mortality is non-linear and might not be appropriately modelled with linear regression techniques, we additionally run a generalized additive model (GAM) with community-fixed effects (Hastie & Tibshirani, Citation1986; Yu, Duan, Jiang, & Zhang, Citation2020; Wu et al., Citation2020). With GAM, the effect of time is modelled non-parametrically as a sum of smooth functions, where we use restricted maximum likelihood (REML) for smoothness selection. The other covariates are simultaneously estimated as linear effects.
Results
Results of our model specification are presented in Table A. We report coefficients of normalized data to allow for relative comparisons of the coefficients. Model 1 and Model 2 show results from random-effects linear regressions.Footnote7 Model 1 excludes political variables and Model 2 incorporates politics. Model 3 shows the results of the GAM that models time non-parametrically.Footnote8 Compared to Model 1, GDP per capita loses its significance when political variables are included in Model 2.Footnote9 Population of age 80 and older has a positive and statistically significant effect on severity given the vulnerability of this subset of the population. However, this effect is reduced once we control for political variables. This reduced effect shows the importance of a politically capable government, which despite conditions that predispose the Autonomous Community to have a more severe outcome, can mitigate the lethality of the virus. The mobility percentage change is significant, but the expected sign is negative, contrary to expectations. In spite of having lagged the mobility variable, the sign is still negative. We attribute this effect to endogeneity since the percentage change in mobility is also responsive to the mortality of the virus, causing simultaneity. This can be evidenced by (included in the national context section): mobility decreases simultaneously as deaths increase. The figure suggests that unlike infections, the time relationship between deaths and mobility is not as clear. Given that the typical incubation period of the COVID-19 virus is about five days, approximately 99% of people who get infected and develop symptoms, do so within 14 days (Lauer et al., Citation2020). Accordingly, we tested mobility with various lags greater than two weeks, but the effect became weaker, and the sign remained negative regardless of the number of lags.Footnote10
The inclusion of political variables in model 2 increases the explained variation between Autonomous Communities by 22%, emphasizing that analyzing the country as a homogeneous unit masks the importance of the subnational level analysis. Model 2 shows that RPE has a negative effect on severity. A government that is able to collect resources to implement its policy agenda is thus able to reduce the severity of the pandemic. This model also captures the expected conditional effect of a high percentage of left-leaning deputies on the severity of COVID-19 across different levels of RPR. The individual coefficients of the interaction’s constitutive terms represent their effect when the moderating variable is zero (Brambor, Clark, & Golder, Citation2006). As such, the coefficient of RPR indicates that when in disagreement with the government coalition, even politically capable governments are unable to minimize the severity of the virus. However, the individual coefficient for a high number of left-leaning deputies on severity is uninterpretable since RPR cannot take zero values.
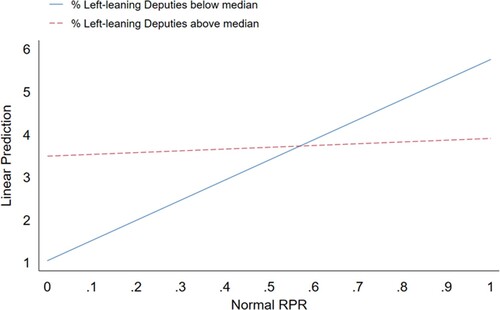
shows that at high levels of RPR, Autonomous Communities with a high percentage of left-leaning deputies (ideologically aligned with the central government coalition) are able to prevent a large increase in cumulative deaths when compared to those with percentages below the national median.
Figure 6. Average Cumulative Deaths (per 100,000 individuals) for Spanish Autonomous Communities by Political Alignment.
Furthermore, displays how the marginal effects of this alignment become less positive as RPR increases until it eventually becomes negative at high levels of RPR. Autonomous Communities with both high levels of RPR and political alignment with the central government can minimize the mortality of the virus.
Figure 7. Predictive Margins
The effect is not significant, however, between RPR levels of approximately 0.45 and 0.75 (normalized RPR scores). Five out of the six Autonomous Communities with RPR within this range are not politically aligned with the government coalition (dummy = 0), exhibiting that trust and cooperation between the subnational and central governments are critical to mobilize the population and for the success of policy implementation. The conditional effect is again statistically significant and negative at RPR values higher than approximately 0.75 (normalized). The corresponding non-normalized values of RPR where the marginal effects become negative on the severity are values above 1, indicating that if the population is not highly mobilized, they will not abide by the policy recommendations, producing detrimental consequences. Finally, results of Model 3 show that our findings are robust to the specification of the time component; the coefficient sizes of the linear covariates do not vary drastically, and signs are stable as well.
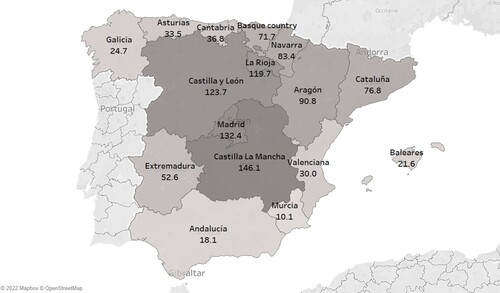
A closer examination of some example cases such as Madrid, Castilla La Mancha, Cataluña, Andalucía, and Asturias further exemplifies the impact of our explanatory variables on the cumulative mortality of the virus. shows a choropleth map of Spain, colored according to each Autonomous Community’s cumulative weekly deaths per 100,000. Madrid, with relatively low RPR (0.97) and RPE scores (0.92), ranked 12th in RPR and 13th in RPE out of 17 Autonomous Communities, had the second highest cumulative mortality per 100,000 individuals as of August 31st, 2020. In spite of being the fifth youngest Autonomous Community, Madrid is one of the most populous and touristic regions in Spain, making it even more susceptible to infections. Madrid has also been a major source of opposition against the central government coalition. A similar case in point is Castilla La Mancha, who are not politically aligned with the government coalition. The region also has low scores of RPE (0.91, ranked 12th) relative to other communities, as well as a large elderly population (7% older than 80), making it the Autonomous Community with the worst mortality per 100,000 individuals. On the other hand, Andalucía, with a percentage of leftist deputies in Congress higher than the national median, and the (fourth youngest population, has managed to contain weekly mortality levels at 18 deaths per 100,000 individuals. Andalucía’s residents also have been among the most compliant with stay-at-home orders. During the period of analysis, mobility percentage changes remained negative, except in the first week of August with a 0.9% increase from baseline levels. Lastly, Asturias contained its mortality at 33.5 deaths per 100,000, being politically aligned with the central government and having the 4th highest RPE score (1.16). However, it has one of the lowest RPR scores in Spain (0.94), which is an example of the conditional effect of RPR and political capacity: both are needed to minimize mortality.
Figure 8. Marginal effects of Left-leaning Deputies Above Median on Total Deaths (per 100k)
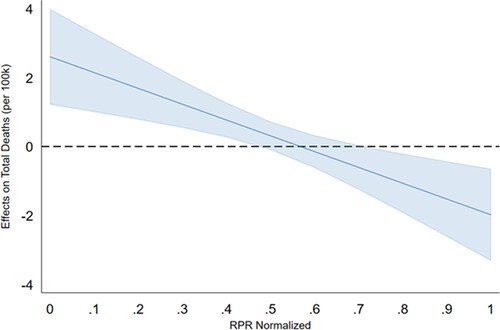
Figure 9. Spanish Autonomous Communities by Cumulative Weekly Deaths per 100,000
Conclusions and future research
Our findings suggest that the relative political capacity of Autonomous Communities and their level of cooperation and alignment with the central government coalition mitigate the mortality levels caused by COVID-19, after controlling for an aging population. The conditional effect of politics and capacity on the severity of the pandemic emphasizes the need to incorporate structural variables into evaluations of policy effectiveness. The mobilization of the population is facilitated by political alignment between the central government and subnational units. This is not surprising since political alignment embodies trust.
The severity of the effects of a pandemic is generally explained by epidemiologists and demographers without the inclusion of politics and structural variables, which inhibits the understanding of the probability of success at the implementation phase of healthcare policies.
The addition of these variables significantly increased the explanatory power of our model (22% increase in between variation). Furthermore, although economic development is considered an important factor with regard to the spread of the virus, empirically it becomes unimportant when controlling for politics.
The response to COVID-19 has highlighted the harmful effects of a lack of cooperation between central and subnational governments and states or provinces. This research needs to be replicated for other countries, incorporating politics at the subnational level as an important determinant in policy implementation. Finally, understanding the responses of the different Autonomous Communities, as well as their successes and failures, will offer useful information to mitigate future waves of the virus.
Acknowledgements
We thank Nicholas Stowell from Claremont Graduate University for providing the RPE subnational data and Subnational level COVID-19 deaths, and Dr. Jacek Kugler for his guidance and feedback.
Disclosure statement
No potential conflict of interest was reported by the author(s).
Additional information
Notes on contributors
Yuzhu Zeng
Yuzhu Zeng is a PhD Candidate in Political Science at Claremont Graduate University and TRC research fellow, focusing on International Relations and Comparative Politics. Her research interests include governments' political capacity, relations between the US and China, the impact of inequality in the developing world, and demographics changes within a subnational framework.
Marina Arbetman-Rabinowitz
Marina Arbetman-Rabinowitz PhD is a Research Associate at the Maldonado Institute at Claremont Graduate University and at La Sierra University. As a consultant, she worked for the US Government, World Bank, private banks, and financial institutions worldwide. Her research focus is on political and economic development, natural disasters, and conflict. Her expertise is in empirical modelling, data analysis, and measurement. She has done research on political capacity computation and evaluation at the international and subnational level for the last 35 years.
Notes
1 Data from Our World in Data. (Roser et al., Citation2020)
2 Data from Spain’s Ministry of Health (Centro de Coordinacion y Alertas de Emergencia Sanitaria, Citation2020a).
3 Mobility trends are compared to “the median value, for the corresponding day of the week, during the 5-week period Jan 3–Feb 6, 2020” as a baseline (Google LLC, Citation2020). Baseline days represent a normal value for that day of the week. As such, daily percentage changes from the corresponding day of the week baseline are provided.
4 The protected population equivalent is calculated by weighing the population covered by the National Health System by the relative per capita health expenditure for seven age brackets. See Grupo de Trabajo Sobre Gasto Sanitario (Citation2007) for a detailed explanation.
5 Data from Spain’s Ministry of Health (Centro de Coordinacion y Alertas de Emergencia Sanitaria, Citation2020a).
6 The Spanish Congress is the most powerful of the chambers since, unlike the Senate, it can propose new laws, write, and debate legislature. Furthermore, in the most recent election PSOE’s majority in the Senate is clear—it holds 45% of the Senate’s seats.
7 We run random-effects linear models with first-order serial correlation (using the command XTREGAR in Stata) which transforms the data to remove the AR(1) component (see Stata manual for more information).
8 The GAM specification includes fixed effects controls for Autonomous Community.
9 Population density was not included given collinearity with GDP pc. When GDP pc is replaced with population density in the regression, its coefficient is insignificant. Results with population density are included in Table B in the Appendix.
10 The normalized mobility coefficients with lags 3, 4, and 5 are -1.03, -0.64, and -0.40 respectively (all statistically significant).
References
- Arbetman-Rabinowitz, M., & Kugler, J. (1997). Political capacity and economic behavior. Boulder, CO: Routledge.
- Arbetman-Rabinowitz, M., Kugler, J., Abdollahian, M., Kang, K., Nelson, H. T., & Tammen, R. L. (2012). Political performance. In J. Kugler, & R. J. Tammen (Eds.), The performance of nations (pp. 7–45). Maryland: Rowan and Littlefield Publishers, Inc.
- Bell, B. P., Damon, I. K., Jernigan, D. B., Kenyon, T. A., Nichol, S. T., O’Connor, J. P., & Tappero, J. W. (2016). Overview, Control Strategies, and Lessons Learned in the CDC Response to the 2014–2016 Ebola Epidemic. MMWR Supplements, 65(Suppl-3), 4–11. doi:10.15585/mmwr.su6503a2
- Brambor, T., Clark, W., & Golder, M. (2006). Understanding interaction models: Improving empirical analyses. Political Analysis, 14(1), 63–82. http://www.jstor.org/stable/25791835. doi:10.1093/pan/mpi014
- Centro de Coordinación de Alertas y Emergencias Sanitarias. (2020). Enfermedad por el coronavirus (COVID-19). [Data set]. https://www.mscbs.gob.es/profesionales/saludPublica/ccayes/alertasActual/nCov/documentos/Actualizacion_241_COVID-19.pdf.
- Centro de Investigaciones Sociológicas. (2020). Barometro de julio 2019. (Report No. Estudio 3257). http://www.cis.es/cis/export/sites/default/-Archivos/Marginales/3240_3259/3257/es3257mar.pdf.
- Condes, E., Arribas, J. R., & COVID19 MADRID-S.P.P.M. group. (2021). Impact of COVID-19 on Madrid hospital system. Enfermedades infecciosas y microbiologia clinica. 39(5), 256-257. Advanced online publication. https://doi.org/10.1016/j.eimc.2020.06.005
- Cruz, M. (2020). 57% of Spaniards do not trust the Government's management to fight the Covid-19 pandemic. Elomundo. https://www.elmundo.es/espana/2020/09/17/5f633c7421efa0816b8b458d.html.
- Ewing, T. E. (2021). Public health responses to pandemics in 1918 and 2020. American Journal of Public Health, 111, 1715–1717. https://doi.org/10.2105/AJPH.2021.306453
- Google LLC. (2020). Google COVID-19 Community Mobility Reports. [Data set]. Google. https://www.google.com/covid19/mobility/.
- Griffin, S. (2020). COVID-19: Second wave death rate is doubling fortnightly but is lower and slower than in march. BMJ, 371, m4092. doi:10.1136/bmj.m4092
- Grupo de Trabajo Sobre Gasto Sanitario. (2007). Informe Del Grupo De Trabajo De Analisis Del Gasto Sanitario. https://www.hacienda.gob.es/Documentacion/Publico/PortalVarios/Grupo%20de%20Trabajo%20Gasto%20Sanitario.pdf.
- Hale, T., Angrist, N., Cameron-Blake, E., Hallas, L., Kira, B., Majumdar, S., … Webster, B. (2020a). Oxford COVID-19 Government Response Tracker. [Data set]. Blavatnik School of Government. https://www.bsg.ox.ac.uk/research/research-projects/covid-19-government-response-tracker.
- Hale, T., Angrist, N., Cameron-Blake, E., Hallas, L., Kira, B., Majumdar, S., … Webster, B. (2020b). Variation in Government Responses to COVID-19. Version 7.0. Blavatnik School of Government Working Paper. https://www.bsg.ox.ac.uk/research/publications/variation-government-responses-covid-19.
- Hale, T., Hale, A., Kira, B., Petherick, A., Phillips, T., Sridhar, D., … Angrist, N. (2020). Global assessment of the relationship between government response measures and COVID-19 deaths. Preprint at medRxiv. https://doi.org/10.1101/2020.07.04.20145334
- Hastie, T., & Tibshirani, T. (1986). Generalized Additive Models, 1986), Statistical Science. Statist. Sci, 1(3), 297–310. DOI: 10.1214/ss/1177013604
- IHME. (2020). Covid Projections. [Data set]. https://covid19.healthdata.org/spain?view=daily-deaths&tab=trend.
- Im, K. S., Pesaran, M. H., & Shin, Y. (2003). Testing for unit roots in heterogeneous panels. Journal of Econometrics, 115(1), 53–74. doi:10.1016/S0304-4076(03)00092-7
- Kang, S. J., & Jung, S. I. (2020). Age-Related morbidity and mortality among patients with COVID-19. Infection & Chemotherapy, 52(2), 154–164. doi:10.3947/ic.2020.52.2.154
- Kugler, J., Organski, A. F. K., Johnson, J. T., & Cohen, Y. (1983). Political determinants of population dynamics. Comparative Political Studies, 16(1), 3–36. doi:10.1177/0010414083016001001
- Kugler, J., & Tammen, R. L. (2012). The performance of nations. Plymouth, UK: Rowman & Littlefield.
- Kugler, T., Kang, K., Rabinowitz, M., & Kugler, J. (2015). Relative Political capacity dataset documentation. [Data set]. https://dataverse.harvard.edu/dataset.xhtml?persistentId=doi:10.7910/DVN/NRR7MB.
- La Moncloa. (2020, June). The Government approves the COVID-19 Fund of 16,000 million euros for the autonomous communities. Spain Minister Council. https://www.lamoncloa.gob.es/consejodeministros/resumenes/Paginas/2020/160620-cministros.aspx.
- Lauer, S. A., Grantz, K. H., Bi, Q., Jones, F. K., Zheng, Q., Meredith, H. R., Azman, A. S., Reich, N. G., & Lessler, J. (2020). The incubation period of Coronavirus Disease 2019 (COVID-19) from publicly reported confirmed cases: Estimation and application. Annals of Internal Medicin, 172(9), 577–582. doi:10.7326/M20-0504
- Linde, P. (2020). The new Health indicators place five communities at ‘extreme’ risk from the coronavirus. EIPAIS. https://elpais.com/sociedad/2020-10-15/los-nuevos-indicadores-de-sanidad-situan-a-cuatro-comunidades-en-riesgo-extremo-por-el-coronavirus.html.
- Martini, M., Gazzaniga, V., Bragazzi, N. L., & Barberis, I. (2019). The Spanish influenza pandemic: A lesson from history 100 years after 1918. Journal of Preventive Medicine and Hygiene, 60(1), E64–E67.
- Organski, A. F. K., & Kugler, J. (1980). The war ledger. Chicago: University of Chicago Press.
- Pérez Díaz, J., Abellán García, A., Aceituno Nieto, P., & Ramiro Fariñas, D. (2020). Un perfil de las personas mayores en España (2020). Basic statistical indicators. (Report No. Madrid, Informes Envejecimiento en red n° 25, 39p.) http://envejecimiento.csic.es/documentos/documentos/enred-indicadoresbasicos2020.pdf.
- Pichel, J. (2020, August). The paradox of masks: Spain leads its use and regrowth. What has gone wrong? El Confidential. https://www.elconfidencial.com/tecnologia/2020-08-29/mascarillas-covid19-coronavirus-kn95-fpp2_2727015.
- Roser, M., Ritchie, H., Ortiz-Ospina, E., & Hasell, J. (2020). Coronavirus Pandemic (COVID-19). OurWorldInData. https://ourworldindata.org/coronavirus.
- Spain National Statistics Institute. (2020). Cuenta satélite del turismo de España. Año 2019. https://www.ine.es/dyngs/INEbase/es/operacion.htm?c=estadistica_C&cid=1254736169169&menu=ultiDatos&idp=1254735576863.
- Swaminathan S., & Thomas J. (2007). Saving the next generation: Political capacity and infant mortality decline in India's states. International Interactions, 33(3), 217–242. doi:10.1080/03050620701449017
- Tyora, S. M. (2019). More than 850,000 people over 80 years old live alone in Spain. ElPAIS. https://elpais.com/sociedad/2019/04/02/actualidad/1554207493_844264.html.
- Viñas, M. (2020). The Map of Use of Mask in Spain. La Voz de Galicia. https://www.lavozdegalicia.es/noticia/sociedad/2020/07/08/mapa-uso-mascarilla-espana/00031594220007835163381.htm.
- Wooldridge, J. M. (2012). Introductory Econometrics: A Modern Approach. 5th edition. Mason, OH: Cengage Learning.
- World Health Organization. (2020). Coronavirus disease (COVID-19). (Report No. Situation Report – 198). https://www.who.int/docs/default-source/coronaviruse/situation-reports/20200805-covid-19-sitrep-198.pdf?sfvrsn=f99d1754_2.
- Worldometer. (2020). COVID-19 Coronavirus Pandemic. [Data set] https://www.worldometers.info/coronavirus/.
- Wu, Y., Jing, W., Liu, J., Ma, Q., Yuan, J., Wang, Y., … Liu, M. (2020). Effects of temperature and humidity on the daily new cases and new deaths of COVID-19 in 166 countries. Science of The Total Environment, 729, 139051. doi:10.1016/j.scitotenv.2020.139051
- Wu, Z., & McGoogan, J. M. (2020). Characteristics of and important lessons from the coronavirus disease 2019 (COVID-19) outbreak in china. Jama, 323(13), 1239–1242. doi:10.1001/jama.2020.2648
- Yu, X., Duan, J., Jiang, Y., & Zhang, H. (2020). Distinctive trajectories of the COVID-19 epidemic by age and gender: A retrospective modeling of the epidemic in South Korea. International Journal of Infectious Diseases, 98, 200–205. doi:10.1016/j.ijid.2020.06.101