
 ?Mathematical formulae have been encoded as MathML and are displayed in this HTML version using MathJax in order to improve their display. Uncheck the box to turn MathJax off. This feature requires Javascript. Click on a formula to zoom.
ABSTRACT
The startling warming of the Arctic is driving important environmental changes, but vegetation responses have been spatially heterogeneous and difficult to predict. In this context, establishing new ecological baselines and initiating monitoring schemes are essential. We conducted systematic plot-based surveys in the polar desert surrounding Alert (Nunavut, Canada). We aimed at (1) identifying distinct plant communities, (2) characterizing community attributes, including diversity and abundance, as well as environmental variables associated with each community, and (3) establishing a georeferenced baseline with permanent field markers allowing robust re-surveying. We used hierarchical clustering to categorize cover values of vascular plant species, cryptogams, and ground substrates from 1,320 quadrats (1 m2 each) surveyed in 264 vegetation plots. Five plant communities were identified, with one community associated with each of the barren and mesic habitats, and three communities associated with wetlands. The mean biotic covers were generally higher at Alert (13–98%) compared to other polar deserts in the Canadian Arctic Archipelago. A total of 250 quadrats from 50 vegetation plots were permanently marked, and a database describing all plots is available online. This study improves our understanding of High-Arctic plant communities and establishes an important vegetation monitoring reference at the northernmost permanently inhabited settlement on Earth.
Résumé
Le réchauffement sans précédent de l’Arctique entraîne des changements environnementaux importants, mais les réponses de la végétation sont spatialement hétérogènes et difficiles à prédire. Dans ce contexte, l’établissement de nouvelles bases de référence écologiques et la mise en place de programmes de suivi sont essentiels. Nous avons effectué des relevés systématiques par quadrats dans le désert polaire entourant Alert (Nunavut, Canada). Nous avions pour objectifs (1) d’identifier les communautés végétales distinctes, (2) de caractériser les attributs de chaque communauté, y compris la diversité et l’abondance, ainsi que les variables environnementales associées à chacune et (3) d’établir une base de données géoréférencée avec des quadrats marqués de façon permanente permettant un rééchantillonnage rigoureux. Nous avons utilisé une analyse de groupement hiérarchique pour catégoriser les valeurs de recouvrement des espèces végétales vasculaires, des cryptogames et des types de substrats de 1320 quadrats (1 m2 chacun) étudiés dans 264 parcelles de végétation. Cinq communautés végétales ont été identifiées, une associée aux habitats arides, une associée aux habitats mésiques, et trois associées aux habitats humides. Les recouvrements biotiques moyens étaient généralement plus élevés dans les communautés à Alert (13 à 98%) que dans celles d’autres déserts polaires de l’archipel Arctique canadien. Au total, 250 quadrats répartis dans 50 parcelles de végétation ont été marqués avec des clous, et une base de données détaillée décrivant toutes les parcelles est disponible en ligne. Cette étude contribue à une meilleure compréhension des communautés végétales du Haut-Arctique et établit une référence importante en matière de surveillance de la végétation à l’endroit habité en permanence le plus nordique de la planète.
Introduction
Vegetation is essential to the functioning of Arctic terrestrial ecosystems and, through complex feedbacks and cascades, changes in plant communities greatly affect animal consumers and ecological processes such as water exchange, litter decomposition, nutrient cycling and soil fertility (Wookey et al. Citation2009; Callaghan et al. Citation2011; Bjorkman et al. Citation2020). Over the past two decades, average Arctic air surface temperatures have increased by more than twice the global average (IPCC Citation2019), with already clear responses from Arctic plant communities. Climate-induced shifts in vegetation diversity, biomass and abundance have been reported (Elmendorf et al. Citation2012; Epstein et al. Citation2012; Bjorkman et al. Citation2020), but are not universal across the Arctic (Tape et al. Citation2012; Pattison et al. Citation2015). Spatial heterogeneity likely stems from the diversity of drivers determining plant community composition, including macroclimate, topography, soil conditions, and biotic interactions (Nabe-Nielsen et al. Citation2017; Berner et al. Citation2020; Bjorkman et al. Citation2020), thus making predictions difficult. Efforts to address heterogeneity in tundra responses to warming have been hindered by lack of data. In addition, experiments were short term and conducted at few sites (Elmendorf et al. Citation2012). In this context, establishing baselines and implementing monitoring schemes to track the responses of Arctic plant communities to climate change are critical (Mihoub et al. Citation2017; Christensen et al. Citation2020).
A coordination of circumpolar monitoring effort has arisen from the Arctic Council working group Conservation of Arctic Flora and Fauna (CAFF), which established the Circumpolar Biodiversity Monitoring Programme to help implementing adaptive and standardized monitoring of Arctic environments (Petersen et al. Citation2004; CAFF Citation2018). This initiative included a monitoring plan specific to Arctic terrestrial biodiversity (Christensen et al. Citation2013), where vegetation is considered one of four key biotic groups. Within each biotic group, entities designated as Focal Ecosystem Components (FECs) were identified, with their associated core attributes, as targets for monitoring. Vascular and non-vascular plants (trees, shrubs, forbs, graminoids, mosses, and lichens) were all considered to be FECs (Christensen et al. Citation2013; Appendix A), whereas FEC essential attributes for vegetation included diversity, abundance, composition, phenology, temporal cycles, and ecosystem functions and processes. These attributes were chosen based on ecological significance, relevance to ecosystem services, value to local people, and importance for management and legislation needs (Christensen et al. Citation2013). The most recent report on status and trends of Arctic terrestrial biodiversity confirmed the validity of the above vegetation FECs and attributes (Aronsson et al. Citation2021).
More long-term monitoring programs have been implemented in the Low Arctic than in the High Arctic (Bjorkman et al. Citation2020), and additional vegetation monitoring in the High Arctic is thus greatly promoted (Christensen et al. Citation2020; Ravolainen et al. Citation2020). The High Arctic tundra biome corresponds to subzones A, B, and C of the Circumpolar Arctic Vegetation Map (CAVM Team Citation2003) and includes the Canadian Arctic Archipelago, the northern margins of Russia, the northern half of coastal Greenland, and Svalbard (Halliday Citation2002). The High Arctic tundra covers a variety of landforms and soil deposits, and is exposed to a range of climatic conditions promoting the development of three broad vegetation types: polar oases (relatively high plant biomass and density; Yurtsev Citation1994), polar semi-deserts (5–20% vascular plant cover; Bliss et al. Citation1973; Bliss and Svoboda Citation1984) and polar deserts (<5% vascular plant cover; Bliss et al. Citation1973; Bliss and Svoboda Citation1984). Polar deserts encompass 850,000 km2 worldwide and 75% of them are found in the Canadian High Arctic (Bliss and Matveyeva Citation1992). Despite a relatively sparse vegetation cover, a low species diversity and the ubiquitous distribution of some species, polar deserts support various plant assemblages (Bay Citation1997; Lévesque Citation1997). They, however, remain less studied than polar oases and semi-deserts (Bliss and Svoboda Citation1984; Muc et al. Citation1989).
The vegetation of polar deserts is constrained by continuous permafrost, a short-growing season, low annual and summer mean temperatures, strong winds, low precipitations, and severe nutrient limitations (Billings Citation1987; Peterson Citation2014). Arctic tundra ecosystems are also characterized by a large variety of natural disturbances, either directly or indirectly climatically driven, that occur over a large range of spatio-temporal scales (Walker and Walker Citation1991). At a local scale, natural disturbance regimes include annual and daily freeze-thaw cycles, growth and erosion of ice-wedges, annual snow and associated water run-off, and snowbank formation and melting (Walker and Walker Citation1991). Intense frost action processes (congeliturbation) create patterned ground and landforms typical of Arctic environments and heavily influence the soil and vegetation of Arctic regions (Bliss Citation1962; Anderson and Bliss Citation1998). In such extreme environments, only a few species of vascular plants, bryophytes and lichens can establish (Bliss Citation1962; Billings Citation1987). Biological soil crusts consisting of soil surface and subsurface associations of cyanobacteria, algae, lichen, bryophyte, microfungus, and bacteria are often the first organisms to colonize bare soil, thereby facilitating the growth of vascular plants by promoting high moisture and nutrient levels (Belnap and Lange Citation2003; Breen and Lévesque Citation2006). Early vascular colonizers are often herbaceous plants such as graminoids and forbs that are very tolerant to adverse conditions and can produce a relatively large number of seeds (Lévesque Citation1997; Jones and Henry Citation2003; Breen and Lévesque Citation2006; O’Kane Citation2018). Long-lived, slow-growing woody species, such as Salix arctica, Dryas integrifolia, and especially Cassiope tetragona, often arrive in later successional stages (Lévesque Citation1997; Jones and Henry Citation2003; Breen and Lévesque Citation2006; O’Kane Citation2018). Plant succession in the High Arctic can occur over hundreds or even thousands of years (Billings and Peterson Citation1980; Svoboda and Henry Citation1987) and can be of different types. Along glacier forelands near polar oases, directional succession with species replacement generally occurs through recognizable stages. In more extreme polar desert environments, directional succession without species replacement arises when invading species become established and slowly expand over time (but without changes in community composition), whereas non-directional succession without species replacement occurs when few species succeed at establishing during favorable periods, although their populations are reduced or eradicated when conditions deteriorate (Svoboda and Henry Citation1987; Jones and Henry Citation2003). However, plant succession in the High Arctic is highly variable in space and time, and may take several trajectories depending on individual species traits and site-specific environmental conditions, such as temperature, moisture, micro-topography and substrate, leading to the emergence of different plant communities (Jones and Henry Citation2003; O’Kane Citation2018).
In order to fill geographic gaps in data coverage in Canada (Bjorkman et al. Citation2020) while improving harmonization of data collection and monitoring (Christensen et al. Citation2020), a systematic, plot-based survey of vascular plants was conducted at Alert (Ellesmere Island, Nunavut, Canada) in 2018–2019 by Desjardins et al. (Citation2021a). This survey estimated the total number of vascular species at 77 in the Alert region and recorded no introduced species. Following the detailed inventory of vascular plants at Alert, the objectives of the present study were to (1) classify vegetation into distinct plant communities, (2) characterize plant community attributes, including diversity (alpha diversity, rare species, community composition) and abundance (percent cover), as well as environmental variables associated with each community, and (3) establish a georeferenced baseline with permanent field markers allowing future replication of our work.
Material and methods
Study area
The 170-km2 study area surrounds the Canadian Forces Station (CFS) Alert (82°30ʹN, 62°20ʹW), the northernmost permanently inhabited settlement on Earth, which is located on the north-eastern tip of Ellesmere Island, Nunavut, Canada. It is roughly delimited by the Lincoln Sea to the North and the boundaries of CFS Alert property in other directions. The local topography consists of rugged and undulating terrain with mountains (maximum of 525 m a.s.l.), hills, valleys and creeks. The overburden, ranging from 2.4 to 4 m thick, is composed of till and shattered rock filled with ice (Taylor et al. Citation1982), while the underlying bedrock is highly calcareous, composed of argillite with greywacke in some places (Smith et al. Citation2012). The area is also characterized by a thick (>600 m) layer of permafrost (Smith et al. Citation2012). Isostatic rebound following deglaciation raised the marine limit to 135 m above sea level (England Citation1976) and uncovered many beds of marine silts and clays mixed with masses of recent marine shells (Bruggemann and Calder Citation1953). A more detailed description of the study area can be found in Desjardins et al. (Citation2021a).
The sun remains under the horizon from mid-October to late February and a 24-h sunlight period occurs from early April to early September. Summer mean air temperature average 3.4°C in July while annual precipitations average 158 mm (Government of Canada Citation2010). The growing season for plants is short (2.5 months), with a snow-free season limited to mid-June to early September.
The study area is part of subzone A, which is the coldest bioclimate subzone in the Canadian Arctic, with an average July temperature of 3°C (Christensen et al. Citation2013). This subzone is generally characterized by a polar desert landscape that is mostly barren with some lichen and moss cover, and a vascular plant cover <5% (Christensen et al. Citation2013). Alert, nevertheless, supports several herbivore populations, including the collared lemming (Dicrostonyx groenlandicus), Arctic hare (Lepus arcticus), muskox (Ovibos moschatus), peary caribou (Rangifer tarandus pearyi), and rock ptarmigan (Lagopus muta), as well as their associated predators such as the Arctic wolf (Canis lupus arctos), Arctic fox (Vulpes lagopus), ermine (Mustela erminea), snowy owl (Bubo scandiacus), and long-tailed jaeger (Stercorarius longicaudus).
Data collection
The systematic vegetation survey was carried out from 28 July to 24 August 2018, and from 3 July to 2 September 2019. A random stratified design was used, based on a habitat map described in Desjardins et al. (Citation2021a). The habitat map was constructed from a multispectral satellite picture of the study area (40-cm resolution pan-sharpened multispectral picture from WorldView-2/3; taken on 2 and 13 August 2015) and consisted of six classes, including snow/water and five broad vegetation gradients classified into habitat types: barren ground, xeric, xeric-mesic, mesic, and wetland. A 2 × 2 km grid was overlaid on the study area and, for each grid cell, vegetation surveys were performed at ≥1 random location for each of the five habitat types present in the grid ()). ArcGIS 10.6.1 (ESRI Citation2018) was used to complete these steps.
Figure 1. a. Location of 264 vegetation plots (squares) randomly distributed in five habitat types in the study area: barren ground, xeric habitat, xeric-mesic habitat, mesic habitat and wetland. Closed squares indicate locations of permanently marked plots. b. Set up of the vegetation plot with the five 1 × 1 m quadrats. c. Top view of a quadrat. d. Vegetation sampling by a scribe (left), and an observer (right). Barren ground, xeric habitat, xeric-mesic habitat, mesic habitat, and wetland correspond, respectively, to 12%, 33%, 32%, 15%, and 7% of the total land cover
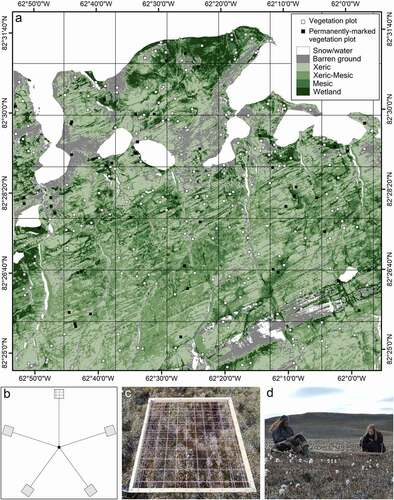
Each vegetation survey corresponded to a vegetation plot consisting of five 1 m × 1 m quadrats, each located 5 m from a central point and at equal distance from one another (Bay Citation1998; )). GPS coordinates were recorded over each quadrat. A quadrat consisted of a frame with a distended rope grid in two layers, forming 100 intersections per layer ()). This followed the intersection quadrat protocol of the International Tundra Experiment (Walker Citation1996). Following a point-intercept method, the frame was placed horizontally above the vegetation using metal poles at each corner. At each rope intersection, a metal pin was lowered along the two rope layers and the first plant encountered was recorded. Vascular plants (live or dead) were identified to the species, whereas cryptogams (i.e., spore-bearing organisms also known as non-vascular plants; Belnap et Lange Citation2003) were identified as biological soil crust (black or white), blue-green algae (macroscopic sheet colonies dominated by Nostoc sp.), lichen, macrofungus (defined as fungus with visible sporocarp; Dahlberg and Bültmann Citation2013), or moss. Vascular plants that could not be identified in the field were sampled just outside the quadrat for further identification using a microscope, identification guides, and expert opinion. Species names are based on VASCAN (Brouillet et al. Citation2010; Desmet and Brouillet Citation2013). For vascular species and cryptogams, we also recorded if touched plants were alive or dead (Desjardins et al. Citation2021b). If no plant was touched by the lowered pin, the ground substrate was noted (bare soil or rock). Following Walker (Citation1996), an index of absolute cover for each vascular species, cryptogam, and ground substrate was then calculated for each quadrat as the total number of times the category was touched by the pin at a rope intersection, divided by 100. All vascular species and cryptogams found inside the quadrats but not touched by the pin were identified and assigned a cover value of 0.5%. The measure of percent cover (absolute abundance) obtained using the ITEX point-intercept method is highly correlated with the relative above-ground biomass obtained by harvest methods (Jonasson Citation1988; Shaver et al. Citation2001; Mamet et al. Citation2016). Using a Panasonic FZ70 (resolution: 180 dots per inch), Samsung ST150F (resolution: 72 dots per inch), or an iPhone SE (resolution: 72 dots per inch), oblique color photographs of quadrat were taken from hand and archived as Joint Photographic Experts Group (JPEG)-file. For 250 quadrats from 50 vegetation plots, holes left in the ground after removing the metal poles from the quadrat corners were permanently marked using two 20-cm metal nails hammered into the ground at opposite corners of the quadrats. One nail was tagged using a small numbered metal plate. The 50 marked vegetation plots were spread across the five habitat types (5 marked plots in barren ground, 17 marked plots in xeric habitat, 8 marked plots in mesic habitats and 20 marked plots in wetlands). This permanent marking and the associated georeferenced archive Nordicana D (Desjardins et al. Citation2021b) allow finding of plots with a metal detector and replication of our quantitative vegetation survey with the intersection quadrat protocol.
Data analysis
Plant community classification was performed through hierarchical cluster analysis using the complete linkage method and Bray–Curtis dissimilarity. The Bray–Curtis dissimilarity (Motyka et al. Citation1950) was chosen over other dissimilarity indices because it is not biased by species richness and yields index values that are higher among sites without species in common (Legendre et al. Citation2013). The index is sensitive to differences in abundance between species, and abundant species weight more than rare species (Chao et al. Citation2006; Ricotta and Podani Citation2017). Vegetation plots were the sampling unit for the plant community classification; thus, the input data for the analysis was the absolute cover of vascular plant species and cryptogams (dead and live plants combined), and one combined ground category (rock and soil) averaged over the five quadrats in each vegetation plot and transformed with Hellinger. For cryptogams, black biological crust, often embedded in moss, was merged with the moss category, while white biological crust, known to be composed of lichen (Belnap et al. Citation2001), was merged with the lichen category. Therefore, cryptogams were grouped into four categories instead of six: blue-green algae, lichen (including white biological crust), macrofungus, and moss (including black biological crust). In the Hellinger transformation recommended for clustering or ordination of species abundance data (Rao Citation1995; Legendre et al. Citation2001), the relative abundance values are square-rooted, which reduces the differences between the highest and lowest abundance values (Borcard et al. Citation2018).
We used the indicator value index (IndVal) to determine the appropriate number of groups in the cluster analysis (Dufrêne and Legendre Citation1997). IndVal assesses the strength of the association between a single species and several groups of sites, each group representing here a plant community. It is based on two components, specificity and fidelity, where specificity is the mean abundance of the species in the target site group divided by the sum of the mean abundance values over all groups, and fidelity is the relative frequency of occurrence of the species inside the target site group (Dufrêne and Legendre Citation1997; De Cáceres and Legendre Citation2009). Specificity is highest when the species is only present in the group and fidelity is highest when the species is present in all sites of the group (Dufrêne and Legendre Citation1997). The untransformed absolute cover values (with uncombined cryptogams) were used to estimate IndVal and significance was determined using Monte Carlo tests with 999 permutations. The highest number of groups with at least one vascular species or cryptogam with a significant IndVal in each group was chosen. The cluster analysis and IndVal calculations were performed with R Software (R Core Team Citation2020) using the vegan and indicspecies packages. For each group, we calculated the vascular plant species richness as well as the mean cover percentage of each vascular species, cryptogam, and ground substrate. The frequency of occurrence (number of vegetation plots with occurrence divided by the total number of plots multiplied by 100) of each vascular species, cryptogam, and ground substrate was also calculated.
Canonical Correspondence Analysis (CCA) was used to identify primary relationships between cover data and environmental variables (Legendre and Legendre Citation2012). Environmental variables included: (1) Normalized difference vegetation index (NDVI) computed from the pan-sharpened multispectral satellite picture of the study area, (2) elevation from the Canadian Digital Elevation Model (DEM) (Natural Resources Canada Citation2015), (3) slope derived from the DEM using ArcGIS, (4) distance to the nearest perennial snowbank derived from the habitat map (Desjardins et al. Citation2021a), (5) location with respect to a perennial snowbank (binary state with 1 indicating location below a snowbank and 0 location above or beside a snowbank); this binary variable was added since the distance to the nearest perennial snowbank may not fully capture the effect of snowbanks, considering that sites spatially close to a snowbank but located upslope or besides the snow patch do not actually benefit from melt water that flows downslope, (6) distance to the nearest lake or pond derived from the habitat map and from the Topographic Data of Canada – CanVec Series (Natural Resources Canada Citation2017), (7) distance to the nearest river derived from Topographic Data of Canada – CanVec Series (Natural Resources Canada Citation2017), and (8) distance to the nearest ocean shore derived from Topographic Data of Canada – CanVec Series (Natural Resources Canada Citation2017). These eight environmental variables were not collinear, as shown by the variance inflation factor (VIF; regclass package in R software, R Core Team Citation2020) being <10.
Multivariate analysis of variance based on Welch MANOVA, test (Hamidi et al. Citation2019), with 999 permutations, followed by pairwise comparisons, test (Alekseyenko Citation2016), were performed on species cover data and environmental variables separately to test for differences between communities using R software (R Core Team Citation2020). The multivariate analysis W*d has the advantage, over permutational multivariate analysis of variance (PERMANOVA), of being robust to unbalanced designs and to heteroscedasticity in the data (i.e., differences in multivariate group dispersion; Hamidi et al. Citation2019), which was our case.
For all statistical analyses, we considered the significance level at p < 0.05.
Results
Overview of floristic composition
A total of 264 vegetation plots were sampled. Of the 77 vascular plant species ever recorded in the study area (Desjardins et al. Citation2021a), 58 were found during this study, as well as five cryptogams (biological soil crust, blue-green algae, lichen, macrofungus, and moss). Among the 58 vascular species, 54 were found within the vegetation plots while four rare species were found only through opportunistic sampling (i.e., collected along marked trails and while traveling within the study area, outside of vegetation plots), namely Carex aquatilis Wahlenberg var. minor Boott, Eriophorum scheuchzeri Hoppe subsp. arcticum Novoselova, Puccinellia phryganodes (Trinius) Scribner & Merrill subsp. neoarctica (Á. Löve & D. Löve) Elven, and Saxifraga tricuspidata Rottbøll. Desjardins et al. (Citation2021a) detail the floristic composition of the study area.
The five most commonly found vascular species, each encountered in >70% of the vegetation plots, were Saxifraga oppositifolia Linnaeus subsp. oppositifolia, Draba corymbosa R. Brown ex de Candolle, Stellaria longipes Goldie subsp. longipes, Cerastium arcticum Lange, and Papaver dahlianum Nordhagen (Appendix B). Fourteen species were found in ≤10 vegetation plots, namely Carex fuliginosa Schkuhr, Draba lactea Adams, Draba pauciflora R. Brown, Equisetum arvense Linnaeus, Equisetum variegatum Schleicher ex F. Weber & D. Mohr subsp. variegatum, Festuca baffinensis Polunin, Festuca hyperborea Holmen ex Frederiksen, Festuca viviparoidea Krajina ex Pavlick subsp. viviparoidea, Pleuropogon sabinei R. Brown, Poa arctica R. Brown subsp. arctica, Poa pratensis Linnaeus subsp. colpodea (Th. Fries) Tzvelev, Ranunculus hyperboreus Rottbøll, Ranunculus sabinei R. Brown, and Ranunculus sulphureus Solander (Appendix B). When added to the four species found only through opportunistic sampling, this gives a total of 18 rare vascular plant species found in the study area.
Description of plant communities
Five plant communities () were identified using cluster analysis () and indicator species values (). The multivariate analysis of variance and pairwise comparisons
confirmed a significant difference in the cover data among each of the five communities (
statistic = 99.03; p = 0.001).
Table 1. Dominant vegetation, main habitat class, vascular plant species richness and mean percentage cover of ground, cryptogams, and vascular species groups for the five plant communities identified at Alert (Nunavut, Canada). Habitat classes correspond to the dominant vegetation classes identified by Desjardins et al. Citation2021a. Vascular species groups correspond to the Focal Ecosystem Components identified by Christensen et al. (Citation2013). Community name was based on Bridgland (Citation1986), where biotic cover <40% is associated with barrens, while biotic cover ranging between 40% and 70% is associated to tundras. We arbitrary associated biotic cover ≥70% to wetlands. No distinction was made among the wetland communities on whether the substrate was saturated with standing water during the entire growing season (marsh) or if it was drained and remained moist (meadow)
Table 2. Significant indicator values (IndVal) and their associated specificity (Spec.) and fidelity (Fid.) components, for five plant communities and their indicator species identified at Alert (Nunavut, Canada) using an indicator species analysis. Indicator species (including vascular species and cryptogams) are ordered by decreasing IndVal within each community. * p < 0.05, ** p < 0.01, *** p < 0.001
Figure 2. Five community types (I to V) revealed by a hierarchical cluster analysis of 264 vegetation plots, based on the complete linkage method and Bray–Curtis dissimilarity index with Hellinger transformed-data. Colors under each plot refer to the five vegetation classes described in Desjardins et al. (Citation2021a)
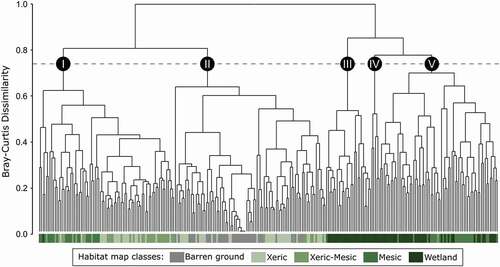
When examining how the five habitat map classes were distributed among the plant communities (), we observed that 100% of barren and 64% of xeric sampled habitats were associated with Community II ()), while 79% of xeric-mesic, 44% of mesic and 36% of xeric sampled habitats were associated to Community I ()). Wetlands were almost exclusively distributed among the three remaining communities, with 35% associated with Community III ()), 7% with Community IV ()) and 56% with Community V ()). Community V also comprised 54% of mesic sampled habitats.
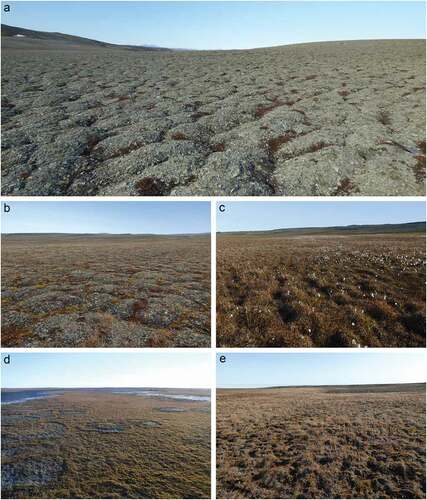
Figure 3. General appearance of five community types identified at Alert (Nunavut, Canada). a. Forb-dominated barren (Community II). b. Forb-dominated tundra (Community I). c. Sedge-dominated wetland (Community III). d. Moss-dominated wetland (Community IV). e. Grass-dominated wetland (Community V)
Community I had the second highest species richness (46) and an average mean biotic cover (44%, with a 34% vascular plant cover) when compared with other communities (; )). Cover was mostly represented by Saxifraga oppositifolia subsp. oppositifolia (11%), moss (9%), Stellaria longipes subsp. longipes (5%), Cerastium arcticum (3%), Puccinellia bruggemannii T.J. Sørensen (2%), Salix arctica Pallas (2%), Draba corymbosa (1%), Papaver dahlianum (1%), Sabulina rubella (Wahlenberg) Dillenberger & Kadereit (1%), Juncus biglumis Linnaeus (1%), black and white soil biological crusts (1% each), lichen (1%), Puccinellia vahliana (Liebmann) Scribner & Merrill (1%), Poa abbreviata R. Brown subsp. abbreviata (1%), and Phippsia algida (Solander) R. Brown (1%; Appendix B). There were six indicator species, but the most significant ones included two chickweeds, Sabulina rubella and Stellaria longipes subsp. longipes, and one saxifrage, Saxifraga oppositifolia subsp. oppositifolia (). These three indicator species had a moderately high IndVal (0.71–0.75), mostly due to a very high fidelity (0.94–0.99; ).
Community II had the second lowest species richness (35) and the lowest mean biotic cover (13%, with a 10% vascular plant cover; ; )). Cover was mostly represented by Saxifraga oppositifolia subsp. oppositifolia (3%), Salix arctica (2%), moss (2%), lichen (1%), Poa abbreviata subsp. abbreviata (1%), and Puccinellia bruggemannii (1%; Appendix B). The only indicator species significantly associated with this community is the crucifer, Braya thorild-wulffii Ostenfeld subsp. thorild-wulffii, which had moderate IndVal (0.42; ). This indicator species had an absolute cover that was relatively low (0.3%), but still higher than in the other four communities (Appendix B).
Community III had an intermediate species richness (40) and the highest mean biotic cover (97%, with a 76% vascular plant cover; ; )). Cover was mostly dominated by Eriophorum triste (Th. Fries) Hadac & Á. Löve (38%), moss (20%), Salix arctica (10%), Arctagrostis latifolia (R. Brown) Grisebach subsp. latifolia (9%), Juncus biglumis (5%), Alopecurus magellanicus Lamarck (5%), Bistorta vivipara (Linnaeus) Delarbre (5%), Saxifraga oppositifolia subsp. oppositifolia (1%), and Equisetum variegatum subsp. variegatum (1%; Appendix B). There were seven indicator species, the most significant ones including one sedge, Eriophorum triste, one grass, Arctagrostis latifolia subsp. latifolia, and a knotweed, Bistorta vivipara (). Eriophorum triste, Arctagrostis latifolia subsp. latifolia, and Bistorta vivipara had high IndVal (0.84–0.99), due to both high specificity (0.86–0.99) and high fidelity (0.81–1.00; ).
Community IV had the lowest species richness (32), but a very high mean biotic cover (98%, with a 40% vascular plant cover; ; )). Cover was mostly represented by moss (53%), Saxifraga cernua Linnaeus (6%), Luzula nivalis (Laestadius) Sprengel (6%), black biological soil crust (4%), Phippsia algida (3%), Juncus biglumis (3%), Papaver dahlianum (3%), Cardamine bellidifolia Linnaeus (2%), Alopecurus magellanicus (2%), Cerastium arcticum (2%), Saxifraga cespitosa Linnaeus (2%), Saxifraga oppositifolia subsp. oppositifolia (2%), Micranthes tenuis (Wahlenberg) Small (2%), Stellaria longipes subsp. longipes (1%), Cerastium regelii (1%), Draba corymbosa (1%), Ranunculus sulphureus (1%), and Poa arctica subsp. arctica (1%; Appendix B). There were 13 indicator species, the most significant ones being the moss, three saxifrages (Saxifraga cernua, Saxifraga cespitosa, and Micranthes tenuis), one crucifer (Cardamine bellidifolia), one grass (Phippsia algida), one poppy (Papaver dahlianum), and one buttercup (Ranunculus sulphureus; ). Two of the saxifrages and the crucifer had the highest IndVal (0.87–0.94), mainly due to a high fidelity and specificity (). Phippsia algida, Saxifraga cespitosa, and Papaver dahlianum had relatively high IndVal (0.73–0.79) due to being specific to this community (specificity = 0.80–1.00; ). The buttercup had an intermediate IndVal (0.62) with a high specificity (0.97; ).
Community V had the highest species richness (50) and a high mean biotic cover (81%, with a 54% vascular plant cover; ; )). Cover was mostly represented by moss (22%), Alopecurus magellanicus (22%), Juncus biglumis (7%), Salix arctica (4%), Saxifraga oppositifolia subsp. oppositifolia (4%), black biological soil crust (3%), Puccinellia vahliana (2%), Stellaria longipes subsp. longipes (2%), Cerastium regelii (1%), Draba corymbosa (1%), Saxifraga cespitosa (1%), Papaver dahlianum (1%), Saxifraga cernua (1%), Cerastium arcticum (1%), ×Pucciphippsia vacillans (T. Fries) Tzvelev (1%), Sabulina rubella (1%), Puccinellia bruggemannii (1%), and blue-green algae (1%; Appendix B). There were five indicator species, the most significant one being one grass, Alopecurus magellanicus, which presented a relatively high IndVal (0.85) and a high specificity (0.96; ).
Several rare species (fidelity <0.25) were highly restricted to one community (III or IV). This included Equisetum variegatum subsp. variegatum (specificity to III = 0.97), Carex fuliginosa (specificity to III = 0.91), Poa arctica subsp. arctica (specificity to IV = 1.00), and Festuca hyperborea (specificity to IV = 0.89; ).
Environmental characteristics of plant communities
Based on the multivariate analysis of variance , there was a significant difference in the measured environmental variables among the five communities (
statistic = 99.03; p = 0.001). The pairwise comparisons
revealed that all communities were different in terms of environmental characteristics, except for communities I and V that were not different from one another (
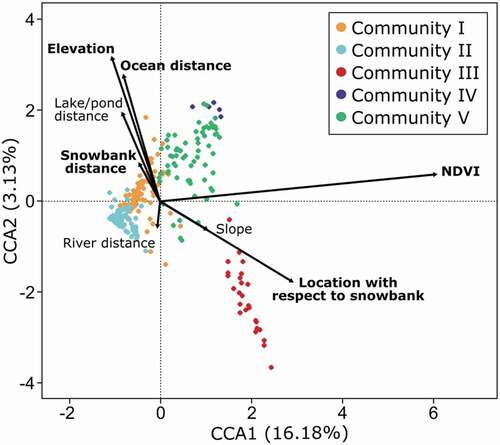
statistic = 1.40; p = 0.19). The overall model including the eight environmental variables was significant (F8,255 = 9.38, p = 0.001). However, only NDVI, elevation, distance to a snowbank, location with respect to a snowbank, and distance to the ocean shore were significantly related to the cover values of vascular species, cryptogams and ground substrates (Appendix D). Permutation tests with 999 runs in the CCA indicated that the first three canonical axes were significant (p = 0.001 for CCA1, CCA2, and CCA3). The eigenvalues for the first and second axes of the species-environment plot were 0.56 and 0.11, respectively, representing 16.18% and 3.13% of the total variation in the dataset. NDVI was most highly correlated with the first axis (0.99), elevation with the second axis (0.79), distance to the ocean shore with the second axis (0.68), and distance to a snowbank as well as location with respect to a snowbank were correlated with the third axis (−0.66 and 0.61, respectively; CCA3 not shown).
The CCA ordination biplot showed that plant communities were rather well separated (). Communities were arranged from highest to lowest NDVI values on the first axis, with III, IV, and V associated with higher NDVI values (right side of the plot) and I and II associated with lower NDVI values (left side of the plot). Sites located at higher elevations were associated with Community IV. Community III sites were the most associated with location with respect to a snowbank, being therefore mainly located downslope of a snowbank. Community III sites were also negatively correlated with elevation, distance to snowbanks, distance to lakes and ponds, and distance to ocean, as corroborated by their low average elevation (55 m), relatively short distance to snowbanks (351 m), relatively short distance to lakes and ponds (855 m), and relatively short distance to ocean shores (1219 m; Appendix C).
Figure 4. Relations between cover of vascular plant species, cryptogams and ground substrates, and eight environmental variables, as revealed by a Canonical correspondence analysis. Dots represent sampling sites, and colors identify the five plant communities revealed by an indicator species analysis. Arrows represent the environmental variables, with bold variables being significant
Marking of vegetation plots
Despite the a posteriori classification of plant communities, the permanent marking of 250 quadrats (50 vegetation plots) spread across five habitats allowed permanent identification of ≥10 quadrats (two plots) in each plant community (). As a result, each plant community is represented in the pool of permanently marked plots by ≥1% of the surveyed plots. Not surprisingly, communities I and II, which appeared the most in surveyed plots, are also the most represented in permanently marked plots. Conversely, Community IV appeared the least in surveyed plots and is also the least represented in permanently marked plots.
Table 3. Number of quadrats (and plots) permanently marked in each of the five plant communities identified at Alert, Nunavut (Canada). The number of quadrats (and plots) surveyed is also indicated for each community, as well as the proportion of marked quadrats with respect to all quadrats surveyed in each community and in the study area
Discussion
Following an important field effort to survey vegetation in five habitats identified from a multispectral satellite picture of the Alert study area, we successfully identified five plant communities and assessed their correlations with eight environmental variables. We first compare the rare and frequent species found at Alert with those found at other sites, we then compare the identified plant communities with each other and in the context of previously published work (mostly in the Canadian Arctic), we discuss their environmental characteristics, and we finally present the benefits of establishing a baseline reference for the evaluation of future changes in High-Arctic vegetation.
Overview of floristic composition
The five most common vascular plant species at Alert (Saxifraga oppositifolia subsp. oppositifolia, Draba corymbosa, Stellaria longipes subsp. longipes, Cerastium arcticum, and Papaver dahlianum) are among the 25 most frequent species at the circumpolar scale within subzone A (Daniëls et al. Citation2016). Cerastium arcticum is also a diagnostic species associated with patterned grounds in subzone A (Walker et al. Citation2011). Except Stellaria longipes subsp. longipes, the remaining common species at Alert were also among the 10 most commonly found by Lévesque (Citation1997) in polar desert sites in central Ellesmere Island. These widespread Arctic species are highly tolerant and effective colonizers of isolated and poor sites, due to their flexible metabolic rate, growth allocation, and type of reproduction (Lévesque Citation1997; Peterson Citation2014).
Among the 18 rare species that we recorded, Poa arctica subsp. arctica, Saxifraga tricuspidata, Draba lactea, Carex fuliginosa (previously called Carex misandra), and Festuca hyperborea were also found by Lévesque (Citation1997) in central Ellesmere Island, but only the three latter species were considered as rare. Two of the rare species, Carex aquatilis var. minor and Eriophorum scheuchzeri, are dominant species in more southern marshes and meadows such as Cape Herschel on Ellesmere Island (Bridgland Citation1986) and Polar Bear Pass on Bathurst Island (Sheard and Geale Citation1983). The two Equisetum Linnaeus species are more abundant in moist to wet, coarse mineral soils at lower latitudes on Ellesmere Island, such as at Lake Hazen and Okse Bay (Hodson et al. Citation2008). In addition, Alert is currently the northernmost reported location on Ellesmere Island for six of the rare species that we found (Festuca baffinensis, Festuca hyperborea, Poa arctica subsp. arctica, Puccinellia phryganodes, Ranunculus sabinei, and Saxifraga tricuspidata), as well as the only reported location on Ellesmere Island of Festuca viviparoidea subsp. vivparoidea (Aiken et al. Citation2007; GBIF Citation2020), a species which is listed as imperiled in Nunavut by NatureServe (Citation2020). Interestingly, we found Puccinellia phryganodes strictly on the ocean shore. Stolons of this salt marsh grass embedded in sea ice have reportedly been recovered and grown, providing a potential mechanism for the distribution of this species across the Arctic (Peterson Citation2014). Rare plants are often ecological specialists that occupy microhabitats where competition with zonal vegetation is absent or limited (Talbot et al. Citation1999).
Plant communities
The five communities showed clear differences with each other in terms of dominant species, biotic cover, species richness, and associated habitats. Despite the relatively sparse vegetation characterizing the Alert region, mosaics of diverse communities within the landscape have also been reported in other polar deserts (Crawford Citation2008; Peterson Citation2014; Daniëls et al. Citation2016; Zwolicki et al. Citation2020).
Barren habitats – Community II, here called forb-dominated barren and dominated by Saxifraga oppositifolia subsp. oppositifolia, Salix arctica, and moss, had the lowest mean biotic cover (13%), but surprisingly not the lowest species richness. The sites associated with Community II were found in five types of barren habitats: small/medium non-sorted polygons made of till with or without frost-shattered rocks on the surface, boulder/rock fields, riverbeds with gravel, saline areas near the ocean shore, and very few desert pavements. The non-sorted polygon landform was the most widespread and vegetation was concentrated in the cracks delimiting the polygons, which allow seedling establishment (Bell and Bliss Citation1980; Sohlberg and Bliss Citation1984; Elberling Citation2000) through protection from desiccation, exposure to wind and soil disturbance (Lévesque Citation2001; Walker et al. Citation2011).
Community II was similar in terms of vascular plant species to the plateau above Truelove lowland on Devon Island (Bliss et al. Citation1994), to the ridge community found in Polar Bear Pass (Sheard and Geale Citation1983), and to the cushion plant community in polar deserts on six islands in the central Canadian Arctic Archipelago (Bliss et al. Citation1984), but their respective biotic cover compared to Alert is either higher (52% in Polar Bear Pass, a polar oasis) or lower (5% on Devon Island plateau, a polar desert, and 7% in polar deserts on six islands). Community II had many species in common with these three communities, such as Saxifraga oppositifolia, Salix arctica, Puccinellia angustata (R. Brown) E.L. Rand & Redfield, Draba corymbosa, Cerastium sp. Linnaeus, Papaver sp. Linnaeus, Sabulina rubella (previously called Minuartia rubella) (Sheard and Geale Citation1983; Bliss et al. Citation1984, Citation1994). Puccinellia angustata was present in Community II, but it was rather Puccinellia bruggemannii, one of its close relatives, that was encountered more often. As for Papaver, the previous studies reported P. radicatum Rottbøll, but this name is strictly associated with European species whereas three Papaver species have been recognized recently on Ellesmere Island, including P. dahlianum (Solstad Citation2008) that we found at Alert. As for Cerastium, we found the arcticum subspecies instead of C. alpinum Linnaeus (a very close relative). C. alpinum and C. arcticum have traditionally been lumped into the alpinum subspecies due to overlapping characters (Hultén Citation1956; Böcher Citation1977; Brysting and Elven Citation2000).
When we subdivided Community II into two sub-communities by selecting a lower threshold in the dendrogram (dissimilarity = 0.55), we observed that the first sub-community (5% biotic cover) was similar to cushion plant barrens found by Bridgland (Citation1986) at Cape Herschel (a polar semi-desert) by having Saxifraga oppositifolia and Poa abbreviata as dominant species, with a high abundance of lichen. The second sub-community (20% biotic cover) was similar to the dwarf shrub barrens also found at Cape Herschel by having Saxifraga oppositifolia and Salix arctica as dominant species.
Community II had therefore many dominant species in common with the other barren communities of Ellesmere Island, Prince of Wales, Somerset, Devon, Cornwallis, Bathurst, and King Christian islands (Sheard and Geale Citation1983; Bliss et al. Citation1984, Citation1994; Bridgland Citation1986), but the biotic cover was mostly higher at Alert than in other polar deserts. Moreover, a recurring difference between Alert and the other polar desert sites was the higher cover of Phippsia algida and Luzula nivalis in the barren communities, whereas these species were only abundant in a wetland community in Alert.
Mesic habitats – Community I, here called forb-dominated tundra, was mostly found in xeric-mesic and mesic habitats, and had the highest species richness and a moderate biotic cover (44%) and vascular plant cover (34%). As for Community II, Community I was growing mostly on non-sorted patterned grounds made of till, but showed a higher biotic cover spreading from the cracks. Sometimes, vegetation was covering the entire cracks giving a flat appearance to the ground with a bare till circle in the centre (landforms also known as non-sorted circles). Some sites associated with this community also had hummocks as landforms. As a result of an interaction between physical processes and biotic properties of vegetation, patterned-ground changes occur during vegetation primary succession (Shur et al. Citation2008; Walker et al. Citation2011). When vegetation starts colonizing small non-sorted polygon cracks, the soil temperature differential between the centre and margins of the polygons increases the thaw-layer thickness in the centre of the polygons (Shur et al. Citation2008). This increases the subsurface flow and pooling of water and organic matter basins beneath the polygons (Shur et al. Citation2008). Then, small cryptogamic and forb species followed by thicker moss mats and more diverse species start colonizing the polygon margins and spread over the active centres. At this point, the non-sorted polygons become non-sorted circles. As the vegetation and soil organic matter build in the centres of the non-sorted circles, the active layer is reduced in thickness, and aggradational ice (new ice added to the top of the permafrost table) develops beneath the polygons. This causes the centres of the circles to become permanently elevated relative to the cracks, forming the earth mounds, called hummocks (Walker et al. Citation2011). Community I may therefore represent a more advanced succession stage than Community II, with well-drained soils. Indeed, Community I presented the same ubiquitous species as Community II, namely Saxifraga oppositifolia subsp. oppositifolia, Stellaria longipes subsp. longipes, Cerastium arcticum, Puccinellia bruggemannii, Salix arctica, Draba corymbosa, Papaver dahlianum, and Sabulina rubella, although with a higher cover. In addition, three other dominant species mostly associated with moister soils were also present in the Community I: Juncus biglumis, Phippsia algida, and Puccinellia vahliana (Aiken et al. Citation2007).
In terms of species, very few communities similar to Community I have been documented in the High Arctic. The most similar ones are a hummock community reported in Polar Bear Pass (Sheard and Geale Citation1983) and the dwarf shrub tundra in Cape Herschel (Bridgland Citation1986). The hummock community (24% mean vascular plant cover and 72% mean biotic cover) has 10 out of 12 dominant species in common with Community I (Saxifraga oppositifolia, Juncus biglumis, Stellaria longipes, Papaver sp. (previously recorded as P. radicatum), Salix arctica, Puccinellia bruggemannii, Draba corymbosa (previously called Draba bellii Holm), Poa abbreviata, and Cerastium alpinum; Sheard and Geale Citation1983), while the dwarf shrub tundra (63% mean biotic cover) has four dominant species (Salix arctica, Saxifraga oppositifolia, Draba sp. Linnaeus, and Stellaria longipes; Bridgland Citation1986). As observed by Sheard and Geale (Citation1983), this mesic community with hummock landforms had the highest vascular plant cover of the upland area, with the exception of meadows and marshes. The mean biotic cover of Community I was, however, lower compared to the hummock and the dwarf shrub tundra communities found, respectively, in a polar oasis and a polar semi-desert.
Wet habitats – The three remaining communities, mostly wetlands, had very high mean biotic covers (81–98%), and differed among each other in their dominant vegetation. Community III (Sedge-dominated wetland) was mostly dominated by Eriophorum triste (38%), while Community IV (Moss-dominated wetland) was dominated by moss (53%), and Community V (Grass-dominated wetland) by Alopecurus magellanicus (22%). The indicator species in Community III and IV were very specific, which also help to distinguish the three communities in the field. These communities resembled polar oases commonly found in more southern latitudes and dominated by graminoids (Bliss Citation1975, Citation1981). The wetland communities presented here were similar, in terms of dominant species, to the snowflush communities described by Bliss et al. (Citation1984). They discerned different patterns within the snowflush communities, including those dominated by moss, Eriophorum triste, or Alopecurus magellanicus (previously called Alopecurus alpinum Smith), which correspond to the three wetland communities found in this study. Like Bliss et al. (Citation1984), we observed that mosses were abundant but lichens were uncommon, and Salix arctica was present in some sites. The snowflush communities are associated with late-lying snow, while in Alert the wetland communities were associated with perennial snowbanks, ponds, lakes, streams, and probably with underground water. The biotic cover reported by Bliss et al. (Citation1984) was, however, lower (36%), suggesting favourable hydrological regimes at Alert, since water availability is necessary for plant communities to develop relatively extensive and lush vegetation (Muc et al. Citation1989; Le Roux et al. Citation2013; Nabe-Nielsen et al. Citation2017).
Community III is very similar to the cotton grass meadows of Cape Herschel. The mean biotic cover there was very high (79%), reaching 100% at some sites, and the community was dominated by two similar species: Eriophorum triste and Salix arctica (Bridgland Citation1986).
Community IV is similar to two communities: the marsh community found at Cape Herschel (Bridgland Citation1986), and the mossy snowbed in Amdrup Land, a semi-polar desert in Greenland (Bay Citation1997). The vascular plant species richness was lower at Cape Herschel, but 9 out of 15 vascular species present were found in Community IV, including few rare grasses and buttercup: Ranunculus sulphureus, Poa arctica, and Pleuropogon sabinei (Bridgland Citation1986). The biotic cover (93%) and the number of vascular plant species (25 spp.) reported by Bay (Citation1997) was similar to the one reported here (96% and 32 spp.), and we share half of the dominant species found in the mossy snowbed community (7 out of 13 vascular species). This type of community, also known as wet moss tundra, is commonly described in the literature as a peatland dominated by a thick and dense moss layer (Vanderpuye et al. Citation2002). Usually, graminoids and forbs, such as Carex aquatilis var. minor, Pedicularis hirsuta, and Pleuropogon sabinei which are later successional species, are emerging from the moss and their roots are attached directly to the moss layer. Wet moss tundra is usually formed in moist slopes and concave terrains and relies on nutrient inputs from seabird and large herbivore feces (Nakatsubo et al. Citation2015). It can also be restricted to the borders of permanent ponds and streams (Bridgland Citation1986). In the Alert region, the moss-dominated wetland occurred in different areas, including gentle slopes at the foot of a mountain, along a river stream, and on the margins of a pond or a lake. Peary caribou feces were also very frequently observed in this community (Desjardins E., unpublished data).
Community V is similar to the moss graminoid meadows, dominated by Alopecurus magellanicus (previously called Alopecurus alpinus) found in valleys on King Christian Island (Bliss and Svoboda Citation1984). At Alert, 18 sites associated with this community had a lower cover (mean biotic cover 47–70%) with drier soils and some seemed to be in transition toward luxuriant vegetation or others in a retrogression toward the Community I (due to high number of dead stems from previous years).
We report higher biotic cover in the communities at Alert compared to other polar deserts in the Canadian Arctic Archipelago (Bliss et al. Citation1984, Citation1994; Lévesque Citation1997). This might be partly explained by differences in methodology; we used the point-intercept method, while previous studies were based on visual estimations of cover. We reported higher vascular species richness than previous studies in similar barren communities, which could have led us to report higher cover as we attributed a 0.5% cover to every species present in the quadrat but not hit at one of the 100 rope intersections. Heterogeneity in regional plant communities can also result from local variations in soil attributes (moisture, pH, organic matter content, soil chemistry, soil texture, active-layer dynamics), topography (elevation, water movement, as well as sun, wind and snow exposure), and time since the site became free of permanent snow or ice (Walker Citation1995; Lévesque Citation1997; Christensen et al. Citation2013; Nabe-Nielsen et al. Citation2017; Zwolicki et al. Citation2020). Indeed, at Alert, barren grounds made of till have a high proportion of clay and many coastal sites are clay-rich soils; the small particle size of clay favours a better water retention (Liptzin Citation2006) and consequently supports plant colonization and growth (Nabe-Nielsen et al. Citation2017). Alert was also among the first regions to be free of the Innuitian Ice Sheet on Ellesmere Island (Dalton et al. Citation2020), leaving more time for plant development.
Successional pathways
As highlighted by Bliss et al. (Citation1984), Yurtsev (Citation1994) and Daniëls et al. (Citation2016), polar deserts are not always dry and sparsely vegetated, but some areas with limited extent can be very moist and rather continuously vegetated. We may be observing different successional stages at Alert. The early one corresponds to the first sub-community of the ford-dominated barren (Community II), which was dominated by few purple saxifrages, grasses, and lichen. The second sub-community, where expansion of the first-subcommunity species and colonization by new tolerant species (e.g., crucifers) led to a biotic cover increase, may represent the next successional stages. The Arctic willow, Salix arctica, was also present at some sites in Community II, but became more abundant in the forb-dominated tundra (Community I), indicating a stability of 250 years (Cray and Pollard Citation2015). Additional species, mostly grasses, chickweeds, and saxifrages, also colonized this mesic community. These species were also present in the more advanced successional stages that could be the wetland communities, but were supplanted by highly dominant, moisture-associated species (sedge, grass, rush, and moss). The moss-dominated wetland may be the community in the study area that reached the higher successional stage owing to peatland below the thick moss layer serving as a substrate for forb and graminoid species that were not encountered anywhere else in the study area (e.g., buttercups and Pleuropogon sabinei). Based on our observations, we suggest that primary succession at Alert corresponds to directional succession without species replacement in drier areas, and to directional succession with species replacement where favourable conditions prevail (e.g., constant water sources and fertilization such as animal feces). Radiocarbon dating of macrofossils and paleosol analysis would be necessary to determine the actual chronosequences (Bliss and Gold Citation1994) and confirm these hypotheses.
Environmental characteristics
The ordination biplot showed that communities differed regarding NDVI, elevation, distance to the ocean shore, and location with respect to the nearest snowbank (distance and downslope positioning). NDVI has been extensively used in Arctic studies as an index of vegetation ‘greenness’ (Stow et al. Citation2007; Walker et al. Citation2012; Berner et al. Citation2020), as a proxy for net primary productivity (Goward and Dye Citation1987), or to reflect biophysical properties such as biomass, leaf area index, and CO2 flux (Hope et al. Citation1993; Gower et al. Citation1999; McMichael Citation1999). Communities III, IV and V were characterized by higher NDVI values than other communities, reflecting their higher proportion of vascular plant and moss cover, and probably a higher productivity. Hope et al. (Citation1993) reported that NDVI could be community specific, with variance in the NDVI being mainly related to photosynthetic biomass and vegetation cover. Distinct spectral signatures can be used to detect vegetation communities over larger areas based on remotely sensed data (Hope et al. Citation1993; Stow et al. Citation2004). Further analyses of spectral signatures validated by ground truthing are, however, still needed at Alert. Wetland habitats represented only 7% of the landscape in the study area (), but their rich, productive plant communities may be important for herbivores (Bliss et al. Citation1984).
Elevation encompasses multiple factors that influence vegetation, including microclimate, exposure, timing of snowmelt, length of the growing season and seed availability (Lévesque Citation1997). Upland areas in the High Arctic are generally the most barren (Bliss et al. Citation1984, Citation1994; Lévesque Citation1997). Although the elevation gradient was limited from 0 to 365 m a.s.l. among the surveyed plots, plant communities in wet habitats were segregated according to elevation. All sites of Community IV, and some sites of Community V, found at higher elevations probably benefit from relatively favorable temperature and moisture conditions due to local topography (mountain slopes, valleys) or a source of water (snowmelt, underground water), as also seen in other upland polar desert areas in the Canadian Arctic Archipelago (Bliss et al. Citation1984, Citation1994). Sites of Community III were mainly located in lowlands as they were associated with lower altitude and closer to ocean shores. Sites of Community III were also the ones most associated with snowbanks; the rolling lowlands may favor the formation of perennial snowbanks.
Surprisingly, if we except the variables related to snowbanks and ocean, the other variables related to a source of water (distance to a river and lake/pond) were not significant in the CCA. Distance to a waterbody may not correlate with actual soil moisture; thus, accurately measuring soil water content with a probe will be important in future vegetation studies in the High Arctic. It is also possible that the wetland communities are mostly ground water-fed wetlands. These wetlands are found in topographical depressions and slope concavities favoring drainage input and water retention, and are known to be the most predominant wetlands in High Arctic (Woo and Young Citation2006). However, our results highlight the importance of perennial snowbanks for sustaining some vegetation communities at Alert. As stated previously, soil moisture plays a key role in tundra community composition (Le Roux et al. Citation2013; Nabe-Nielsen et al. Citation2017). Snowbanks gradually melting during the summer create a gradient of increasing water availability closer to the remaining snow patch (Billings and Bliss Citation1959; Woo and Young Citation2014). The perpetual inflow of melt water to areas downslope of snowbanks influences the richness and composition of tundra plant communities, as well as plant growth and productivity (Billings and Bliss Citation1959; Canaday and Fonda Citation1974). High soil moisture present until the end of the growing season favors species that have a low tolerance to drought (Billings and Bliss Citation1959). Community III may therefore be the most vulnerable to a potential loss of snowbanks due to climate warming. Shrinkage or disappearance of snowbanks in the High Arctic, and subsequent modifications of thermal and hydrological conditions causing shifts in vegetation, have already been reported in Canada (Young and Woo Citation2003; Woo and Young Citation2014). Increased summer precipitations linked to climate change (Collins et al. Citation2013) may compensate for the loss of snowbank melt water to some extent, but as mentioned by Nabe-Nielsen et al. (Citation2017), it is unlikely that precipitation alone will recreate the continually wet conditions found near snowbanks.
Monitoring
Two FEC attributes identified as essential by the Circumpolar Biodiversity Monitoring Programme (Christensen et al. Citation2020) were quantified in this study, namely diversity (alpha diversity, rare species, community composition) and abundance (percent cover). Along with voucher specimens representative of plot vegetation species and deposited at the Louis-Marie Herbarium (Quebec City, Quebec, Canada) and at the Canadian Museum of Nature Herbarium (Ottawa, Ontario, Canada) (Desjardins et al. Citation2021a), we archived in Nordicana D (Desjardins et al. Citation2021b) the complete floristic database of 264 georeferenced and photographed vegetation plots, including 50 plots with permanently marked quadrats. Communities currently under-represented will have additional vegetation plots marked and added to the database in the coming years. Permanently marked quadrats surveyed with the point-intercept method establish a strong baseline for the continuous monitoring of vegetation or for future comparisons at specific points in time (Elmendorf et al. Citation2012; Bjorkman et al. Citation2020). Indeed, whereas re-surveying provides the best source of information on the status and trends of taxa, the ability to detect trends strongly depends on sampling standardization. Our baseline reference is also important given the evident geographical gaps in vegetation monitoring that exist in Siberia and in large parts of the Canadian Arctic (Aronsson et al. Citation2021), and given the large variation among sites and species in the direction and magnitude of change in plant abundance (Bjorkman et al. Citation2020).
Based solely on vascular plant species and cryptogams at the highest taxonomic level, we observed distinct plant communities among the surveyed plots. However, we recognize that including cryptogams identified to species to the classification would increase the discriminating power of the analysis (Sheard and Geale Citation1983; Bliss and Svoboda Citation1984; Maycock and Fahselt Citation1992), as cryptogam diversity is known to significantly differ between locations and habitat types (Wietrzyk-Pełka et al. Citation2021). This is especially true considering that cryptogams are a major component of Arctic plant communities, with vascular plants, bryophytes, and lichens contributing, respectively, 1%, 6%, and 10% of overall Arctic plant diversity (Lewis et al. Citation2017; Zwolicki et al. Citation2020). The small size and difficult taxonomic identification of cryptogams contribute to their underrepresentation in ecological studies (Belnap and Lange Citation2003; Wietrzyk-Pełka et al. Citation2021), although they are very important for ecosystem functioning (Shively et al. Citation2001; Garcia-Pichel and Wojciechowski Citation2009; Belnap and Lange Citation2003; Pushkareva et al. Citation2017). To fully understand the impact of climate change on vascular plant and cryptogam communities and on ecosystem functioning, cryptogam species should be included in future vegetation studies at Alert.
Long-term monitoring of vegetation is especially important where anthropogenic pressures (frequent use of heavy vehicles, recreational trampling, infrastructure expansion) may negatively impact the landscape, which could be the case in the vicinity of CFS Alert. We highlight that 18 vascular species, found only opportunistically or in less than 10 vegetation plots, were rare and had a very local distribution. Several rare species were also highly restricted to a specific wetland community, which increases their vulnerability. These rare species and species of concern will be important targets for future monitoring (Christensen et al. Citation2013).
To accommodate changes in vegetation in response to outside influences, monitoring programmes must include conceptual models on expected responses and their drivers (Lindenmayer and Likens Citation2010). These models should establish which vegetation parameters should change, what main drivers are likely to be at play, and how variables can be monitored to inform trends and causal relationships (Lindenmayer and Likens Citation2010). Vegetation monitoring should thus be integrated with monitoring of other ecosystem components and environmental conditions, such as climate. It is our ambition to develop an ecosystem-based monitoring programme at Alert, similar to programmes maintained elsewhere in Canada (Gauthier et al. Citation2013), as well as in Norway and Greenland (Ims and Ehrich Citation2013).
Conclusion
This study adds knowledge to the composition and structure of Arctic plant communities in an understudied but highly vulnerable ecosystem. Along with typical polar desert plant communities found on drier grounds, we found that wetland habitats at Alert, despite representing only a small fraction of the total landscape, were occupied by three distinct communities. A detailed knowledge of local plant communities and species is a key prerequisite for ecological research and environmental assessments.
Clear baseline knowledge of species and communities is also essential in providing a template for recovery from disturbances (e.g., human activities and climate change), including identifying native species that could be used for revegetation efforts (Cray and Pollard Citation2015). Plot-scale floristic surveys combined with high-resolution imagery allow mapping of vegetation at local and regional scales and contribute to delineating essential wildlife foraging and breeding habitats, thereby helping to manage human activities in these areas. In addition, data on the occurrence of species that are rare, endemic, or of conservation concern will be a useful international contribution to the comprehensive ‘Red list of the Arctic vascular plants’, in development through the CAFF Group of the Arctic Council (Aronsson et al. Citation2021), which evaluates the status of rare and endangered Arctic plants based on the criteria used by the International Union for Conservation of Nature. Finally, the current status and distribution of plant species and communities could also help interpreting past climatic variations and will be crucial for predicting the ecological impact of the ongoing climate change in the Arctic.
Acknowledgments
We thank Marie-Pier Poulin, Gabrielle Roy, Michaël Fortier, Marie-Jeanne Rioux, Kevin Young, Jacob Caron Carrier, Francis Robitaille, Justine Drolet, Roxanne Gauvreau, and Marc Landry for helping collect the data. We thank Esther Lévesque for helping with biological soil crust classification and for commenting on the manuscript. We thank Martin Dubé, Paul Sokoloff, Annie St-Louis, Luc Sirois and Jade Legros for their help with species identification. We thank Alain Caron and Alexis Grenier-Potvin for helping with the satellite picture analysis. We thank Nathan Koutroulides, Station Warrant Officers Patrick Marceau and Dwayne Fox, as well as all the CFS station personnel for the support during the field work.
Disclosure statement
No potential conflict of interest was reported by the authors
Data availability statement
The data that support the findings of this study will be openly available in ‘Nordicana D’ at http://www.cen.ulaval.ca/nordicanad/dpage.aspx?doi=45711CE-0B46454CA9594B53.
Additional information
Funding
References
- Aiken SG, Dallwitz MJ, Consaul LL, McJannet CL, Boles RL, Argus GW, Gillett JM, Scott PJ, Elven R, LeBlanc MC, et al. 2007. Flora of the Canadian Arctic Archipelago: descriptions, illustrations, identification, and information retrieval. Ottawa (ON): NRC Research Press, National Research Council of Canada; [accessed 2020 Nov 10]. http://nature.ca/aaflora/data.
- Alekseyenko AV. 2016. Multivariate Welch t-test on distances. Bioinformatics. 32(23):3552–3558. doi:https://doi.org/10.1093/bioinformatics/btw524.
- Anderson D, Bliss L. 1998. Association of plant distribution patterns and microenvironments on patterned ground in a polar desert, Devon Island, N.W.T., Canada. Canada Arctic Alpine Res. 30(2):97–107. doi:https://doi.org/10.2307/1552124.
- Aronsson M, Heiðmarsson S, Jóhannesdóttir H, Barry T, Braa J, Burns CT, Coulson SJ, Cuyler C, Falk K, Helgason H, et al. 2021. State of the Arctic terretrial biodiversity report. Akureyri: Conservation of Arctic Flora and Fauna International Secretariat.
- Bay C. 1997. Floristical and ecological characterization of the polar desert zone of Greenland. J Veg Sci. 8(5):685–696. doi:https://doi.org/10.2307/3237373.
- Bay C. 1998. Vegetation mapping of Zackenberg valley, Northeast Greenland. Copenhagen: Danish Polar Center & Botanical Museum.
- Bell KL, Bliss LC. 1980. Plant reproduction in a High Arctic environment. Arctic Alpine Res. 12(1):1–10. doi:https://doi.org/10.2307/1550585.
- Belnap J, Kaltenecker JH, Rosentreter R, Williams J, Leonard S, Eldridge D. 2001. Biological soil crusts: ecology and management. Technical Reference 1730-2. Denver: United States Department of the Interior, Bureau of Land Management.
- Belnap J, Lange OL. 2003. Biological soil crusts: structure, function, and management. Heidelberg: Springer Science & Business Media.
- Berner LT, Massey R, Jantz P, Forbes BC, Macias-Fauria M, Myers-Smith I, Kumpula T, Gauthier G, Andreu-Hayles L, Gaglioti BV, et al. 2020. Summer warming explains widespread but not uniform greening in the Arctic tundra biome. Nat Commun. 11(1):4621. doi:https://doi.org/10.1038/s41467-020-18479-5.
- Billings WD. 1987. Constraints to plant growth, reproduction, and establishment in Arctic environments. Arctic Alpine Res. 19(4):357–365. doi:https://doi.org/10.2307/1551400.
- Billings WD, Bliss LC. 1959. An alpine snowbank environment and its effects on vegetation, plant development, and productivity. Ecology. 40(3):388–397. doi:https://doi.org/10.2307/1929755.
- Billings WD, Peterson KM. 1980. Vegetational change and ice-wedge polygons through the thaw-lake cycle in Arctic Alaska. Arctic Alpine Res. 12(4):413–432. doi:https://doi.org/10.2307/1550492.
- Bjorkman AD, García Criado M, Myers-Smith IH, Ravolainen V, Jónsdóttir IS, Westergaard KB, Lawler JP, Aronsson M, Bennett B, Gardfjell H, et al. 2020. Status and trends in Arctic vegetation: evidence from experimental warming and long-term monitoring. Ambio. 49(3):678–692. doi:https://doi.org/10.1007/s13280-019-01161-6.
- Bliss LC. 1962. Adaptations of Arctic and alpine plants to environmental conditions. Arctic. 15(2):117–144. doi:https://doi.org/10.14430/arctic3564.
- Bliss LC. 1975. Tundra grasslands, herblands, and shrublands and the role of herbivores. Geosci Man. 10:51–79.
- Bliss LC. 1981. North American and Scandinavian tundras and polar deserts. In: Bliss LC, Heal OW, Moore JJ, editors. Tundra ecosystems: a comparative analysis. New York (NY): Cambridge University Press; p. 8–24.
- Bliss LC, Matveyeva N. 1992. Circumpolar Arctic vegetation. In: Chapin FS, Jefferies RL, Reynolds JF, Shaver GR, Svoboda J, Chu EW, editors. Arctic ecosystems in a changing climate: an ecophysiological perspective. New York (NY): Academic Press; p. 59–89.
- Bliss LC, Courtin GM, Pattie DL, Riewe RR, Whitfield DWA, Widden P. 1973. Arctic tundra ecosystems. Annu Rev Ecol Syst. 4(1):359–399. doi:https://doi.org/10.1146/annurev.es.04.110173.002043.
- Bliss LC, Gold WG. 1994. The patterning of plant communities and edaphic factors along a high arctic coastline: implications for succession. Can J Bot. 72(8):1095–1107. doi:https://doi.org/10.1139/b94-134.
- Bliss LC, Henry GHR, Svoboda J, Bliss DI. 1994. Patterns of plant distribution within two polar desert landscapes. Arctic Alpine Res. 26(1):46–55. doi:https://doi.org/10.2307/1551876.
- Bliss LC, Svoboda J. 1984. Plant communities and plant production in the western Queen Elizabeth Islands. Ecography. 7(3):325–344. doi:https://doi.org/10.1111/j.1600-0587.1984.tb01137.x.
- Bliss LC, Svoboda J, Bliss DI. 1984. Polar deserts, their plant cover and plant production in the Canadian High Arctic. Ecography. 7(3):305–324. doi:https://doi.org/10.1111/j.1600-0587.1984.tb01136.x.
- Böcher TW. 1977. Cerastium alpinum and C. arcticum, a mature polyploid complex. Botaniska Notiser. 130(3):303–309.
- Borcard D, Gillet F, Legendre P. 2018. Numerical Ecology with R. 2nd ed. Cham: Springer International Publishing. Chapter 3, Association measures and matrices; p. 35–57.
- Breen K, Lévesque E. 2006. Proglacial succession of biological soil crusts and vascular plants: biotic interactions in the High Arctic. Can J Bot. 84(11):1714–1731. doi:https://doi.org/10.1139/b06-131.
- Bridgland JP. 1986. The flora and vegetation of Cape Herschel, Ellesmere Island, N.W.T. [master’s thesis]. University of Newfoundland.
- Brouillet L, Desmet P, Coursol F, Meades SJ, Favreau M, Anions M, Bélisle P, Gendreau C, Shorthouse D, and contributors. 2010. Database of vascular plants of Canada (VASCAN); [accessed 2020 Jul 05]. http://data.canadensys.net/vascan.
- Bruggemann PF, Calder JA. 1953. Botanical investigation in Northeast Ellesmere Island, 1951. Can Field-Nat. 67(4):157–174.
- Brysting AK, Elven R. 2000. The Cerastium alpinum–C. arcticum complex (Caryophyllaceae): numerical analyses of morphological variation and a taxonomic revision of C. arcticum Lange s.l. Taxon. 49(2):189–216. doi:https://doi.org/10.2307/1223835.
- CAFF. 2018. Circumpolar biodiversity monitoring program strategic plan 2018-2021. CAFF Monitoring Series Report No. 29. Akureyri: Conservation of Arctic Flora and Fauna.
- Callaghan TV, Tweedie CE, Webber PJ. 2011. Multi-decadal changes in tundra environments and ecosystems: the international polar year-back to the future project (IPY-BTF). Ambio. 40(6):555. doi:https://doi.org/10.1007/s13280-011-0162-4.
- Canaday BB, Fonda RW. 1974. The influence of subalpine snowbanks on vegetation pattern, production, and phenology. B Torrey Bot Club. 101(6):340–350. doi:https://doi.org/10.2307/2484957.
- CAVM Team. 2003. Circumpolar Arctic vegetation map. Scale 1:7,500,000. Anchorage (AK): Conservation of Arctic Flora and Fauna (CAFF) Map No. 1. U.S. Fish and Wildlife Service; [accessed 2020 Sept 21]. http://www.geobotany.uaf.edu/cavm/credits.shtml.
- Chao A, Chazdon RL, Colwell RK, Shen T-J. 2006. Abundance-based similarity indices and their estimation when there are unseen species in samples. Biometrics. 62(2):361–371. doi:https://doi.org/10.1111/j.1541-0420.2005.00489.x.
- Christensen T, Barry T, Taylor JJ, Doyle M, Aronsson M, Braa J, Burns C, Coon C, Coulson S, Cuyler C, et al. 2020. Developing a circumpolar programme for the monitoring of Arctic terrestrial biodiversity. Ambio. 49(3):655–665. doi:https://doi.org/10.1007/s13280-019-01311-w.
- Christensen T, Payne J, Doyle M, Ibarguchi G, Taylor J, Schmidt NM, Gill M, Svoboda M, Aronsson M, Behe C, et al. 2013. Arctic terrestrial biodiversity monitoring plan: terrestrial expert monitoring group, circumpolar biodiversity monitoring program. CAFF Monitoring Series Report; No. 7. Akureyri.
- Collins M, Knutti R, Arblaster J, Dufresne J-L, Fichefet T, Friedlingstein P, Gao X, Gutowski WJ, Johns T, Krinner G, et al. 2013. Long-term climate change: projections, commitments and irreversibility. In: Stocker TF, Qin D, Plattner G-K, Tignor MMB, Allen SK, Boschung J, Nauels A, Xia Y, Bex V, Midgley PM, editors. Climate change 2013: the physical science basis contribution of working group I to the fifth assessment report of the intergovernmental panel on climate change. Cambridge: Cambridge University Press; p. 1029–1136.
- Crawford RMM. 2008. Plants at the margin: ecological limits and climate change. Cambridge: Cambridge University Press.
- Cray HA, Pollard WH. 2015. Vegetation recovery patterns following permafrost disturbance in a Low Arctic setting: case study of Herschel Island, Yukon, Canada. Arct Antarct Alp Res. 47(1):99–113. doi:https://doi.org/10.1657/AAAR0013-076.
- Dahlberg A, Bültmann H. 2013. Fungi. In: Meltofte H, editor. Arctic biodiversity assessment status and trends in Arctic biodiversity. Akureyri: Conservation of Arctic Flora and Fauna; p. 355–371.
- Dalton AS, Margold M, Stokes CR, Tarasov L, Dyke AS, Adams RS, Allard S, Arends HE, Atkinson N, Attig JW, et al. 2020. An updated radiocarbon-based ice margin chronology for the last deglaciation of the North American Ice Sheet Complex. Quat Sci Rev. 234:106223. doi:https://doi.org/10.1016/j.quascirev.2020.106223
- De Cáceres M, Legendre P. 2009. Associations between species and groups of sites: indices and statistical inference. Ecology. 90(12):3566–3574. doi:https://doi.org/10.1890/08-1823.1.
- Desjardins E, Lai S, Payette S, Dubé M, Sokoloff PC, St-Louis A, Poulin M-P, Legros J, Sirois L, Vézina F, et al. 2021a. Survey of the vascular plants of alert (Ellesmere Island, Canada), a polar desert at the northern tip of the Americas. Check List. 17(1):181–225. doi:https://doi.org/10.15560/17.1.181.
- Desjardins E, Lai S, Vézina F, Tam A, Berteaux D 2021b. Cover data of vascular plants, cryptogams, and ground substrates at Alert (Ellesmere Island, Nunavut), v. 1.0 (2018-2019). Nordicana D88. doi: https://doi.org/10.5885/45711CE-0B46454CA9594B53.
- Desmet P, Brouillet L. 2013. Database of vascular plants 1750 of Canada (VASCAN): a community contributed taxonomic checklist of all vascular plants of Canada, Saint Pierre and Miquelon, and Greenland. PhytoKeys. 25:55–67. doi:https://doi.org/10.3897/phytokeys.25.3100.
- Dufrêne M, Legendre P. 1997. Species assemblages and indicator species: the need for a flexible asymmetrical approach. Ecol Monogr. 67(3):345–366.
- Elberling H. 2000. Spatial pattern of Lesquerella arctica: effects of seed bank and desiccation cracks. Écoscience. 7(1):86–91. doi:https://doi.org/10.1080/11956860.2000.11682576.
- Elmendorf SC, Henry GHR, Hollister RD, Björk RG, Boulanger-Lapointe N, Cooper EJ, Cornelissen JHC, Day TA, Dorrepaal E, Elumeeva TG, et al. 2012. Plot-scale evidence of tundra vegetation change and links to recent summer warming. Nat Clim Change. 2(6):453–457. doi:https://doi.org/10.1038/nclimate1465.
- England J. 1976. Postglacial isobases and uplift curves from the Canadian and Greenland High Arctic. Arctic Alpine Res. 8(1):61–78. doi:https://doi.org/10.2307/1550610.
- Epstein HE, Raynolds MK, Walker DA, Bhatt US, Tucker CJ, Pinzon JE. 2012. Dynamics of aboveground phytomass of the circumpolar Arctic tundra during the past three decades. Environ Res Lett. 7(1):015506. doi:https://doi.org/10.1088/1748-9326/7/1/015506.
- ESRI. 2018. ArcGIS version 10.6.1. Environmental Systems Research Institute, Inc.; [accessed 2018 May 02]. https://www.esri.com/.
- Daniëls FJA, Elvebakk A, Matveyeva NV, Mucina L. 2016. The Drabo corymbosae-Papaveretea dahliani − a new vegetation class of the High Arctic polar deserts. Hacquetia. 15(1):5–13. doi:https://doi.org/10.1515/hacq-2016-0001.
- Daniëls FJA, Gillespie L, Poulin M. 2020. ABA 2013 Appendix 9.2 – endemic Arctic vascular plant distribution. [accessed 2020 Aug 05]. http://geo.abds.is/geonetwork/srv/api/records/b0f0c3de-1e3f-4679-b7db-05a7c0c8250c.
- Garcia-Pichel F, Wojciechowski MF. 2009. The evolution of a capacity to build supra-cellular ropes enabled filamentous cyanobacteria to colonize highly erodible substrates. PLoS One. 4:e7801. doi:https://doi.org/10.1371/journal.pone.0007801.
- Gauthier G, Bêty J, Cadieux M-C, Legagneux P, Doiron M, Chevallier C, Lai S, Tarroux A, Berteaux D. 2013. Long-term monitoring at multiple trophic levels suggests heterogeneity in responses to climate change in the Canadian Arctic tundra. Philos Trans R Soc Lond B Biol Sci. 368(1624):20120482–20120482. eng. doi:https://doi.org/10.1098/rstb.2012.0482.
- GBIF. 2020. Global biodiversity information facility. [accessed 2020 Aug 05]. https://www.gbif.org.
- Government of Canada. 2010. Canadian climate normals 1981–2010 station data. [accessed 2020 Mar 29]. https://climate.weather.gc.ca/climate_normals/results_1981_2010_e.html?searchType=stnProv&lstProvince=NU&txtCentralLatMin=0&txtCentralLatSec=0&txtCentralLongMin=0&txtCentralLongSec=0&stnID=1731&dispBack=0.
- Goward SN, Dye DG. 1987. Evaluating North American net primary productivity with satellite observations. Adv Space Res. 7(11):165–174. doi:https://doi.org/10.1016/0273-1177(87)90308-5.
- Gower ST, Kucharik CJ, Norman JM. 1999. Direct and indirect estimation of leaf area index, fAPAR, and net primary production of terrestrial ecosystems. Remote Sens Environ. 70(1):29–51. doi:https://doi.org/10.1016/S0034-4257(99)00056-5.
- Halliday G. 2002. The British flora in the Arctic. Watsonia. 24:133–144.
- Hamidi B, Wallace K, Vas C, Alekseyenko AV. 2019. -test: robust distance-based multivariate analysis of variance. Microbiome. 7(1):51. doi:https://doi.org/10.1186/s40168-019-0659-9.
- Hodson E, Shahid F, Basinger J, Kaminskyj S. 2008. Fungal endorhizal associates of Equisetum species from Western and Arctic Canada. Mycol Prog. 8(1):19. doi:https://doi.org/10.1007/s11557-008-0574-0.
- Hope AS, Kimball JS, Stow DA. 1993. The relationship between tussock tundra spectral reflectance properties and biomass and vegetation composition. Int J Remote Sens. 14(10):1861–1874. doi:https://doi.org/10.1080/01431169308954008.
- Hultén E. 1956. The Cerastium alpinum complex. A case of world-wide introgressive hybridization. Svensk Botanisk Tidskrift. 50(3):411–495.
- Ims RA, Ehrich D. 2013. Terrestrial ecosystems. In: Meltofte H, editor. Arctic biodiversity assessment: status and trends in Arctic biodiversity. Akureyri: Conservation of Arctic Flora and Fauna; p. 385–440.
- IPCC. 2019. IPCC Special report on the ocean and cryosphere in a changing climate. [accessed 2020 Oct 26]. https://www.ipcc.ch/srocc/.
- Jonasson S. 1988. Evaluation of the point intercept method for the estimation of plant biomass. Oikos. 52(1):101–106. doi:https://doi.org/10.2307/3565988.
- Jones GA, Henry GHR. 2003. Primary plant succession on recently deglaciated terrain in the Canadian High Arctic. J Biogeogr. 30(2):277–296. doi:https://doi.org/10.1046/j.1365-2699.2003.00818.x.
- Le Roux PC, Aalto J, Luoto M. 2013. Soil moisture’s underestimated role in climate change impact modelling in low-energy systems. Global Change Biol. 19(10):2965–2975. doi:https://doi.org/10.1111/gcb.12286.
- Legendre P, De Cáceres M, Morlon H. 2013. Beta diversity as the variance of community data: dissimilarity coefficients and partitioning. Ecol Lett. 16(8):951–963. doi:https://doi.org/10.1111/ele.12141.
- Legendre P, Gallagher ED, Legendre P, Gallagher ED. 2001. Ecologically meaningful transformations for ordination of species data. Oecologia. 129(2):271–280. doi:https://doi.org/10.1007/s004420100716.
- Legendre P, Legendre L. 2012. Numerical ecology. 3rd. Vol. 24. Amsterdam: Elsevier.
- Lévesque E. 1997. Plant distribution and colonization in extreme polar deserts, Ellesmere Island, Canada [dissertation]. Toronto (ON): University of Toronto.
- Lévesque E. 2001. Small scale plant distribution within a polar desert plateau, central Ellesmere Island, Canada. Écoscience. 8(3):350–358. doi:https://doi.org/10.1080/11956860.2001.11682663.
- Lewis LR, Ickert-Bond SM, Biersma EM, Convey P, Goffinet B, Hassel K, La Farge C, Metzgar JS, Stech M, Villarreal JC, et al. 2017. Future directions and priorities for Arctic bryophyte research. Arctic Sci. 3:475–497. doi:https://doi.org/10.1139/as-2016-0043.
- Lindenmayer D, Likens G. 2010. Effective ecological monitoring. Collingwood: CSIRO Publishing.
- Liptzin D. 2006. A banded vegetation pattern in a High Arctic community on Axel Heiberg Island, Nunavut, Canada. Arct Antarct Alp Res. 38(2):216–223. doi:https://doi.org/10.1657/1523-0430(2006)38[216:ABVPIA]2.0.CO;2.
- Mamet SD, Young N, Chun KP, Johnstone JF. 2016. What is the most efficient and effective method for long-term monitoring of alpine tundra vegetation? Arctic Sci. 2(3):127–141. doi:https://doi.org/10.1139/as-2015-0020.
- Maycock PF, Fahselt D. 1992. Vegetation of stressed calcareous screes and slopes in Sverdrup Pass, Ellesmere Island, Canada. Can J Bot. 70:2359–2377. doi:https://doi.org/10.1139/b92-296.
- McMichael CE. 1999. Estimating CO2 exchange at two sites in Arctic tundra ecosystems during the growing season using a spectral vegetation index. Int J Remote Sens. 20(4):683–698. doi:https://doi.org/10.1080/014311699213136.
- Mihoub J-B, Henle K, Titeux N, Brotons L, Brummitt NA, Schmeller DS. 2017. Setting temporal baselines for biodiversity: the limits of available monitoring data for capturing the full impact of anthropogenic pressures. Sci Rep. 7(1):41591. doi:https://doi.org/10.1038/srep41591.
- Motyka J, Dobrzanski B, Zawadzki S. 1950. Wstepne badania nad lakami polud-niowo-wschodniej Lubelszczyzny (Preliminary studies on meadows in the south-east of Lublin province). Ann Univ Mariae Curie-Sklodowska 5E. 5(13):367–447. Polish.
- Muc M, Freedman B, Svoboda J. 1989. Vascular plant communities of a polar oasis at Alexandra Fiord (79° N), Ellesmere Island, Canada. Can J Bot. 67(4):1126–1136. doi:https://doi.org/10.1139/b89-147.
- Nabe-Nielsen J, Normand S, Hui FKC, Stewart L, Bay C, Nabe-Nielsen LI, Schmidt NM. 2017. Plant community composition and species richness in the High Arctic tundra: from the present to the future. Ecol Evol. 7(23):10233–10242. doi:https://doi.org/10.1002/ece3.3496.
- Nakatsubo T, Uchida M, Sasaki A, Kondo M, Yoshitake S, Kanda H. 2015. Carbon accumulation rate of peatland in the High Arctic, Svalbard: implications for carbon sequestration. Polar Sci. 9(2):267–275. doi:https://doi.org/10.1016/j.polar.2014.12.002.
- Natural Resources Canada. 2015. Canadian digital elevation model (CDEM). Ottawa (ON); [accessed 2020 Mar 29]. https://open.canada.ca/data/en/dataset/7f245e4d-76c2-4caa-951a-45d1d2051333.
- Natural Resources Canada. 2017. CanVec series. Ottawa (ON); [accessed 2020 Mar 29]. https://open.canada.ca/data/en/dataset/8ba2aa2a-7bb9-4448-b4d7-f164409fe056.
- NatureServe. 2020. NatureServe explorer. NatureServe; [accessed 2020 Oct 05]. https://explorer.natureserve.org/.
- O’Kane K. 2018. Plant succession in the High Arctic: patterns & mechanisms [master’s thesis]. Vancouver (BC): University of British Columbia.
- Pattison RR, Jorgenson JC, Raynolds MK, Welker JM. 2015. Trends in NDVI and tundra community composition in the Arctic of NE Alaska between 1984 and 2009. Ecosystems. 18(4):707–719. doi:https://doi.org/10.1007/s10021-015-9858-9.
- Petersen A, Zöckler C, Gunnarsdottir M. 2004. Circumpolar biodiversity monitoring program framework document - CBMP Report No. 1. Akureyri: Conservation of Arctic Flora and Fauna.
- Peterson KM. 2014. Plants in Arctic environments. In: Monson RK, editor. Ecology and the environment: the plant sciences, volume 8. New York (NY): Springer; p. 363–388.
- Pushkareva E, Kvíderová J, Šimek M, Elster J. 2017. Nitrogen fixation and diurnal changes of photosynthetic activity in Arctic soil crusts at different development stage. Eur J Soil Biol. 79:21–30. doi:https://doi.org/10.1016/j.ejsobi.2017.02.002.
- R Core Team. 2020. R: a language and environment for statistical computing. Vienna: R Foundation for Statistical Computing; [accessed]. http://www.r-project.org/index.html.
- Rao CR. 1995. A review of canonical coordinates and an alternative to correspondence analysis using Hellinger distance. Qüestiió. 19:23–63.
- Ravolainen V, Soininen EM, Jónsdóttir IS, Eischeid I, Forchhammer M, Van Der Wal R, Pedersen ÅØ. 2020. High Arctic ecosystem states: conceptual models of vegetation change to guide long-term monitoring and research. Ambio. 49(3):666–677. doi:https://doi.org/10.1007/s13280-019-01310-x.
- Ricotta C, Podani J. 2017. On some properties of the Bray-Curtis dissimilarity and their ecological meaning. Ecol Complex. 31:201–205. doi:https://doi.org/10.1016/j.ecocom.2017.07.003.
- Shaver GR, Bret-Harte MS, Jones MH, Johnstone J, Gough L, Laundre J, ChapinFS. 2001. Species composition interacts with fertilizer to control long-term change in tundra productivity. Ecology. 82(11):3163–3181. doi:https://doi.org/10.1890/0012-9658(2001)082[3163:SCIWFT]2.0.CO;2.
- Sheard JW, Geale DW. 1983. Vegetation studies at Polar Bear Pass, Bathurst Island, N.W.T. I. Classification of plant communities. Can J Botany . 61(6):1618–1636.
- Shively JM, English RS, Baker SH, Cannon GC. 2001. Carbon cycling: the prokaryotic contribution. Curr Opin Microbiol. 4:301–306. doi:https://doi.org/10.1016/S1369-5274(00)00207-1.
- Shur Y, Jorgenson T, Kanevskiy M, Ping C-L. 2008. Formation of frost boils and earth hummocks. In: Kane DI, Hinkel KM, editors. Ninth International Conference on Permafrost, extended abstracts; Fairbanks: Institute of Northern Engineering, University of Alaska. p. 287–288.
- Smith SL, Throop J, Lewkowicz AG, Burn CR. 2012. Recent changes in climate and permafrost temperatures at forested and polar desert sites in northern Canada. Can J Earth Sci. 49(8):914–924. doi:https://doi.org/10.1139/e2012-019.
- Sohlberg EH, Bliss LC. 1984. Microscale pattern of vascular plant distribution in two high arctic plant communities. Can J Bot. 62(10):2033–2042. doi:https://doi.org/10.1139/b84-277.
- Solstad H. 2008. Taxonomy and evolution of the diploid and polyploid Papaver sect. Meconella (Papavaraceae) [dissertation]. Oslo: University of Oslo.
- Stow D, Hope A, McGuire D, Verbyla D, Gamon J, Huemmrich F, Houston S, Racine C, Sturm M, Tape K, et al. 2004. Remote sensing of vegetation and land-cover change in Arctic tundra ecosystems. Remote Sens Environ. 89(3):281–308. doi:https://doi.org/10.1016/j.rse.2003.10.018.
- Stow D, Petersen A, Hope A, Engstrom R, Coulter L. 2007. Greenness trends of Arctic tundra vegetation in the 1990s: comparison of two NDVI data sets from NOAA AVHRR systems. Int J Remote Sens. 28(21):4807–4822. doi:https://doi.org/10.1080/01431160701264284.
- Svoboda J, Henry GHR. 1987. Succession in marginal Arctic environments. Arctic Alpine Res. 19(4):373–384. doi:https://doi.org/10.2307/1551402.
- Talbot SS, Yurtsev BA, Murray DF, Argus GW, Bay C, Elvebakk A. 1999. Atlas of the rare vascular plants of the Arctic. CAFF Technical Report No. 3. Anchorage (AK): U. S. Fish & Wildlife Service.
- Tape KD, Hallinger M, Welker JM, Ruess RW. 2012. Landscape heterogeneity of shrub expansion in Arctic Alaska. Ecosystems. 15(5):711–724. doi:https://doi.org/10.1007/s10021-012-9540-4.
- Taylor A, Brown RJE, Pilon J, Judge AS. 1982. Permafrost and the shallow thermal regime at Alert, N.W.T. In: French HM, editor. Proceedings of the Fourth Canadian Permafrost Conference; Mar 2–6 1981; Calgary, AB. Ottawa (ON): National Research Council of Canada. p. 12–22.
- Vanderpuye AW, Elvebakk A, Nilsen L. 2002. Plant communities along environmental gradients of high-arctic mires in Sassendalen, Svalbard. J Veg Sci. 13(6):875–884. doi:https://doi.org/10.1111/j.1654-1103.2002.tb02117.x.
- Walker A, Epstein H, Raynolds M, Kuss P, Kopecký M, Frost G, Daniëls F, Leibman M, Moskalenko N, Matyshak G, et al. 2012. Environment, vegetation and greenness (NDVI) along the North America and Eurasia Arctic transects. Environ Res Lett. 7:015504. doi:https://doi.org/10.1088/1748-9326/7/1/015504.
- Walker D, Walker M. 1991. History and pattern of disturbance in Alaskan arctic terrestrial ecosystems: a hierarchical approach to analysing landscape change. J Appl Ecol. 28:244–276. doi:https://doi.org/10.2307/2404128.
- Walker DA, Kuss P, Epstein HE, Kade AN, Vonlanthen CM, Raynolds MK, Daniëls FJA. 2011. Vegetation of zonal patterned-ground ecosystems along the North America Arctic bioclimate gradient. Appl Veg Sci. 14(4):440–463. doi:https://doi.org/10.1111/j.1654-109X.2011.01149.x.
- Walker M. 1995. Patterns and causes of Arctic plant community diversity. In: Chapin FS, Körner C, editors. Arctic and Alpine biodiversity: patterns, causes and ecosystem consequences. Ecological studies (analysis and synthesis). Vol. 113. Berlin: Springer; p. 3–20.
- Walker M. 1996. Community baseline measurements for ITEX studies. In: Molau U, Mølgaard P, editors. International tundra experiment manual. 2nd ed. Copenhagen: Danish Polar Center; p. 39–41.
- Wietrzyk-Pełka P, Rola K, Patchett A, Szymański W, Węgrzyn MH, Björk RG. 2021. Patterns and drivers of cryptogam and vascular plant diversity in glacier forelands. Sci Total Environ. 770:144793. doi:https://doi.org/10.1016/j.scitotenv.2020.144793.
- Woo MK, Young KL. 2006. High Arctic wetlands: their occurrence, hydrological characteristics and sustainability. J Hydrol. 320(3–4):432–450. doi:https://doi.org/10.1016/j.jhydrol.2005.07.025
- Woo M-K, Young KL. 2014. Disappearing semi-permanent snow in the High Arctic and its consequences. J Glaciol. 60(219):192–200. doi:https://doi.org/10.3189/2014JoG13J150.
- Wookey P, Aerts R, Bardgett R, Baptist F, Bråthen K, Cornelissen J, Gough L, Hartley I, Hopkins D, Lavorel S, et al. 2009. Ecosystem feedbacks and cascade processes: understanding their role in the responses of Arctic and alpine ecosystems to environmental change. Global Change Biol. 15:1153–1172. doi:https://doi.org/10.1111/j.1365-2486.2008.01801.x.
- Young KL, Woo M-K. 2003. Thermo-hydrological responses to an exceptionally warm, dry summer in a high Arctic environment. Nordic Hydrol. 34(1–2):51–70. doi:https://doi.org/10.2166/nh.2003.0028.
- Yurtsev BA. 1994. Floristic division of the Arctic. J Veg Sci. 5(6):765–776. doi:https://doi.org/10.2307/3236191.
- Zwolicki A, Zmudczyńska-Skarbek K, Wietrzyk-Pełka P, Convey P. 2020. High Arctic vegetation. In: Goldstein MI, DellaSala DA, editors. Encyclopedia of the world’s biomes. Oxford: Elsevier; p. 465–479.