
ABSTRACT
The Great Whale River in subarctic Quebec, Canada, is one of the main freshwater inflows to Hudson Bay. This region is experiencing rapid climate change, with pronounced impacts on the cryosphere, and ongoing socio-economic development that may accelerate with future road and shipping links. This review integrates information available to date on the Great Whale River ecosystem, which we define as the river and its watershed, its source lakes and streams, and the river mouth environment and beyond the shoreline in southeastern Hudson Bay. Our aim was to define the current state of this ecosystem as a baseline for ongoing observations, with emphasis on (1) the distribution of water masses, optical characteristics, freshwater discharge, and ice cover; (2) concentrations and fluxes of carbon, nutrients, and contaminants; (3) abundance, production and diversity of the organisms associated with the sea ice ecosystem; (4) plankton abundance, biomass, production, and assemblages; (5) benthic abundance and diversity; (6) fish abundance, diversity and population dynamics; (7) marine mammal biology; and (8) global change impacts on freshwater and marine habitats. This synthesis provides a first step towards the integrated management of the Great Whale River ecosystem, and for similar freshwater-marine systems in the subarctic region.
Résumé
Située dans la région subarctique du Québec, Canada, la Grande rivière de la Baleine est l’un des principaux apports d’eau douce dans la baie d’Hudson. Cette région connaît un changement climatique rapide, avec des impacts prononcés sur la cryosphère, et un développement socio-économique en cours qui pourrait s’accélérer avec la mise en place de futures liaisons routières et maritimes. Cette revue de littérature intègre l’information disponible à ce jour sur l’écosystème de la Grande rivière de la Baleine, que nous définissons comme la rivière et son bassin versant, ses lacs et ruisseaux sources, et l’environnement de l’embouchure de la rivière et au-delà du littoral dans le sud-est de la baie d’Hudson. Notre objectif était de définir l’état actuel de cet écosystème comme référence pour les observations en cours, en mettant l’accent sur: (1) la répartition des masses d’eau, leurs caractéristiques optiques, le débit d’eau douce et le couvert de glace; (2) les concentrations et les flux de carbone, de nutriments et de contaminants; (3) l’abondance, la production et la diversité des organismes associés à l’écosystème de la glace de mer; (4) l’abondance, la biomasse, la production et les assemblages du plancton; (5) l’abondance et la diversité benthique; (6) l’abondance, la diversité et la dynamique des populations de poissons; (7) la biologie des mammifères marins; et (8) les impacts du changement planétaire sur les habitats d’eau douce et marins. Cette synthèse constitue une première étape vers une gestion intégrée de l’écosystème de la Grande rivière de la Baleine et de systèmes similaires dans la région subarctique.
Introduction
Hudson Bay is a large (830 × 103 km2) subarctic shelf-like inland sea usually covered by ice from December to early June or later (Markham Citation1986; Kuzyk et al. Citation2010; Kuzyk and Candlish Citation2019). Like the Arctic Ocean, it is strongly influenced by freshwater inputs that result in reduced surface salinities, particularly in coastal areas (Prinsenberg Citation1986). Although a large number of studies have examined the ecology of various marine subarctic ecosystems (Hunt and Drinkwater Citation2005; Drinkwater et al. Citation2018 and refs therein), little is known about Hudson Bay in this regard due to its remote location (but see Kuzyk and Candlish Citation2019). The ecosystem properties of the Great Whale River, one of the largest rivers discharging into Hudson Bay, are also poorly known, yet this is an area with a long history of human occupation.
The mouth of the Great Whale River has been a traditional site of beluga whale hunting, and archaeological studies have revealed evidence of paleo-Inuit occupation dating back to 3800 years before the present, with nomadic Indigenous use of the area over the subsequent millennia (Bhiry et al. Citation2011). During the last 200 years, there have been successive waves of construction and development at this location. These include a Hudson’s Bay Company trading post opened in 1820, and the establishment of the twin hamlets of Whapmagoostui (Cree First Nation) and Kuujjuarapik (Inuit) in the 20th century. A military airfield was built in the 1950s, and up until the mid 1960s this was the site of a NORAD control station for the Mid-Canada Line radar defense system (Pouliot Citation2020).
In the early seventies, Hydro-Québec, a government-owned public utility and one of the world’s largest hydroelectric producers was engaged in projects to dam several large rivers flowing into James Bay and Hudson Bay for hydroelectric power generation. Of particular interest were the La Grande River and the Great Whale River, with the latter eventually abandoned as a development project because of Indigenous concerns (Bhiry et al. Citation2011), although some headwater tributaries were diverted into the La Grande reservoir (Dynesius and Nilsson Citation1994; Déry et al. Citation2016). The planning for these large engineering projects motivated several consulting studies dealing with the physical and biological features of the bay during open water and under sea ice conditions. During the 1980s and 1990s, the number of publications referring to the Great Whale River and the area of southeastern Hudson Bay influenced by and close beyond its freshwater plume (hereafter called the Great Whale River ecosystem) increased considerably, although many of these were restricted to unreferred technical reports. Localized studies of the river and associated estuary have been conducted out of the research station of the Centre d’études nordiques (CEN) at Whapmagoostui-Kuujjuarapik from the 1970s onwards (Bhiry et al. Citation2011), including a project on sea ice processes (Gosselin et al. Citation1990) and permafrost wetlands that drain into the Great Whale River ecosystem (Vincent et al. Citation2017). There have also been recent oceanographic measurements in the region by icebreakers (Jacquemot et al. Citation2021).
The purpose of this review is to present a comprehensive overview of available information on the physical, chemical, and biological properties of the Great Whale River ecosystem, as a basis for comparisons with other subarctic river-estuary systems, and as a foundation for ongoing research. This review also aims to provide a first step towards an integrated understanding and management of this and similar subarctic ecosystems, in the dual context of ongoing economic development and rapid climate change.
Literature review
Relevant studies on the Great Whale River ecosystem were compiled using the electronic database Web of Science (WoS, Thompson Reuters; https://webofknowledge.com). The literature search was performed in ‘topics’ (Article title, Abstract, Author, Keywords and Keywords plus) before August 2020 using [(Great Whale River AND Hudson Bay) OR (Manitounuk Sound AND Hudson Bay)]. Subsequent searches were also undertaken based on cited papers and technical reports, including via Google Scholar (https://scholar.google.ca).
Physiography of the Great Whale River
The Great Whale River watershed
The Great Whale River (Kuujjuaraapiup Kuunga in Inuktitut, Whapmagoostui in Cree, Grande rivière de la Baleine en français; Commission de toponymie Citation2020) flows 726 km from Lake Saint-Luson through Lake Bienville to southeastern Hudson Bay at Manitounuk Sound near Kuujjuarapik/Whapmagoostui (lat. 55°16.5ʹN, long. 77° 45.5ʹ W) in an area with offshore depths rarely exceeding 100 m (Ingram Citation1981) (; images of the area in ). With a drainage basin of 42,735 km2, the Great Whale River is one of the largest rivers of northern Québec (Bhiry et al. Citation2011). In eastern Hudson Bay, the Great Whale River represents a major freshwater inflow, ranking fifth in importance in terms of total discharge contribution (Déry et al. Citation2005). Hudon et al. (Citation1996) provided a detailed description of the landscape surrounding the Great Whale River. The bedrock on which the river flows is composed of granite. Interspersed with areas of lichen and peatland bogs, the tree vegetation of the upper watershed is mainly composed of spruce (Picea spp.), tamarack (Larix laricina), and trembling aspen (Populus tremuloides). In riparian areas, Hudon et al. (Citation1996) reported the occurrence of basalm poplar (Populus balsamifera), sweet gale (Myrica gale), and speckled alder (Alnus rugosa). Finally, the region of the lower 10 km of the river is covered by vegetation typical of the forest–tundra transition zone with spruce, shrubs, open lichen fields, and wetland plants such as Carex, Sphagnum and brown mosses (further details in Bhiry et al. Citation2011).
Figure 1. Location of the Great Whale River region in southeastern Hudson Bay, northern Québec, Canada
Figure 2. The Great Whale River ecosystem
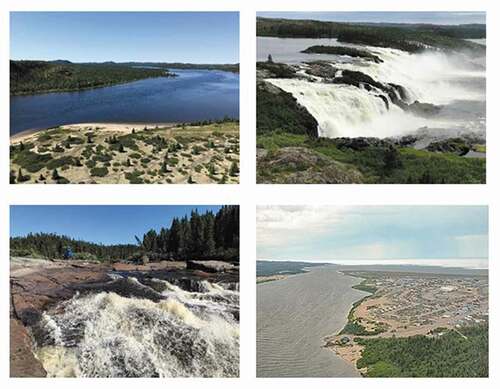
Figure 3. The Great Whale River ecosystem in summer. Top left: campsite 151 km upstream from the mouth; Top right: waterfall 67 km upstream. Bottom left: brown CDOM-rich water in the Kwakwatanikapistikw River that discharges into the Great Whale River, 15 km upstream from the mouth. Bottom right: Whapmagoostui-Kuujjuarapik at the mouth of the Great Whale River in July 2019; note the sea ice offshore in Hudson Bay. Photocredits: WF Vincent/CEN and P. Coupel/Sentinel North
Permafrost occurs sparsely in the Great Whale River basin (Bhiry et al. Citation2011). The region near the river mouth is located in the discontinuous, scattered permafrost area where the permafrost occupies much less than 50% of the land surface, while the rest of the basin lies in the sporadic permafrost region with isolated patches of permafrost that represent <2% of the land surface (Allard and Seguin Citation1987; Vonk et al. Citation2015).
Hydrological characteristics and sea ice cover
The Great Whale River contributes about 2.8% of the total annual discharge entering Hudson Bay directly (Déry et al. Citation2005). For the period 1964–2000, the Great Whale River mean annual discharge rate was 19.77 km3 and the mean peak flow induced by meltwater was 1735.7 m3 s−1 and occurred at the beginning of June (Déry et al. Citation2005). A recent reassessment for the period 1964–2013 reported a slight decrease in the mean discharge rate, with a value of 19.61 km3 y−1 (SD = 2.60 km3 y−1) (Déry et al. Citation2016). At its entry into the sea at Kuujjuarapik-Whapmagoostui (), the river water forms a buoyant plume. As is the case for large northern temperate rivers, the Great Whale River freshwater discharge is seasonal and follows a consistent seasonal pattern with highest discharge in spring and autumn. Flow reductions occur in summer and winter , however the large river plume persists off the Great Whale River mouth throughout the year (Ingram Citation1981; Ingram and Larouche Citation1987). In late winter under the ice, the plume can be 10–20 times larger and 2–3 times thicker than in the absence of ice. During the period July to December, the Great Whale River plume covers about 100 km2, and can increase to 1000 km2 in February and 2000 km2 in March (Ingram Citation1981).
The magnitude of freshwater discharge varies over time with a minimum occurring in mid-April and maximum in late May to early June (Ingram et al. Citation1996). It ranges from 135 to 200 m3 s−1 from February to April, and at the freshet in May the freshwater discharge increases to a maximum of 910 m3 s−1. With the freshet, the reduced friction and wind mixing allow the plume to extend NNE over 1000 km2 with an average thickness of about 5 m (Ingram Citation1981; Ingram and Larouche Citation1987). With the break-up of the seasonal ice cover, there is increased wind stress and larger tidal flow that induces a rapid mixing of the Great Whale River plume with the underlying saline waters, reducing stratification in the area (Lepage and Ingram Citation1991).
Manitounuk Sound is located between the mouths of the Great Whale River and the Little Whale River (). It extends over a length of 60 km and has an average width of 3 km. The freshwater plume of the Great Whale River strongly affects the characteristics of the water masses and circulation in Manitounuk Sound (Ingram Citation1981). Ingram and Larouche (Citation1987) showed that the water circulation in Manitounuk Sound was characterized by freshwater input to the surface and saline water exchange at depth.
A 1-m thick ice covers the Great Whale River from approximately mid-November to late May, which breaks up around May 20 (Wilson Citation1968). The southeastern Hudson Bay where the Great Whale River drains is generally ice-covered from December until early June (Larouche and Galbraith Citation1989; Lalande and Fortier Citation2011), but can persist into July (). In the region off Kuujjuarapik, the ice cover can remain intact for as long as 2–3 weeks after the river breaks up. The occurrence of this ice cover provides conditions of high river discharge under the sea ice cover (Ingram and Larouche Citation1987).
Chemical and optical properties
Nutrients and contaminants
Nutrients were measured in the Great Whale River (Hudon et al. Citation1996; Kuzyk et al. Citation2010), the Manitounuk Sound (Legendre and Simard Citation1979; Legendre et al. Citation1981; Gosselin et al. Citation1985), and in the coastal marine waters off the Great Whale River (Legendre and Simard Citation1979; Gosselin et al. Citation1990; Legendre et al. Citation1996; Harvey et al. Citation1997; Lapoussière et al. Citation2013) during the ice-covered and open-water periods. They were also determined in the bottom horizon of the sea ice of Manitounuk Sound (Gosselin et al. Citation1985) and the bay offshore the Great Whale River (Maestrini et al. Citation1986). Nutrient studies on the river are in progress (Blais et al. Citation2021), with limnological data including greenhouse gas levels being updated in Matveev et al. (Citation2020).
Nutrient concentrations of the Great Whale River are typical of oligotrophic waters of the Canadian Shield, with low concentrations of dissolved inorganic nitrogen and phosphorus throughout the year. During the year 1990–1991, the monthly annual range was 0.2–2.1 µM for nitrate-nitrite (or 0.2–2.1 µmol NO3 L−1), 0.5–1.8 µM for ammonium, and 0.06–0.17 µM for phosphate (Hudon et al. Citation1996). Dissolved inorganic nitrogen concentrations were slightly higher in January and March (under the ice cover) than during the ice-free period. Phosphate concentrations were near the limit of detection (i.e., 0.03 µM) during the summer and were slightly higher during the spring. At the mouth of the Great Whale River, similar low concentrations of nitrate and phosphate were measured during the vernal ice-covered period (nitrate: 1.53 µM; phosphate 0.10 µM; Legendre et al. Citation1996) and in open water in September 1976 (nitrate: <0.04 µM; phosphate: 0.21 µM; Legendre and Simard Citation1979). In contrast to other macronutrients, the Great Whale River is rich in silicate. At the river’s mouth, its mean concentration is ca.15.9 µM (up to 33 µM) during the vernal ice-covered period (Legendre et al. Citation1996) and ca. 5.7 µM in open water in late summer-early fall (Legendre and Simard Citation1979).
Hudon et al. (Citation1996) estimated the daily amount of dissolved inorganic nitrogen and phosphorus exported from the river to Hudson Bay to be, respectively, on the order of 4.7 × 10⁶ g and 0.9 × 10⁶ g in May–June (using a freshet discharge of 2000 m3 s−1) and of 0.8 × 10⁶ g and 0.09 × 10⁶ g in August (using a minimum summer discharge of 500 m3 s−1). Using the silicate concentrations shown in the previous paragraph, loads of silicate carried to the bay equaled 77.2 × 10⁶ g d−1 in late spring and 6.9 × 10⁶ g d−1 during the summer. The river is a significant source of dissolved silicon for the coastal waters of the bay and can therefore help sustain primary production by diatoms (see below).
The Great Whale River plume is much larger in surface area under the sea-ice cover than in open water for a given freshwater discharge (Ingram and Larouche Citation1987). This plume affects the spatial and temporal distribution of nutrients in the Manitounuk Sound and the bay. In the brackish waters of the sound, surface nutrient concentrations underneath the ice cover were, on average, 2.8 µM for nitrate, 0.2 µM for phosphate, and 9.6 µM for silicate from February to May (salinity: 2–18 psu; Legendre et al. Citation1981). Similar averaged concentrations (1.9 µM for nitrate, 0.31 for phosphate, and 14.8 µM for silicate) were measured northeast of Paint Island during the vernal ice-covered period (salinity ca. 5 psu; Gosselin et al. Citation1985). In both studies, the deeper waters were richer in nutrients than the brackish water, except for silicate. In late summer-early fall, surface nutrient concentrations (nitrate: 0.14 µM; silicate: 6.3 µM) were lower than during the ice-covered period, except for phosphate (0.65 µM) (salinity < 26 psu; Legendre and Simard Citation1979). Also, the deeper waters were richer in nutrients than surface waters, except for phosphate showing similar concentrations.
From late March to mid-May, nutrients were measured in the surface waters underneath the sea ice during eight campaigns conducted from 1978 to 1990 in the bay offshore the river, making possible to derive a linear relationship between surface nutrient concentrations and salinities ranging from 0 to 32 psu (Table 2 in Legendre et al. Citation1996). Phosphate and ammonium at the ice–water interface significantly increased with salinity (0 to 32 psu) with values from ca. 0.2 to 1 µM and from ca. 1 to 3 µM, respectively. In contrast, nitrate and silicate decreased with salinity (0 to 32 psu) with values ca. 1.5 to 1.1 µM and from ca. 16 to 4 µM, respectively. Urea concentration ranged from <0.2 to 4.5 µM (mean ca. 1.8 µM) and did not show any significant relationship with salinity. Along the salinity gradient, the ƩN:P (ƩN representing the sum of all nitrogenous nutrients) and Si:P molar ratios decreased from ca. 10 to 4 and from ca. 100 to 3, whereas the ƩN:Si increased from ca. 0.1 to 2. These data were compared with the critical values of 16 for N:P and 1.1 for N:Si ratios (Redfield et al. Citation1963; Brzezinski Citation1985) to determine the most limiting nutrient for phytoplankton and ice algal growth. Silicon may be potentially limiting at salinity >21–28 psu, and nitrogen at salinity <21 psu or even over the whole range of salinities. Phosphorus might never limit algae or, if such limitation does occur, it would be at salinities <19 psu (Legendre et al. Citation1996).
During the open-water period, an extensive sampling of the coastal waters was conducted in the area between the Great Whale River and Little Whale River. In mid-August 1976, nitrate, phosphate and silicate concentrations were, on average, 0.12, 0.47 and 5.7 µM at 0–3 m and 4.18, 1.21 and 13.9 µM in the deeper waters, respectively (Legendre and Simard Citation1979). Similar low surface nutrient concentrations were measured at a station offshore the Great Whale River in early September 1993 (Harvey et al. Citation1997) and early October 2005 (Lapoussière et al. Citation2009). Legendre and Simard (Citation1979) data showed a coastal-offshore gradient, where surface nitrate and phosphate increased away from the coast, as the surface layer become cooler and saltier. This contrasts with ice-covered period when surface nitrate slightly decreases along the salinity gradient.
Overall, these results indicate that nitrate and phosphate concentrations of the Great Whale River are typical of oligotrophic waters of the Canadian Shield. The input of dissolved inorganic nitrogen by the river is relatively low compared to phosphate and silicate and may limit the primary production in the coastal waters. In offshore waters, diatoms and silicoflagellates with an absolute need for silicon to build their skeletons may be periodically limited by silicate supply (Gosselin et al. Citation1990; Legendre et al. Citation1996).
On a broader perspective, Kuzyk et al. (Citation2010) compared the nitrate concentration in different Hudson Bay rivers. During fall, the nitrate concentration in the Great Whale River (0.86 µM) was lower than in Churchill (2.02 µM), Nelson (6.31 µM), Hayes (1.52 µM), and Winsik (1.46 µM) rivers. This may be explained by a difference in watershed distribution: the wetland complex characterizing the western part and sporadic or continuous permafrost distinguishing the eastern part of the bay (Vonk et al. Citation2015; Tremblay et al. Citation2019). Also, river inflow, which is constrained to nearshore regions of Hudson Bay, appears to be a relatively minor source of nitrate compared to the upwelling of deep waters. However, river inflow may contribute indirectly to enhanced inshore nutrient supply by supporting large-scale estuarine circulation and consequently entrainment and upwelling of deep water in this area (Kuzyk et al. Citation2010).
Contaminant studies in the area have been sparse, and mainly focused on mercury cycling (Poissant et al. Citation2008). Some data are also available for other metal contaminants at the mouth of the Great Whale River (Xavier et al. Citation2013). Early human health studies of mercury and organochlorine contamination in Nunavik, including at Kuujjuarapik, indicated unexpectedly high levels of these contaminants in Inuit communities (Dewailly et al. Citation1989, Citation2001). More recent studies have shown decreasing levels that may reflect changes in diet as well as reduced levels of food contamination (Adamou et al. Citation2020), but there are few supporting environmental data. This lack of information, yet evidence of some contaminants in high concentrations, indicates that contaminant research and monitoring are important priorities for future work on Great Whale River fresh waters, marine waters, river ice, sea ice, snow and the overlying atmosphere.
Constant et al. (Citation2007) reported high mercury levels in snow in the Kuujjuarapik region including on the river, with values up to 3.5 pM; these levels were more than twofold higher than the maximal concentrations observed in the Canadian high Arctic (Lahoutifard et al. Citation2005; St. Louis et al. Citation2005). These results were obtained during episodic atmospheric mercury depletion events (AMDEs) and in the snowmelt period, long after AMDEs had occurred. Constant and co-authors also noted that total mercury (THg) concentrations increased and were inversely proportional to the distance from Hudson Bay. They concluded that marine aerosols were an important source of the toxic species methyl mercury (MeHg), and that the newly deposited MeHg was unstable in the snow cover since 15–56% of the MeHg was demethylated or otherwise lost during the nighttime period. In this study, MeHg snow concentrations higher than 200 pg L−1 were observed when heterotrophic bacteria plate counts, total suspended volatile solids and total suspended solids in the snow were higher than 5.0 × 10⁵ CFU L−1, 25 mg L−1, and 90 mg L−1, respectively, pointing to the importance of microbes and solid particles in Hg transformation. This work from the Great Whale River area was also the first to report the existence of mercury methylation processes in the snow cover of low arctic tundra.
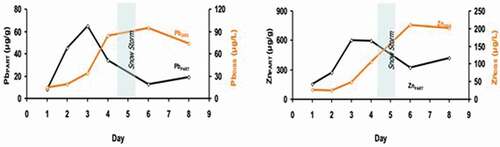
In 2013, Canário and other co-authors published results from a field work in the Kuujjuarapik area in a Polar review article led by Xavier et al. (Citation2013). These results included a summary of their analyses of inorganic contaminant data from the mouth of the Great Whale River showing that arsenic (601 ± 93 nM ice/414 ± 93 nM water), cadmium (5.2 ± 0.1 nM ice/7.9 ± 0.1 nM water), copper (4456 ± 1117 nM ice/1102 ± 409 nM water), and lead (362 ± 57 nM ice/265 ± 57 nM water) were higher than expected in such a pristine high-latitude environment. The authors found that some trace elements tended to accumulate on sea and river ice due to a higher affinity with organic matter. In this work, enrichment factors (Cice/Cwater) determined for these trace elements varied from 1.4 (As) to 4.0 (Cu) and, to our best knowledge, are the first reported values for these two types of samples. Based on these findings, Canário (in Xavier et al. Citation2013) hypothesized that during the ice melt season, these contaminants will accumulate in the water column, thereby increasing their availability to aquatic organisms. This hypothesis has been more recently tested in the Umiujaq River (100 km north of the Great Whale River) over a 10-day period when the river ice was melting and thinning (Canário and co-authors in Xavier et al. (Citation2013)). During the experiment, a large snowstorm occurred at day 5 and the melting process was reversed, with the formation of new ice. Results showed that Pb concentrations increased in the water column during the ice melt, with the opposite trend during new ice formation (). Similar results were obtained for Cu, Zn, Cd, Cr, and As. This is of environmental concern because these contaminants would then become bio-available for aquatic biota during the springtime bloom.
Figure 4. Evolution of the concentration of particulate (μg g−1) and dissolved (μg L−1) Pb and Zn during ice melt (first 5 days) and subsequent freeze-up in a Hudson Bay river to the north of the Great Whale River (Umiujaq River), late April 2009. Modified from Xavier et al. (Citation2013)
Organic matter export
Like many arctic and subarctic rivers, the Great Whale River carries more dissolved organic carbon (DOC) than particulate organic carbon (POC), and approximately 90% of the 111 × 103 t of organic carbon exported annually being is in the dissolved form (Hudon et al. Citation1996). This high export of DOC affects UV attenuation and photic depth in the coastal Hudson Bay (Laurion et al. Citation1997; Granskog et al. Citation2007) and constitutes a source of labile carbon for bacterial metabolism and the microbial food web. Moreover, after photochemical and microbial decomposition, the dissolved organic matter likely constitutes a source of bioavailable nitrogen to help sustain autotrophic production in Hudson Bay (Granskog et al. Citation2007).
The Great Whale River input of DOC may have implications far beyond the regional scale since most of the riverine DOC input to the Hudson Bay system (5.5 Tg C yr−1) was found to be exported out of Hudson Bay through Hudson Strait and towards the Labrador Sea and Newfoundland Shelf (a DOC export equals to 23% of that for the Arctic Ocean; Mundy et al. Citation2010). Hudon (Citation1994) estimated the output of organic carbon from the Great Whale River during ice breakup and reported that the river delivered 8.8 tons of coarse POM (particles larger than 500 µm, mostly wood, spruce needles and fragments of leaves).
Hudon (Citation1994) also showed that more than one billion insects (larvae, pupae and adults) were transported by the river to the sea during the spring melt period. The river drift of insects was greater during the night, as is often observed in flowing water systems, and a detailed list of taxa was obtained. These were of diverse habitats and feeding mechanisms (Table 4 in Hudon Citation1994), and included the black fly genus Prosimulium (Simulidae), which accounted for 43% of all individuals enumerated and identified, Plecoptera (26 taxa in 7 families), Ephemeroptera (21 taxa in 7 families), Trichoptera (12 taxa in 8 families) and chironomids.
The export of pyrogenic carbon (carbon residues derived from forest fires) was measured in the Great Whale River over the period March–June 2012 (Myers-Pigg et al. Citation2017). In this river, as in a comparative site in the Yenisei River in the Russian Arctic, peak export occurred during the spring freshet, and included the fire-marker levoglucosan in particulate phase.
Measurements of the 13C and 15N composition of the Great Whale River seston were consistent with the strong riverine influence on the coastal ocean (Retamal et al. Citation2007). The δ13C value of inshore marine particulate material in Hudson Bay approximated that of the Great Whale River, with only a slight decrease offshore. The river δ13C value was lower (−31.68‰) relative to terrigenous plant material (e.g., −27‰ for C3 plants; Kendall et al. Citation2001) suggesting an influence of other sources, such as freshwater phytoplankton and aquatic macrophytes, and was close to values previously obtained in the freshwaters of the James Bay area in northern Québec (mean δ13C value of −31.4‰; Montgomery et al. Citation2000).
Optical properties
The underwater irradiance regime of the Great Whale River is likely controlled by coloured dissolved organic matter (CDOM) and suspended particulates. Irradiance profiling in the river at Kuujjuarapik on 16 August 1995 (Rae and Vincent Citation1998a) gave attenuation coefficients of 13.1 m−1 for UVB (320 nm), 5.2 m−1 for UVA (380 nm) and 1.1 m−1 for photosynthetically available radiation (PAR, 400–700 nm), which translates to 1% surface irradiance levels at 0.35, 0.89 and 4.2 m, respectively. Some of the inflows to the ecosystem affected by soil erosion in permafrost wetlands contain higher levels of CDOM, notably the Kwakwatanikapistikw River () that discharges into the Great Whale River 15 km upstream from its mouth, and the Sasapimakwananistikw River (often misspelled in earlier publications) that discharges into Hudson Bay near the mouth of the Great Whale River (Figure 7 in Vincent et al. Citation2017).
The optical characteristics of CDOM have been analyzed in detail in the Great Whale River and adjacent Hudson Bay (Retamal et al. Citation2007). At the times of sampling (July–August, 2002), CDOM concentrations as measured by UV absorption at 320 nm dropped on average by 27% at an estuarine station and by 55% at an offshore Hudson Bay station relative to the riverine values (mean ± SE of 11.42 ± 0.18 m−1). This drop was a close linear function of salinity, implying that the decrease was due to simple dilution rather than flocculation or biological processes. Synchronous fluorescence (SFS) scans produced curves of similar shape at all stations, implying a relative constancy in the CDOM pool, and no differential loss of constituents. However, the SFS spectra were markedly different from those obtained in the same study from the Mackenzie River, another arctic river, but on the Beaufort Sea side of the Canadian Arctic. This difference appeared to reflect the maturity of the respective catchments, with the more recently deglaciated Great Whale River releasing younger, less degraded organic material, while the Mackenzie River receives DOC inputs from pre-aged, ancient soils (paleosols) that have experienced a long residence time within its drainage basin.
The spectral transmission properties of the river ice of Great Whale River were examined as part of a broader study on UV penetration through ice cover over high latitude aquatic ecosystems (Belzile et al. Citation2002). At the time of measurement (April), the irradiance transmission through 85 cm of clear ice overlaid by 5 cm of white ice (but cleared of snow) varied from 10% at 320 nm (UV) to 16% for PAR. Consistent with the observations from a wide range of other sites in that study, the ice had much lower concentrations of ions as well as of CDOM than in the underlying water. The results implied that dissolved materials are excluded from the ice during freeze-up, with greater exclusion of the CDOM molecules than the ions (exclusion factors of 16.9 and 4.4, respectively). As elsewhere, the DOC in the water (4.95 mg C L−1) was more coloured than in the ice (1.18 mg C L−1), implying the differential exclusion of larger more coloured organic molecules during ice formation.
Snow on ice has a major effect on solar radiation entering the water column: for 70 cm of sea ice at the mouth of the Great Whale River, under-ice PAR and UV (320 nm) increased by a factor of 2.7 and 3.4, respectively, after an overlying 2 cm layer of snow was removed ( in Vincent and Belzile Citation2003). These observations implied that climate change will have a major effect on underwater UV exposure by reducing the ice and snow cover, and the resultant increase would be much greater than that associated with moderate ozone depletion (Vincent et al. Citation2007). For example, Vincent and Belzile (Citation2003) calculated for a station located in the NOW Polynya covered with 0.6 m of ice and 2 cm of snow, that removal of ice and snow increased the underwater UV biological exposure weighted for DNA damage (T*DNA, Pienitz and Vincent Citation2000) by a factor of 22. In comparison, a moderate ozone depletion (from 330 to 230 DU) increased UV exposure by a factor of 2.3.
Microbial communities and macrophytes
Sea ice algae
Since 1976, several studies dealing with the ecology and physiology of sea ice algae and phytoplankton have been conducted in the southeastern Hudson Bay. These studies have been undertaken mostly during the spring when the sea ice cover still occurs (Legendre et al. Citation1981, Citation1987; Poulin et al. Citation1983; Gosselin et al. Citation1985, Citation1986, Citation1990; Rochet et al. Citation1985, Citation1986; Maestrini et al. Citation1986; Barlow et al. Citation1988; Michel et al. Citation1988, Citation1989, Citation1993; Runge and Ingram Citation1988, Citation1991; Demers et al. Citation1989; Ingram et al. Citation1989; Tremblay et al. Citation1989; Cota et al. Citation1991; Legendre and Gosselin Citation1991; Tourangeau and Runge Citation1991; Runge et al. Citation1991) and during the summer under ice free conditions (Legendre and Simard Citation1979; Legendre et al. Citation1982).
In April and May, unicellular algae colonize the base of the ice and the ice–water interface. Poulin and Cardinal (Citation1982a, Citation1982b, Citation1983) described 88 taxa from the ice algal assemblages of Manitounuk Sound. Overall, algal assemblages were usually dominated by pennate diatoms. Poulin et al. (Citation1983) studied the effects of a salinity gradient on the biomass and taxonomic composition of ice algae. Chl a concentrations at the ice bottom increased from the mouth of the Great Whale River to the upper reaches of Manitounuk Sound and from the river to Hudson Bay (Table 1 in Poulin et al. Citation1983). The number of taxa was also higher seaward the river plume than within the plume itself off the Great Whale River. Poulin et al. (Citation1983) concluded that salinity was a major environmental factor driving the large-scale distribution of ice algae.
Along the salinity gradient generated by the Great Whale River plume, the ice growth rate was the most important factor controlling the vertical and horizontal distributions of algal biomass and taxonomic composition in sea ice (Legendre and Gosselin Citation1991). The highest biomasses were usually associated with the lowest ice growth rates and probably lower grazing activities. In addition, the ice growth rate influenced the distribution of ice algal assemblages. In some cases, nitrogen limitation may have played a secondary role in this distribution.
The small-scale horizontal distribution of sea-ice microalgae was also investigated along 500 m long transects in the Manitounuk Sound and in the bay offshore of the river plume (Gosselin et al. Citation1986). The ice microalgae were distributed in patches of about 20 to 90 m in diameter. Variation in the thickness of the snow-ice cover, which determines irradiance at the bottom of the ice, was the factor controlling the algal biomass distribution. However, the relation between ice-algal biomass and snow-ice thickness changed over the season. At the beginning of the growing season (in April when the bottom-ice irradiance was higher than a minimum critical irradiance), maximum algal biomass was observed under areas covered by the smallest snow depths. Towards the end of the season, when light transmitted through the snow-ice cover increased, maximum algal biomass was observed under areas covered by the deepest snow. Hence, the horizontal heterogeneity of the snow-ice cover contributes to extend the growing season for sea-ice microalgae by providing bottom-ice habitats where irradiance is compatible with the photosynthetic limits of the cells.
The temporal variations of ice algae were studied in the Manitunouk Sound (Poulin et al. Citation1983; Gosselin et al. Citation1985) and the bay (Rochet et al. Citation1985; Michel et al. Citation1988, Citation1993; Demers et al. Citation1989; Gosselin et al. Citation1990) during the springtime. The net photosynthetic activity of ice algae starts when the light intensity at the ice–water interface reached 2–8 µmol photons m−2 s−1. Above such values, ice algae respond to the seasonal increase in irradiance by altering their photosynthetic characteristics (Gosselin et al. Citation1985; Rochet et al. Citation1986; Barlow et al. Citation1988; Michel et al. Citation1988). Following the light limitation period, ice-algal growth became nutrient-limited, when in situ irradiance and the accumulated algal biomass were high and the tidally driven nutrient supply was not strong enough to satisfy algal nutrient requirements (Maestrini et al. Citation1986; Demers et al. Citation1989; Gosselin et al. Citation1990). During the spring melt, the under-ice water temperature progressively increases, and salinity decreases, while the ice-algal biomass declines rapidly (Gosselin et al. Citation1985, Citation1990; Michel et al. Citation1988; Cota et al. Citation1991).
In the marine waters of southeastern Hudson Bay, the annual ice-algal production has been estimated to be around 6.5 g C m−2 (Gosselin et al. Citation1990). The above estimate is consistent with values in the literature. For example, Subba Rao and Platt (Citation1984) reviewed the relatively few production estimates for Arctic ice-algae and derived an annual average value of 10 g C m−2. In Resolute Passage, Smith et al. (Citation1988) estimated that the bottom ice algal production ranged from 3 and 23 g C m−2 during the springtime.
Phytoplankton in ice-covered waters
Several cases of phytoplankton blooms have been reported underneath the sea-ice cover in southeastern Hudson Bay (Legendre et al. Citation1981; Ingram et al. Citation1989; Tremblay et al. Citation1989; Runge et al. Citation1991). Legendre et al. (Citation1981) investigated the changes in under-ice Chl a concentrations in Manitounuk Sound and reported very low values (<0.2 µg L−1) from February to April. However, a phytoplankton bloom (ca. 1.5 µg Chl a L−1), composed of flagellates, occurred in freshwaters at the mouth of the Great Whale River in April. In May, chloropigments concentrations greatly increased from the mouth of the Great Whale River to the upper reaches of Manitounuk Sound (Figure 5 in Legendre et al. Citation1981). This bloom was mainly composed of the centric diatom Chaetoceros karianus and of the pennate diatom Navicula spp. Under-ice phytoplankton blooms by diatoms and the haptophyte Phaeocystis pouchetii are now recognized as a major feature occurring in subarctic and arctic waters (Ardyna and Arrigo Citation2020a; Ardyna et al. Citation2020b).
Several mechanisms have been proposed to explain these under-ice phytoplankton blooms: seeding of surface waters by microalgae released from melting ice, light use optimization by microalgae, and stabilization of the upper water column by low salinity meltwater. Studies in Manitounuk Sound suggested that the simultaneous deepening of both the euphotic zone (seasonal light increase) and the stratified layer (low-salinity melting water) likely caused under-ice phytoplankton blooms (Legendre et al. Citation1981). In ice-covered seas, algae released from the ice supplement those that grow in the water column, causing an increase in the number of cells under the melting ice.
In the waters off the Great Whale River plume, the release of the pennate diatom (Navicula pelagica) and centric diatoms (mainly Attheya septentrionalis, formerly Chaetoceros septentrionalis) from the sea ice during the melt period seems to initiate the under-ice phytoplankton bloom (Runge et al. Citation1991). The first bloom seems to be followed by the development of centric diatom species of the genera Chaetoceros and Thalassiosira not originating from the ice (Runge et al. Citation1991).
In the marine waters off Kuujjuarapik/Whapmagoostui, small celled algae (<5 µm) are responsible for a significant part of the total primary production (Robineau et al. Citation1994). Although these cells only represent 4% of total Chl a, they can reach concentrations of ca 32 µg L−1 at the ice–water interface (Legendre et al. Citation1987). These small algae could be directly used by the microfauna (protozoa, ciliates and flagellates) living at the ice–water interface in the Great Whale River plume. In turn, the large diatoms could be grazed by mesozooplankton (Calanus glacialis and Pseudocalanus minutus) and meiofauna that abound under the ice cover in May–June (Grainger Citation1988; Runge and Ingram Citation1988, Citation1991).
By means of sediment traps deployed 25 km off the Great Whale River mouth, Tremblay et al. (Citation1989) estimated that about 20% of the vernal primary production at the ice–water interface was exported towards the benthos in the form of intact algal cells (including chloroplasts) and zooplankton fecal pellets. About 30% of the ice-algal production was still suspended in the water column at the end of May. Therefore, about 50% of the ice-algal production could be consumed by pelagic herbivores.
Phytoplankton in open waters
The short-term effects of temperature on the Great Whale River freshwater phytoplankton were examined using 14C-bicarbonate incubations outdoor under natural solar light conditions (Rae and Vincent Citation1998b). Photosynthesis versus irradiance relationships (P-E curves) showed that temperature (five treatments from 5 °C to 25 °C) strongly regulated the photosynthetic response at saturating and inhibiting irradiances. Low temperatures lowered EK values (onset of light saturation) and shifted photosynthesis in the water column from light dependence to temperature dependence. Over the period late June to late August, the picoplankton (≤2 µm) fraction accounted for 40–50% of the total phytoplankton Chl a (1.2–1.6 µg L−1), and was dominated by picocyanobacteria according to examination by epifluorescence microscopy. This size fraction had greater photosynthetic rates at all temperatures than did the total and >2 µm communities. The picoplankton fraction was also more responsive to increasing temperature than larger cells, implying a greater sensitivity to diurnal or longer-term water temperature changes.
The spatial distribution of surface phytoplankton was investigated in southeastern Hudson Bay in August and September 1976 (Legendre and Simard Citation1979). The number of taxa identified was 33 in the coastal waters between Belcher Islands and the east coast of Hudson Bay and 54 in the Manitounuk Sound and at the mouth of the Great Whale River. The abundance varied between 826 and 7724 cells L−1 in the bay and between 4177 and 14,864 cells L−1 in the nearshore waters. In the near shore water, production and Chl a concentration ranged from 1.3 to 3.5 µg C L−1 h−1 and from 0.3 to 1.34 µg L−1, respectively. The authors suggested that the phytoplankton was nitrogen-limited at the end of the summer.
Legendre et al. (Citation1982) reported the variations of Chl a concentrations at the mouth of the Great Whale River and in Manitounuk Sound from mid-July through mid-September 1977. The distribution pattern of Chl a was similar to that observed in winter with increasing values away from Great Whale River mouth. The spatial pattern in Chl a concentrations was attributed to variations in the stability of the water column (Legendre et al. Citation1982). Contrary to the situation observed for phytoplankton in summer, ice microalgae were favored by increased nutrient supply during water column mixing periods (Gosselin et al. Citation1985, Citation1990; Demers et al. Citation1989; Ingram et al. Citation1989).
A station offshore the Great Whale River was sampled in early September 1993 (Harvey et al. Citation1997) and early October 2005 (Lapoussière et al. Citation2013). In 1993, the surface phytoplankton community was dominated by flagellates with a total abundance of 100 × 103 cells L−1 and a Chl a concentration of 1.5 µg L−1. In 2005, the phytoplankton production and Chl a biomass integrated over the euphotic zone were 263 mg C m−2 d−1 and 25 mg m−2, respectively. The production and biomass were both dominated by small cells (<5 µm). The sinking flux of POC at 50 m was 50 mg C m−2 d−1 and the export ratio (i.e., the ratio of sinking flux to primary production) was 0.19. These results indicate that the production and export of the Great Whale marine system is low to moderate in late summer compared to other stations in the Hudson Bay system (Lapoussière et al. Citation2013).
Microbial food webs
Like other aquatic ecosystems, the Great Whale River contains a well-developed microbial food web (Rae and Vincent Citation1998a); however, the network relationships among its diverse components have not been established. The river contains abundant picocyanobacteria, with summer concentrations in the range 1–4 × 10⁷ cells L−1, somewhat higher than values in the Mackenzie River in the western Canadian Arctic (5 × 10⁵ cells L−1, Vallières et al. Citation2008), and the phototrophic community contains a diverse assemblage of other taxa including chrysophytes, dinoflagellates, cryptophytes, green algae and diatoms. Populations of heterotrophic bacteria were around 109 L−1, an abundance typical of many rivers systems, and heterotrophic nanoflagellates and ciliates were also present in abundance (105 and 104 cells L−1, respectively).
Molecular studies are currently underway on the microbial diversity of the Great Whale River ecosystem. These have revealed a diverse bacterial assemblage dominated by taxa in the Burkholderiales, but with numerous rare taxa, and evidence that microbial community richness increases down the river (Blais et al. In press). Like other river systems discharging into Hudson Bay, the estuarine transition zone of the Great Whale River contains a distinctive community of microbial eukaryotes, including the photosynthetic ciliate Mesodinium rubrum (Jacquemot et al. Citation2021). The river contains highly variable concentrations of the greenhouse gases methane and carbon dioxide (Matveev et al. Citation2020), implying variable rates of decomposition and methanogenesis, or variable effects of sediment and ground water exchanges as well as ventilation to the atmosphere by waterfalls and rapids, but none of these processes have been measured directly to date.
A 6-day growth experiment was conducted in summer to evaluate the response of microbial foodweb structures to changes in ambient temperature and ultraviolet radiation (Rae and Vincent Citation1998a). The total bacterial community showed no net response to temperature, but the percentage of actively respiring bacteria was up to 57% higher at 20°C relative to 10°C. Chl a concentrations in the picocyanobacterial size fraction also reacted strongly to temperature, with a 61% increase over this temperature range. In contrast, removing the exposure to natural levels of solar UV radiation had little effect on the microbial communities over this incubation period.
Marine macrophytes
Data on the taxonomic composition and distribution of macrophytobenthic communities in the Great Whale River ecosystem is very limited. Breton-Provencher and Cardinal (Citation1978) reported the occurrence of 10 species of Chlorophyceae, 27 Phaeophyceae and 10 Rhodophyceae in Manitounuk Sound with Fucus distichus as the dominant species. These authors also suggest an overall low phytobenthic biomass (low macrophytobenthos coverage) and diversity within Manitounuk Sound, but this requires more extensive surveying to confirm. The low phytobenthic biomass may be related to the substrate, the topography and the occurrence of sea ice and physical-chemical factors affecting the fixation and development of macrophytobenthic species. A low benthic primary productivity could be related to the persistent ice that covers Manitounuk Sound for at least 6 months each year and reducing the light available for photosynthesis.
Sympagic, pelagic and benthic consumers
Sea ice fauna communities
Ice fauna have been much less studied compared to its ice flora counterpart. The only published data on sea ice fauna of southeastern Hudson Bay are those of Grainger (Citation1988), who assessed the effects of the Great Whale River plume on the composition and abundance of meiofauna in the lowermost 3 cm of sea ice. Meiofauna predominantly inhabited the bottom layers of the sea ice and were comprised of both permanent and temporary residents. In this paper, Grainger (Citation1988) reported the occurrence of five major animal taxa in the sea ice over the plume and in the ice outside the plume. Copepod composition was assessed in the sea ice over and outside the plume and revealed the occurrence of Oithona similis and Tisbe furcata in the former and Harpacticus superflexus, Tisbe furcata and Halectinosoma sp. in the latter. The total abundance of the sea ice meiofauna ranged from 8 to 9 568 ind. L−1 at the sampling stations. Nematodes were the most numerous individuals in the ice over and outside the plume, followed by rotifers, ciliates and copepods. Overall, the mean total meiofauna abundance within the ice over the plume was 373 L−1 and in the offshore ice outside the plume 8 823 L−1.
Sea ice is known to be an environment of limited and patchily distributed food sources (Poltermann Citation1998), hence food availability is likely to be one of the main factors influencing sea ice meiofauna abundance and biomass. Interestingly, Grainger (Citation1988) observed a significant increase in the abundance of meiofauna in response to the increased sea ice algae abundance and assumed that increase was a response to the food sources. Along the same lines, meiofauna abundance correlated well with salinity. Grainger (Citation1988) concluded that salinity may control the quantity and the quality of the sea ice meiofauna either through a direct influence on animals or through its effect on food or on the physical quality of the ice habitat. He reported a much lower sea ice meiofaunal biomass, inside the Great Whale River plume and proposed that the winter expansion of the river plume could decimate the standing stock of sea ice fauna. Thus, interannual variability in river plume extent could generate large year to year variations in the standing stocks of sea ice fauna.
Zooplankton
Zooplankton studies have covered a variety of topics, including basic community structure surveys (Rochet and Grainger Citation1988; Drolet et al. Citation1991; Ponton and Fortier Citation1992), reproduction (Drolet et al. Citation1991; Tourangeau and Runge Citation1991), and migration patterns and feeding ecology (Runge and Ingram Citation1988; Runge et al. Citation1991, Citation1991). These studies have been undertaken within the salinity gradient associated with the Great Whale River plume and offshore waters of southeastern Hudson Bay, beyond the Great Whale River freshwater plume.
Rochet and Grainger (Citation1988) studied the zooplankton community structure in the eastern part of Hudson Bay and reported the occurrence of Calanus glacialis, Tisbe, and Acarina within the area of Great Whale River plume. Drolet et al. (Citation1991) surveyed the seasonal variations in micro- and mesozooplankton composition off Kuujjuarapik before and after the ice break up in the region covering the salinity gradient associated with the Great Whale River plume. Zooplankton assemblages were dominated in abundance and diversity by copepods (Table 1 in Drolet et al. Citation1991). The microzooplankton was almost exclusively composed of copepod eggs and nauplii. The mesozooplankton community was composed of few taxa, with four species (the copepods Oithona similis, Onca borealis, Pseudocalanus spp., and Microcalanus pygmaeus) accouting for >95% of total numerical abundance. Finally, the macrozooplankton community was composed of the chaetognath Sagitta elegans, Cnidaria and Ctenaria, Polychaeta and Amphipoda, all of them exhibiting low abundances. Maximum copepod eggs and nauplii abundances were in southeastern Hudson Bay in late May and June (Drolet et al. Citation1991). These peaks have been attributed to higher algal biomass in the deeper saline water layer. This suggests that increased reproduction by copepods after the ice break up is related to the spring phytoplankton bloom (but see Runge et al. (Citation1991) for the importance of ice algae for zooplankton feeding).
Carbon fluxes and zooplankton
The flux of algal material from sea ice into the water column is known to be an important food source for the pelagic herbivorous community. In southeastern Hudson Bay, Drolet et al. (Citation1991) showed that Calanus glacialis, Pseudocalanus spp., and Oithona similus reproduced under the ice before the phytoplankton bloom and fed on sedimenting ice algae. Runge et al. (Citation1991) provided convincing results showing trophic interactions between ice algae and metazoan zooplankton in southeastern Hudson Bay. Copepod species such as Calanus glacialis and Pseudocalanus spp. have been reported feeding at the ice-water interface. By means of gut content analyses, Runge and Ingram (Citation1988,, Citation1991) provided evidence of sea ice algal grazing by copepods by observing fragments of ice diatoms. This was further supported by Runge et al. (Citation1991) who showed an increase in pheopigment concentrations within the copepods gut after their migration upward the ice water interface during the night. The active exploitation of ice–water interface and water column microalgae during spring by copepod species, such as Calanus glacialis, Pseudocalanus minutus and Metridia longa (Runge and Ingram Citation1988, Citation1991; Runge et al. Citation1991) allows them to start their reproduction before the summer phytoplankton bloom (Tourangeau and Runge Citation1991). The resulting early production of eggs and nauplii of copepods generates favourable feeding conditions for larval fish that emerge in spring in southeastern Hudson Bay (Runge et al. Citation1991).
Lalande and Fortier (Citation2011) reported POC fluxes obtained from October 2005 to August 2007 at a mooring located 15 km from the mouth of the Great Whale River. Sediment traps located a 100 m, 36 m above the sea floor, showed that most of the export in southeastern Hudson Bay occurred during fall and was largely associated with resuspension of settled particles due to strong currents. Although the Great Whale River exported 2.1 × 10⁴ tons of particulate organic matter annually, it contributed little to the fluxes measured at the mooring site because the Great Whale River plume did not reach the sediment trap site (Lalande and Fortier Citation2011). They also reported the collection of a very large quantity of the jellyfish Aglantha digitale in the sediment trap deployed from September to December 2006 and in July and August 2007 (up to 12 × 103 ind. m−2 d−1). Because A. digitale biomass is positively correlated with temperature, Lalande and Fortier (Citation2011) suggested that the collection of such large quantity of A. digitale could indicate an increased frequency of jellyfish blooms in southeastern Hudson Bay linked to environmental changes occurring in the region.
Fish
The published scientific information on fish in the Great Whale River ecosystem is limited but covers a variety of topics, including basic ichthyofaunal surveys (Morin et al. Citation1980; Morin and Dodson Citation1986; Kemp et al. Citation1989; Hudon Citation1994) and larval fish ecology (Drolet Citation1990; Drolet et al. Citation1991; Gilbert Citation1991; Gilbert et al. Citation1992; Ponton and Fortier Citation1992; Ponton et al. Citation1993; Fortier et al. Citation1995, Citation1996). Studies on early life history stages of fish have focused on their distribution (Runge et al. Citation1991; Gilbert et al. Citation1992; Ponton and Fortier Citation1992; Ponton et al. Citation1993; Hudon Citation1994), production and survival (Drolet et al. Citation1991), and feeding ecology (Gilbert et al. Citation1992; Fortier et al. Citation1995, Citation1996), in relation to light and food availability under the ice cover. The following is a summary of the most relevant findings from these studies.
Ichthyofaunal surveys have been undertaken by Morin et al. (Citation1980) who described the composition of fish communities of the estuarine part of the Great Whale River. Overall, they reported a total of 18 fish species, belonging to 11 families, of which four species are considered as freshwater species occasionally entering brackish waters, seven species are diadromous species, and seven species are marine fishes that use the estuary as a nursery ground (Table 3 in Morin et al. Citation1980). Fish communities were dominated by Salmonidae, Catastomidae, and Cottidae. Kemp et al. (Citation1989) documented the relative abundance of Salmonidae at the mouth of the Great Whale River after the ice break up and found similar relative abundances of coregonine fish (see Table 6 in their paper) to those reported by Morin et al. (Citation1980). Hudon (Citation1994) reported the occurrence of adult sticklebacks (Gaserosteus aculeatus and Pungitius pungitius) in, and underneath, the river plume after the ice break up.
Studies on fish in the Great Whale River and offshore waters of southeastern Hudson Bay have mostly concerned eggs and larvae (ichthyoplankton). Hudon (Citation1994) documented the ichthyoplankton species composition within the plume and in the Great Whale River during ice break up. In the river drift, ichthyoplankton were overwhelmingly composed of burbot (Lota lota) larvae (94% of fish larvae) followed, sporadically, by coregonid larvae (6% of fish larvae). This led Hudon (Citation1994) to estimate that around five million burbot larvae drifted into Hudson Bay during the study period. Within the river plume, ichthyoplankton were represented mostly by Arctic cod (Boreogadus saida) and sand lance (Ammodytes spp.) larvae, followed in smaller numbers by capelin (Mallotus villosus), stichaeid, cottid, and unidentified gadid larvae.
Ponton et al. (Citation1993) investigated the occurrence and distribution of fish larvae in and around the Great Whale River plume before, during, and after ice break up over a three-year period. They reported the occurrence of 21 larval fish species belonging to 12 families (Table 2 in Ponton et al. Citation1993). Among fish larvae, Arctic cod (B. saida) and sand lance (Ammodytes spp.) were particularly abundant, reaching 50.4% and 37.9% of the total abundance, respectively. The larval emergence from 56% of the fish taxa occurred before the ice break up in southeastern Hudson Bay in June. The distribution of the fish larvae of freshwater, anadromous, and marine origins was affected by the Great Whale River plume. For instance, coregonid (Coregonus clupeaformis and C. artedii) and burbot (L. lota) larvae were confined to fresh or brackish waters of the Great Whale River or its plume. Arctic shanny (Stichaeus punctatus), sculpins (Myoxocephalus spp. and Gymnocanthus tricuspis), and capelin (M. villosus) were more abundant in waters exhibiting salinities between 1 and 25 while arctic cod (B. saida), sand lance (Ammodytes spp.), slender eelblenny (Lumpenus fabricii), and gelatinous snailfish (Liparis fabricii) larvae reached highest densities in salinity waters exceeding 25.
By means of intensive sampling (i.e., 48-hour sampling), Ponton and Fortier (Citation1992) described the vertical distribution and abundance of fish larvae under the ice cover in and outside the Great Whale River plume. In their paper, Table 2 summarizes the available quantitative information on ichthyoplankton at these stations. Arctic cod (B. saida) and sand lance (Ammodytes sp.), represented by yolk-sac larvae and first-feeding post yolk-sac larvae were the most abundant larvae. They also showed that, under the ice cover, Arctic cod (B. saida) and sand lance (Ammodytes sp.) larvae tended to accumulate near the pycnocline, immediately beneath the plume, where feeding conditions were favourable in terms of prey abundance and light intensity.
Drolet et al. (Citation1991) surveyed the seasonal variations in larval fish composition and abundance during spring off Kuujjuarapik in southeastern Hudson Bay with the aim of relating them to the algal production and copepods reproduction. They documented the occurrence of 14 species within the ichthyoplankton assemblage (Table 2 in Drolet et al. Citation1991). Among them, 11 were of marine origin, two were anadromous species and one species was of freshwater origin. Two species, sand lance (Ammodytes spp.) and Arctic cod (B. saida), accounted for >70% of the total number caught and hatched before the ice break up. Larvae and postlarvae of Arctic cod and sand lance occurred throughout the sampling period, but their densities decreased after the ice break up in waters, which were weakly stratified due to increased wind mixing.
Drolet et al. (Citation1991) also investigated the feeding ecology of the most abundant fish larval species collected at stations spread along the salinity gradient associated to the Great Whale River plume. All but Arctic shanny larvae fed mainly on copepod eggs, copepod nauplii and copepodites (Table 3 in Drolet et al. Citation1991). Among fish larvae, sand lance (Ammodytes sp.) and Arctic cod (B. saida) fed almost exclusively on copepod eggs and nauplii. Arctic shanny (Stichaeus punctatus) larvae preyed mostly on rotifers and euphausiid nauplii while burbot (L. lota) larvae did not feed. The period following yolk sac resorption was accompanied by starvation for Arctic cod and sand lance larvae, and this period was synchronized with peak abundance of prey. Ponton and Fortier (Citation1992) studied the diet and feeding behavior of Arctic cod (B. saida) and sand lance (Ammodytes sp.) larvae under the ice cover, in and outside the Great Whale River plume. Gut content analyses showed that both larval species had a diet mostly composed of copepod nauplii and, to a lesser extent, copepod eggs (Table 3 in Ponton and Fortier Citation1992). Feeding success/efficiency of first feeding Arctic cod (B. saida) and sand lance (Ammodytes sp.) larvae was reduced within the plume due to light attenuation caused by the turbid surface layer. Gilbert et al. (Citation1992) also showed that the feeding of these larval species was affected by the Great Whale River plume. Larvae of Arctic cod (B. saida) and sand lance (Ammodytes sp.) avoided the freshwater surface layer and did not feed. After ice break-up and irradiance conditions improved in the upper water column, larval nutrition was no longer limited, and Arctic cod and sand lance larvae could feed intensively (Gilbert et al. Citation1992). Fortier et al. (Citation1996) showed that the survival of Arctic cod larvae depended on the time synchronization between the production of larvae and their prey (i.e. the match-mismatch concept). In addition, Arctic cod larval feeding success was mainly determined by the thickness of the river plume, which affects the density of prey and the irradiance conditions in upper waters (Fortier et al. Citation1995).
Marine macrobenthos
There is virtually no available published information on the macrobenthos of the Great Whale River ecosystem. Legendre (Citation1977) reported the occurrence of 38 species of macroinvertebrates (mainly represented by Pelecypoda and Polychaeta) at deep stations within Manitounuk Sound (see Table 5 in Legendre’s report). Atkinson and Wacasey (Citation1989) identified 18 macroinvertebrate species (most of them belonging to Arthropoda and Echinodermata) at a station located within Manitounuk Sound at 90 m depth (Table 63 in their report). However, this low survey effort may have produced a biased picture of the real number of macrobenthic invertebrates in this area. Cusson et al. (Citation2007) compiled macroinvertebrate data for Hudson Bay and reached a total of 167 taxa. In a more recent study, Piepenburg et al. (Citation2011) compiled observations for the same area, giving a total of 463. Furthermore, Pierrejean et al. (Citation2020) found a total of 380 epibenthic taxa identified which represents 71% of the estimated taxa within the Hudson Bay. Finally, Wei et al. (Citation2020) identified the Hudson Complex (including James Bay) as one of the six hotspots of diversity among the 13 ecoregions around Canada. These four studies support the conclusion that the survey effort in the marine component of Great Whale River ecosystem is far too small to indicate that this area has a low number of macroinvertebrate species. To our knowledge, the river benthos is almost completely unknown, apart from the collection of insect larvae in the drift samples (Hudon Citation1994; see above).
Marine mammals
As reported by Kemp (Citation1983), ringed seals (Pusa hispida) and bearded seals (Erignathus barbatus) are the main marine mammal species found in Manitounuk Sound and the Great Whale River estuary. The village name Whapmagoostui means ‘place of the beluga’ in Cree, and the name Great Whale River also indicates the importance of beluga whales (Delphinapterus leucas) in this region (Smith and Hammill Citation1986). Breton-Provencher (Citation1979) reported the occurrence of belugas in the Great Whale River estuary during summer, but it no longer appears to be a common habitat for this species (Hammill et al. Citation2004). Polar bears (Ursus maritimus) have been occasionally sighted near and even within the village of Kuujjuarapik (P. Roussel, personal communication, 2016).
The Great Whale River ecosystem and global change
The Great Whale River ecosystem is already experiencing the impacts of climate warming and development, as observed throughout the Hudson Bay system (Kuzyk and Candlish Citation2019). This dual set of impacts is likely to continue and even accelerate in the future, with ongoing global change and increased transport links. For example, the possibility of a road link from Whapmagoostui-Kuujjuarapik to the south would bring socio-economic benefits as well as costs, and a new set of environmental stresses on the aquatic habitats of the Great Whale River ecosystem. There is evidence of climate-related changes even in the morphometry and sediment loading of the Great Whale River, which could have wide-ranging effects on the freshwater as well as marine biota. Analysis of repeat aerial photographs shows changes in river channel constrictions over the period 1969–2019, suggesting increased landslide activity and mobilization of fine sediments that may be linked to an increase in summer extreme rainfall events (Owczarek et al. Citation2020) and a massive landslide occurred 8 km upstream from the river mouth in April 2021. Meeting the challenges of these multiple stressors will require an integrated ecosystem-based management strategy, an approach that aims to maintain ecosystems in a productive, healthy, and resilient condition so they can continue to provide services to meet human needs (Rosenberg et al. Citation2005) as well as sustain intrinsic values such as habitat integrity.
This review underscores the need to fill major gaps in understanding about the Great Whale River ecosystem, especially for its freshwater tributaries and the main stem of the river, from its source lakes downstream. Studies on subarctic rivers elsewhere provide models for research and monitoring that would be usefully applied to the Great Whale River; for example, river ice time-series analysis in other Canadian subarctic rivers (Chen and She Citation2020); hydrological modelling of the Nelson River on the opposite side of Hudson Bay (Lilhare et al. Citation2020); geochemical survey approaches as applied to rivers in western Siberia (Krickov et al. Citation2020); and biological surveys across multiple trophic levels in Arctic rivers (Lento et al. Citation2020). The integrated water quality and fisheries monitoring program for subarctic River Teno in Finland (called River Tana in Norwegian and River Deatnu in Sami), at the border between northern Norway and Finland, provides the ultimate example of how such fluvial systems can be closely studied, monitored and managed (Gundersen et al. Citation2019), although in that case benefitting from the combined resources of two nations and the European Union.
Like the Great Whale River, the River Tana is a site of traditional fishing (Hiedanpää et al. Citation2020), and local Indigenous knowledge is a key element that should be incorporated into subarctic river management. Rich traditional cultures based on river fishing and hunting are well known from other high latitude sites including Siberia (Lavrillier and Gabyshev Citation2021), western Canada (Proverbs et al. Citation2020) and Alaska (Voinot-Baron Citation2020), and Indigenous perspectives from the Cree First Nation and Inuit of the Great Whale River region should be fully integrated into planning, research, monitoring and management of its extensive watershed and coastal waters. This would be in line with the increasing recognition of the importance of knowledge co-production and co-management (Johnson et al. Citation2020), and the general move at a multinational, circumpolar level towards incorporating Indigenous knowledge in northern policies (Vincent Citation2020).
The Great Whale River ecosystem is likely experiencing cumulative impacts that need to be assessed in a long-term context, as in other parts of the world (Halpern et al. Citation2008). As shown here, most of the research to date in the Great Whale River region has been localized and piecemeal, with temporal and spatial scales of analysis that are too small to properly guide management at the ecosystem scale. There is a need for an improved understanding of biodiversity in the region for example, although the requisite expertise is limited in Canada and elsewhere (Archambault et al. Citation2010), and contaminant studies are conspicuously lacking despite past evidence of unexpectedly high levels. There is now the opportunity to build on the studies described here, and to develop an ecosystem approach to preserve and manage the resources, functions and biodiversity of the Great Whale River ecosystem.
Disclosure of potential conflicts of interest
No potential conflict of interest was reported by the author(s).
Acknowledgments
This review is a contribution to the project Terrestrial Multidisciplinary distributed Observatories for the Study of Arctic Connections (T-MOSAiC) under the auspices of the International Arctic Science Committee (IASC). We thank Marie-Andrée Roy for making the maps. We are very grateful for the review and comments by three anonymous reviewers.
Additional information
Funding
Related Research Data
References
- Adamou TY, Riva M, Muckle G, Sidi EA, Lemire M, Ayotte P. 2020. Blood mercury and plasma polychlorinated biphenyls concentrations in pregnant Inuit women from Nunavik: temporal trends, 1992–2017. Sci Tot Environ. 743:140495. doi:https://doi.org/10.1016/j.scitotenv.2020.140495.
- Allard M, Seguin MK. 1987. Le pergélisol au Québec nordique: bilan et perspectives. Géographie physique et Quaternaire. 41:141–152. doi:https://doi.org/10.7202/032671ar.
- Archambault P, Snelgrove PVR, Fisher JAD, Gagnon JM, Garbary DJ, Harvey M, Kenchington EL, Lesage V, Lévesque M, Lovejoy C, et al. 2010. From sea to sea: Canada’s three oceans of biodiversity. PLoS One 5(8):e12182. doi:https://doi.org/10.1371/journal.pone.0012182.
- Ardyna M, Arrigo KR. 2020. Phytoplankton dynamics in a changing Arctic Ocean. Nature Clim Change. 10:892–903. doi:https://doi.org/10.1038/s41558-020-0905-y.
- Ardyna M, Mundy CJ, Mills MM, Oziel L, Grondin PL, Lacour L, Verin G, van Dijken G, Ras J, Alou-Font E, et al. 2020. Environmental drivers of under-ice phytoplankton bloom dynamics in the Arctic Ocean. Elem Sci Anth. 8:30. doi:https://doi.org/10.1525/elementa.430.
- Atkinson EG, Wacasey JW 1989. Benthic invertebrates collected from Hudson Bay, Canada, 1953 to 1965. Canadian Data Report of Fisheries and Aquatic Sciences No. 744. 125 p.
- Barlow RG, Gosselin M, Legendre L, Therriault JC, Demers S, Mantoura RFC, Llewellyn CA. 1988. Photoadaptative strategies in sea-ice microalgae. Mar Ecol Prog Ser. 45:145–152. doi:https://doi.org/10.3354/meps045145.
- Belzile C, Gibson JAE, Vincent WF. 2002. Colored dissolved organic matter and dissolved organic carbon exclusion from lake ice: implications for irradiance transmission and carbon cycling. Limnol Oceanogr. 47:1283–1293. doi:https://doi.org/10.4319/lo.2002.47.5.1283.
- Bhiry N, Delwaide A, Allard M, Bégin Y, Filion L, Lavoie M, Nozais C, Payette S, Pienitz R, Saulnier-Talbot É, et al. 2011. Environmental change in the Great Whale River region, Hudson Bay: five decades of multidisciplinary research by Centre d’études nordiques (CEN). Écoscience. 18(3):182–203. doi:https://doi.org/10.2980/18-3-3469.
- Blais MA, Matveev A, Lovejoy C, Vincent WF. 2021. Salinity and dissolved organic carbon drive microbial community structure in a subarctic river system and its transition zone to the sea. In: Canário J, Vieira G, Pina P, Baptista J, Folhas D, Freitas P, Miranda V, David A, editors. ASSW2021 Science Conference Book of Abstracts. Lisbon: IASC; p. 446.
- Breton-Provencher M 1979. Étude de la population de bélugas de la région de Poste-de-la-Baleine (Nouveau-Québec). GIROQ, projet Grande Baleine, études océanographiques dans la baie d’Hudson. Mandat d’avant-projet préliminaire Hydro-Québec/OGB 76−1.
- Breton-Provencher M, Cardinal A. 1978. Les algues benthiques des baies James et d’Hudson: État actuel des connaissances et nouvelles données sur les parties méridionales de ces régions. Naturaliste canadien. 105:277–284.
- Brzezinski MA. 1985. The Si:C:N ratio of marine diatoms: interspecific variability and the effect of some environmental variables. J Phycol. 21:347–357. doi:https://doi.org/10.1111/j.0022-3646.1985.00347.x.
- Chen Y, She Y. 2020. Long-term variations of river ice breakup timing across Canada and its response to climate change. Cold Reg Sci and Technol. 176:103091. doi:https://doi.org/10.1016/j.coldregions.2020.103091.
- Commission de toponymie. 2020. Grande rivière de la Baleine. Gouvernement du Québec. accessed 2020 Nov 22. http://www.toponymie.gouv.qc.ca/ct/ToposWeb/Fiche.aspx?no_seq=3224
- Constant P, Poissant L, Villemur R, Yumvihoze E, Lean D. 2007. Fate of inorganic mercury and methyl mercury within the snow cover in the low arctic tundra on the shore of Hudson Bay (Québec, Canada). J Geophys Res. 112:D08309. doi:https://doi.org/10.1029/2006JD0079612007.
- Cota GF, Legendre L, Gosselin M, Ingram RG. 1991. Ecology of bottom ice algae: I. Environmental controls and variability. J Mar Syst. 2:257–277. doi:https://doi.org/10.1016/0924-7963(91)90036-T.
- Cusson M, Archambault P, Aitken A. 2007. Biodiversity of Arctic continental shelf benthic assemblages: historical data from the Canadian Arctic. Mar Ecol Prog Ser 331:291–304. doi:https://doi.org/10.3354/meps331291.
- Demers S, Legendre L, Maestrini SY, Rochet M, Ingram RG. 1989. Nitrogenous nutrition of sea-ice microalgae. Polar Biol. 9:377–383. doi:https://doi.org/10.1007/BF00442528.
- Déry SJ, Stadnyk TA, MacDonald MK, Gauli-Sharma B. 2016. Recent trends and variability in river discharge across northern Canada. Hydrol Earth Syst Sci 20:2540–2557. doi:https://doi.org/10.5194/hess-20-4801-2016.
- Déry SJ, Stieglitz M, McKenna EC, Wood EF. 2005. Characteristics and trends of river discharge into Hudson, James, and Ungava Bays, 1964–2000. J Clim 18:4801–4818. doi:https://doi.org/10.1175/JCLI3440.1.
- Drinkwater KF, Mueter FJ, Saitoh SI. 2018. Shifting boundaries of water, ice, flora, fauna, people, and institutions in the Arctic and Subarctic. ICES J Mar Sci. 75:2593–2598. doi:https://doi.org/10.1093/icesjms/fsy179.
- Drolet R 1990. Cycle de production des larves de poissons et de leur ressource en milieu sub-arctique (baie d’Hudson). MSc thesis. Québec: Université Laval. 71.
- Drolet R, Fortier L, Ponton D, Gilbert M. 1991. Production of fish larvae and their food resource in subarctic southeastern Hudson Bay. Mar Ecol Prog Ser. 77:105–118. doi:https://doi.org/10.3354/meps077105.
- Dynesius M, Nilsson C. 1994. Fragmentation and flow regulation of river systems in the northern third of the world. Science 266:753–762. doi:https://doi.org/10.1126/science.266.5186.753.
- Dewailly É, Ayotte P, Bruneau S, Lebel G, Levallois P, Weber JP. 2001. Exposure of the Inuit population of Nunavik (Arctic Quebec) to lead and mercury. Arch Environ Health. 56:350–357. doi:https://doi.org/10.1080/00039890109604467.
- Dewailly É, Nantel A, Weber JP, Meyer F. 1989. High levels of PCBs in breast milk of Inuit women from arctic Quebec. Bull Environ Contam Toxicol 43:641–646. doi:https://doi.org/10.1007/BF01701981.
- Fortier L, Gilbert M, Ponton D, Ingram RG, Robineau B, Legendre L. 1996. Impact of freshwater on a subarctic coastal ecosystem under seasonal sea ice (southeastern Hudson Bay, Canada). III. Feeding success of marine fish larvae. J Mar Syst. 7:251–265. doi:https://doi.org/10.1016/0924-7963(95)00005-4.
- Fortier L, Ponton D, Gilbert M. 1995. The match/mistmatch hypothesis and the feeding success of fish larvae in ice-covered southeastern Hudson Bay. Mar Ecol Prog Ser. 120:11–27. doi:https://doi.org/10.3354/meps120011.
- Gilbert M 1991. Distribution et nutrition des stades larvaires de poissons du sud-est de la baie d’Hudson: influence du couvert de glace sur la disponibilité de la lumière et des proies. MSc thesis. Québec: Université Laval. 76.
- Gilbert M, Fortier L, Ponton D, Drolet R. 1992. Feeding ecology of marine fish larvae across the Great-Whale River plume in seasonally ice-covered southeastern Hudson Bay. Mar Ecol Prog Ser 84:19–30. doi:https://doi.org/10.3354/meps084019.
- Gosselin M, Legendre L, Demers S, Ingram RG. 1985. Responses of sea-ice microalgae to climatic and fortnightly tidal energy inputs (Manitounuk Sound, Hudson Bay). Can J Fish Aquat Sci 42:999–1006. doi:https://doi.org/10.1139/f85-125.
- Gosselin M, Legendre L, Demers S, Therriault JC. 1990. Light and nutrient limitation of sea-ice microalgae (Hudson Bay, Canadian Arctic). J Phycol 26:220–236. doi:https://doi.org/10.1111/j.0022-3646.1990.00220.x.
- Gosselin M, Legendre L, Therriault JC, Demers S, Rochet M. 1986. Physical control of the horizontal patchiness of sea-ice microalgae. Mar Ecol Prog Ser 29:289–298. doi:https://doi.org/10.3354/meps029289.
- Grainger EH. 1988. The influence of a river plume on the sea-ice meiofauna in south-eastern Hudson Bay. Estuar Coast Shelf Sci 27:131–141. doi:https://doi.org/10.1016/0272-7714(88)90086-8.
- Granskog MA, Macdonald RW, Mundy CJ, Barber DG. 2007. Distribution, characteristics and potential impacts of chromophoric dissolved organic matter (CDOM) in Hudson Strait and Hudson Bay, Canada. Cont Shelf Res 27:2032–2050. doi:https://doi.org/10.1016/j.csr.2007.05.001.
- Gundersen CB, Ø K, Sample JE, Braaten HFV, Selvik JR, Dø H, Norling MD, Guerrero JL 2019. The Norwegian river monitoring programme–water quality status and trends in 2018. NIVA-rapport. 117 p. Accessed at: accessed 2021 Mar 30. Available from: https://niva.brage.unit.no/niva-xmlui/handle/11250/2652201.
- Halpern BS, Walbridge S, Selkoe KA, Kappel CV, Micheli F, D’agrosa C, Bruno JF, Casey KS, Ebert C, Fox HE, et al. 2008. A global map of human impact on marine ecosystems. Science 319:948–952. doi:https://doi.org/10.1126/science.1149345.
- Hammill MO, Lesage V, Gosselin J-F, Bourdages H, de March BGE, Kingsley MCS. 2004. Evidence for a decline in Northern Quebec (Nunavik) belugas. Arctic 57:183–195. doi:https://doi.org/10.14430/arctic494.
- Harvey M, Therriault JC, Simard N. 1997. Late-summer distribution of phytoplankton in relation to water mass characteristics in Hudson Bay and Hudson Strait (Canada). Can J Fish Aquat Sci. 54:1937–1952. doi:https://doi.org/10.1139/f97-099.
- Hiedanpää J, Saijets J, Jounela P, Jokinen M, Sarkki S. 2020. Beliefs in conflict: the management of Teno Atlantic salmon in the Sámi homeland in Finland. Environ Manage 66:1039–1058. doi:https://doi.org/10.1007/s00267-020-01374-6.
- Hudon C. 1994. Biological events during ice breakup in the Great Whale River (Hudson Bay). Can J Fish Aquat Sci 51:2467–2481. doi:https://doi.org/10.1139/f94-246.
- Hudon C, Morin R, Bunch J, Harland R. 1996. Carbon and nutrient output from the Great Whale River (Hudson Bay) and a comparison with other rivers around Quebec. Can J Fish Aquat Sci 53:1513–1525. doi:https://doi.org/10.1139/f96-080.
- Hunt GL Jr, Drinkwater KF. 2005. Ecosystem Studies of Sub-Arctic Seas (ESSAS) Science Plan. GLOBEC Report. 19(viii):60.
- Ingram RG. 1981. Characteristics of the Great Whale River plume. J Geophys Res 86:2017–2023. doi:https://doi.org/10.1029/JC086iC03p02017.
- Ingram RG, Larouche P. 1987. Variability of an underice river plume in Hudson Bay. J Geophys Res 92:9541–9548. doi:https://doi.org/10.1029/JC092iC09p09541.
- Ingram RG, Osler JC, Legendre L. 1989. Influence of internal wave induced vertical mixing on ice algal production in a highly stratified sound. Estuar Coast Shelf Sci 29:435–446. doi:https://doi.org/10.1016/0272-7714(89)90078-4.
- Ingram RG, Wang J, Lin C, Legendre L, Fortier L. 1996. Impact of freshwater on a subarctic coastal ecosystem under seasonal sea ice (southeastern Hudson Bay, Canada). I. Interannual variability and predicted global warming influence on river plume dynamics and sea ice. J Mar Syst. 7:221–231. doi:https://doi.org/10.1016/0924-7963(95)00006-2.
- Jacquemot L, Kalenitchenko D, Matthes LC, Vigneron A, Mundy CJ, Tremblay JÉ, Lovejoy C. 2021. Protist communities along freshwater-marine transition zones in Hudson Bay (Canada). Elem Sci Anth. 9:1. doi:https://doi.org/10.1525/elementa.2021.00111.
- Johnson N, Pearce T, Breton-Honeyman K, Etiendem DN, Loseto LL. 2020. Knowledge co-production and co-management of Arctic wildlife. Arct Sci. 6:124–126. doi:https://doi.org/10.1139/as-2020-0028.
- Kemp A, Bernatchez L, Dodson JJ. 1989. A revision of coregonine fish distribution and abundance in eastern Jams-Hudson Bay. Env Biol Fishes 2:247–255. doi:https://doi.org/10.1007/BF00002462.
- Kemp WB 1983. Inuit knowledge and perceptions of the proposed great whale river hydro-electric project on the environment, ecology and subsistence economy of Kuujjuarapik. Report for the Kativik Environmental Quality Commission. 35.
- Kendall C, Silva SR, Kelly VJ. 2001. Carbon and nitrogen isotopic composition of particulate organic matter in four large river systems across the United States. Hydrol Processes. 15:1301–1346. doi:https://doi.org/10.1002/hyp.216.
- Krickov IV, Lim AG, Manasypov RM, Loiko SV, Vorobyev SN, Shevchenko VP, Dara OM, Gordeev VV, Pokrovsky OS. 2020. Major and trace elements in suspended matter of western Siberian rivers: first assessment across permafrost zones and landscape parameters of watersheds. Geochim et Cosmochim Acta. 269:429–450. doi:https://doi.org/10.1016/j.gca.2019.11.005.
- Kuzyk ZA, Candlish LM. 2019. From science to policy in the greater Hudson Bay marine region: an integrated regional impact study (IRIS) of climate change and modernization. Québec City: ArcticNet. 424.
- Kuzyk ZA, Macdonald RW, Tremblay JÉ, Stern GA. 2010. Elemental and stable isotopic constraints on river influence and patterns of nitrogen cycling and biological productivity in Hudson Bay. Cont Shelf Res. 47:163–176. doi:https://doi.org/10.1016/j.csr.2009.10.014.
- Lahoutifard N, Sparling M, Lean DRS. 2005. Total and methylmercury patterns in Arctic snow during springtime at Resolute, Nunavut, Canada. Atmos Environ. 39:7597–7606. doi:https://doi.org/10.1016/j.atmosenv.2005.07.071.
- Lalande C, Fortier L. 2011. Downward particulate organic carbon export and jellyfish blooms in southeastern Hudson Bay. J Mar Syst. 88:446–450. doi:https://doi.org/10.1016/j.jmarsys.2010.12.005.
- Lapoussière A, Michel C, Gosselin M, Poulin M. 2009. Spatial variability in organic material sinking export in the Hudson Bay system, Canada, during fall. Cont Shelf Res. 29:1276–1288. doi:https://doi.org/10.1016/j.csr.2009.02.004.
- Lapoussière A, Michel C, Gosselin M, Poulin M, Martin J, Tremblay JÉ. 2013. Primary production and sinking export during fall in the Hudson Bay system, Canada. Cont Shelf Res. 52:62–72. doi:https://doi.org/10.1016/j.csr.2012.10.013.
- Larouche P, Galbraith P. 1989. Factors affecting fast-ice consolidation in southeastern Hudson Bay. Atmos Ocean. 27:367–375. doi:https://doi.org/10.1080/07055900.1989.9649341.
- Laurion I, Vincent WF, Lean DR. 1997. Underwater ultraviolet radiation: development of spectral models for northern high latitude lakes. Photochem Photobiol. 65107: 114.
- Lavrillier A, Gabyshev S. 2021. An Indigenous science of the climate change impacts on landscape topography in Siberia. Ambio doi:https://doi.org/10.1007/s13280-020-01467-w.
- Legendre L 1977. Relevés préliminaires du benthos végétal et animal dans le détroit de Manitounuk en 1976. GIROQ, projet Grande Baleine, études océanographiques dans la baie d’Hudson. Mandat d’avant-projet préliminaire Hydro-Québec/OGB 76−1.
- Legendre L, Demers S, Gosselin M. 1987. Chlorophyll and photosynthetic efficiency of size-fractionated sea-ice microalgae (Hudson Bay, Canadian Arctic). Mar Ecol Prog Ser 40:199–203. doi:https://doi.org/10.3354/meps040199.
- Legendre L, Gosselin M. 1991. In situ spectroradiometric estimation of microalgal biomass in first-year sea ice. Polar Biol. 11:113–115. doi:https://doi.org/10.1007/BF00234273.
- Legendre L, Ingram RG, Poulin M. 1981. Physical control of phytoplankton production under sea ice (Manitounuk Sound, Hudson Bay). Can J Fish Aquat Sci 38:1385–1392. doi:https://doi.org/10.1139/f81-185.
- Legendre L, Ingram RG, Simard Y. 1982. Aperiodic changes of water column stability and phytoplankton in an Arctic coastal embayment, Manitounuk Sound, Hudson Bay. Naturaliste canadien 109:775–786.
- Legendre L, Robineau B, Gosselin M, Michel C, Ingram RG, Fortier L, Therriault JC, Demers S, Monti D. 1996. Impact of freshwater on a subarctic coastal ecosystem under seasonal sea ice (southeastern Hudson Bay, Canada) II. Production and export of microalgae. J Mar Syst. 7:233–250. doi:https://doi.org/10.1016/0924-7963(95)00007-0.
- Legendre L, Simard Y. 1979. Océanographie biologique estivale et phytoplancton dans le sud-est de la baie d’Hudson. Mar Biol 52:11–22. doi:https://doi.org/10.1007/BF00386853.
- Lento J, Laske SM, Lavoie I, Bogan D, Brua RB, Campeau S, Chin K, Culp JM, Levenstein B, Power M, et al. 2020. Diversity of diatoms, benthic macroinvertebrates, and fish varies in response to different environmental correlates in Arctic rivers across North America. Freshwater Biol 00:1–21. doi:https://doi.org/10.1111/fwb.13600.
- Lepage S, Ingram RG. 1991. Variation of upper layer dynamics during breakup of the seasonal ice cover in Hudson Bay. J Geophys Res. 96:12711–12724. doi:https://doi.org/10.1029/91JC00454.
- Lilhare R, Pokorny S, Déry SJ, Stadnyk TA, Koenig KA. 2020. Sensitivity analysis and uncertainty assessment in water budgets simulated by the variable infiltration capacity model for Canadian subarctic watersheds. Hydrol Process. 34:2057–2075. doi:https://doi.org/10.1002/hyp.13711.
- Maestrini SY, Rochet M, Legendre L, Demers S. 1986. Nutrient limitation of the bottom-ice microalgal biomass (southeastern Hudson Bay, Canadian Arctic). Limnol Oceanogr. 31:969–982. doi:https://doi.org/10.4319/lo.1986.31.5.0969.
- Markham WE. 1986. The ice cover. In: Martini IP, editor. Canadian Inland Seas. Amsterdam: Elsevier; p. 101–117. Elsevier Oceanography, Series 44.
- Matveev A, Blais MA, Laurion I, Vincent WF. 2020. Dissolved methane, carbon dioxide and limnological data from subarctic rivers, northern Québec, Canada, v. 1.0 (2019–2019). Nordicana. D78. doi:https://doi.org/10.5885/45660CE-8B92339884C146D0.
- Michel C, Legendre L, Demers S, Therriault JC. 1988. Photoadaptation of sea-ice microalgae in springtime: photosynthesis and carboxylating enzymes. Mar Ecol Prog Ser 50:177–185. doi:https://doi.org/10.3354/meps050177.
- Michel C, Legendre L, Therriault JC, Demers S. 1989. Photosynthetic responses of Arctic sea-ice microalgae to short-term temperature acclimation. Polar Biol. 9:437–442. doi:https://doi.org/10.1007/BF00443230.
- Michel C, Legendre L, Therriault JC, Demers S, Vandevelde T. 1993. Springtime coupling between ice algal and phytoplankton assemblages in southeastern Hudson Bay, Canadian Arctic. Polar Biol. 13:441–449. doi:https://doi.org/10.1007/BF00233135.
- Montgomery S, Lucotte M, Cournoyer L. 2000. The use of stable carbon isotopes to evaluate the importance of fine suspended particulate matter in the transfer of methylmercury to biota in boreal flooded environments. Sci Tot Environ 261:33–41. doi:https://doi.org/10.1016/s0048-9697(00)00593-3.
- Morin R, Dodson J, Power G. 1980. Estuarine fish communities of the eastern James-Hudson Bay coast. Environ Biol Fish 5:135–141. doi:https://doi.org/10.1007/BF02391620.
- Morin R, Dodson JJ. 1986. The ecology of fishes in James Bay, Hudson Bay and Hudson Strait. In: Martini IP, editor. Canadian Inland Seas. Amsterdam: Elsevier Oceanography Series; p. 293–325.
- Mundy CJ, Gosselin M, Starr M, Michel C. 2010. Riverine export and the effects of circulation on dissolved organic carbon in the Hudson Bay system, Canada. Limnol Oceanogr 55:315–323. doi:https://doi.org/10.4319/lo.2010.55.1.0315.
- Myers-Pigg AN, Louchouarn P, Teisserenc R. 2017. Flux of dissolved and particulate low-temperature pyrogenic carbon from two high-latitude rivers across the spring freshet hydrograph. Front Mar Sci. 4:38. doi:https://doi.org/10.3389/fmars.2017.00038.
- Owczarek P, Opała-Owczarek M, Boudreau S, Lajeunesse P, Stachnik Ł. 2020. Re-activation of landslide in sub-Arctic areas due to extreme rainfall and discharge events (the mouth of the Great Whale River, Nunavik, Canada). Sci Tot Environ. 744:140991. doi:https://doi.org/10.1016/j.scitotenv.2020.140991.
- Pienitz R, Vincent WF. 2000. Effect of climate change relative to ozone depletion on UV exposure in subarctic lakes. Nature. 404:484–487. doi:https://doi.org/10.1038/35006616.
- Piepenburg D, Archambault P, Ambrose WG, Blanchard A, Bluhm BA, Carroll ML, Conlan KE, Cusson M, Feder HM, Grebmeier JM, et al. 2011. Biodiversity of the benthic macro- and megafauna of Arctic shelf seas - a pan-Arctic synopsis. Marine Biodivers. 41:51–70. doi:https://doi.org/10.1007/s12526-010-0059-7.
- Pierrejean M, Babb D, Maps F, Nozais C, Archambault P. 2020. Spatial distribution of epifaunal communities in the Hudson Bay Complex: patterns and drivers. Elem Sci Anth. 8:1–17. doi:https://doi.org/10.1525/elementa.00044.
- Poissant L, Zhang HH, Canario J, Constant P. 2008. Critical review of mercury fates and contamination in the arctic tundra ecosystem. Sci Total Environ 400:173–211. doi:https://doi.org/10.1016/j.scitotenv.2008.06.050.
- Poltermann M. 1998. Abundance, biomass and small-scale distribution of cryopelagic amphipods in the Franz Josef Land area (Arctic). Polar Biol. 20:134–138. doi:https://doi.org/10.1007/s003000050287.
- Ponton D, Fortier L. 1992. Vertical distribution and foraging of marine fish larvae under the ice cover of southeastern Hudson Bay. Mar Ecol Prog Ser 81:215–227. doi:https://doi.org/10.3354/meps081215.
- Ponton D, Gagné JA, Fortier L. 1993. Production and dispersion of freshwater, anadromous, and marine fish larvae in and around a river plume in subarctic Hudson Bay, Canada. Polar Biol. 13:321–331. doi:https://doi.org/10.1007/BF00238359.
- Poulin M, Cardinal A. 1982a. Sea ice diatoms from Manitounuk Sound, southeastern Hudson Bay (Québec, Canada). I. Family Naviculaceae. Can J Bot 60:1263–1278. doi:https://doi.org/10.1139/b82-160.
- Poulin M, Cardinal A. 1982b. Sea ice diatoms from Manitounuk sound, southeastern Hudson Bay (Québec, Canada). II. Family Naviculaceae, genus Navicula. Can J Bot. 60:2825–2845. doi:https://doi.org/10.1139/b82-343.
- Poulin M, Cardinal A. 1983. Sea ice diatoms from Manitounuk Sound, southeastern Hudson Bay (Québec, Canada). III. Cymbellaceae, Entomoneidaceae, Gomphonemataceae, and Nitzschiaceae. Can J Bot. 61:107–118. doi:https://doi.org/10.1139/b83-010.
- Poulin M, Cardinal A, Legendre L. 1983. Réponse d’une communauté de diatomées de glace à un gradient de salinité (baie d’Hudson). Mar Biol 76:191–202. doi:https://doi.org/10.1007/BF00392735.
- Pouliot Y. 2020. Canadian northern military bases: case study of Cape Jones radar station and regional Cree people. In: de Koninck T, editor. La responsabilité de protéger – écologie et dignité. Quebec City: Presses de l’Université Laval; pp. 103–118.
- Prinsenberg SJ. 1986. The circulation pattern and current structure of Hudson Bay. In: Martini IP, editor. Canadian Inland Seas, Vol. 44, Series. Amsterdam: Elsevier Oceanography; p. 187–204.
- Proverbs TA, Lantz TC, Lord SI, Amos A, Ban NC. 2020. Social-ecological determinants of access to fish and well-being in four Gwich’in communities in Canada’s Northwest Territories. Hum Ecol 48:155–171. doi:https://doi.org/10.1007/s10745-020-00131-x.
- Rae R, Vincent WF. 1998a. Effects of temperature and ultraviolet radiation on microbial foodweb structure: potential responses to global change. Freshwater Biol. 40:747–758. doi:https://doi.org/10.1046/j.1365-2427.1998.00361.x.
- Rae R, Vincent WF. 1998b. Phytoplankton production in subarctic lake and river ecosystems: development of a photosynthesis-temperature-irradiance model. J Plankton Res. 20:1293–1312. doi:https://doi.org/10.1093/plankt/20.7.1293.
- Redfield AC, Ketchum BH, Richards FA. 1963. The influence of organisms on the composition of seawater. In: Hill MN, editor. The sea. Vol. 2. New York: Interscience Publishers. 26–77.
- Retamal L, Vincent WF, Martineau C, Osburn CL. 2007. Comparison of the optical properties of dissolved organic matter in two river-influenced coastal regions of the Canadian Arctic. Estuar Coast Shelf Sci 72:261–272. doi:https://doi.org/10.1016/j.ecss.2006.10.022.
- Robineau B, Legendre L, Therriault JC, Fortier L, Rosenberg G, Demers S. 1994. Ultra-algae (< 5 µm) in the ice, at the ice-water interface and in the under-ice water column (southeastern hudson bay, Canada). Mar Ecol Prog Ser 115:169–180.
- Rochet M, Grainger EH. 1988. Community structure of zooplankton in eastern Hudson Bay. Can J Zool. 66:1626–1630. doi:https://doi.org/10.1139/z88-237.
- Rochet M, Legendre L, Demers S. 1985. Acclimation of sea-ice microalgae to freezing temperature. Mar Ecol Prog Ser. 24:187–191. doi:https://doi.org/10.3354/meps024187.
- Rochet M, Legendre L, Demers S. 1986. Photosynthetic and pigment responses of sea ice microalgae to changes in light intensity and quality. J Exp Mar Biol Ecol. 101:211–226. doi:https://doi.org/10.1016/0022-0981(86)90264-9.
- Rosenberg AA, Bolster WJ, Alexander KE, Leavenworth WB, Cooper AB, McKenzie MG. 2005. The history of ocean resources: modeling cod biomass using historical records. Front Ecol Evol. 3:84–90. doi:https://doi.org/10.1890/1540-9295(2005)003[0078:THOORM]2.0.CO;2.
- Runge JA, Ingram RG. 1988. Underice grazing by planktonic calanoid copepods in relation to a bloom of ice microalgae in southeastern Hudson Bay. Limnol Oceanogr 33:280–286. doi:https://doi.org/10.4319/lo.1988.33.2.0280.
- Runge JA, Ingram RG. 1991. Under-ice feeding and diel migration by the planktonic copepods Calanus glacialis and Pseudocalanus minutus in relation to the ice algal production cycle in southeastern Hudson Bay. Mar Biol 108:217–225. doi:https://doi.org/10.1007/BF01344336.
- Runge JA, Therriault JC, Legendre L, Ingram RG, Demers S. 1991. Coupling between ice microalgal productivity and the pelagic, metazoan food web in southeastern Hudson Bay: a synthesis of results. Polar Res 10:325–338. doi:https://doi.org/10.3402/polar.v10i2.6750.
- Smith REH, Anning J, Clement P, Cota G. 1988. Abundance and production of ice algae in resolute passage, Canadian Arctic. Mar Ecol Prog Ser 48:251–263. doi:https://doi.org/10.3354/meps048251.
- Smith TG, Hammill MO. 1986. Population estimates of white whales Delphinapterus leucas, in James Bay, eastern Hudson Bay, and Ungava Bay. Can J Fish Aquat Sci 43:1982–1987. doi:https://doi.org/10.1139/f86-243.
- St. Louis VL, Sharp MJ, Steffen A, May A, Barker J, Kirk JL, Kelly DJA, Arnott SE, Keatley B, Smol JP, et al. 2005. Some sources and sinks of monomethyl and inorganic mercury on Ellesmere Island in the Canadian High Arctic. Environ Sci Technol 39:2686–2701. doi:https://doi.org/10.1021/es049326o.
- Subba Rao DV, Platt T. 1984. Primary productivity of Arctic waters. Polar Biol. 3:191–201. doi:https://doi.org/10.1007/BF00292623
- Tourangeau S, Runge JA. 1991. Reproduction of Calanus glacialis under ice in spring in southeastern Hudson Bay. Mar Biol 108:227–233. doi:https://doi.org/10.1007/BF01344337.
- Tremblay C, Runge JA, Legendre L. 1989. Grazing and sedimentation of ice algae during and immediately after a bloom at the ice-water interface. Mar Ecol Prog Ser 56:291–300. doi:https://doi.org/10.3354/meps056291.
- Tremblay JÉ, Lee J, Gosselin M, Bélanger S. 2019. Nutrient dynamics and marine biological productivity in the Greater Hudson Bay marine region. In: Kuzyk ZZ, Candlish L, editors. From science to policy in the Greater Hudson Bay Marine region: an Integrated Regional Impact Study (IRIS) of climate change and modernization. Quebec City: ArcticNet. p. 225-243
- Vallières C, Retamal L, Osburn C, Vincent WF, Vincent WF. 2008. Bacterial production and microbial food web structure in a large arctic river and the coastal Arctic Ocean. J Mar Syst 74:756–773. doi:https://doi.org/10.1016/j.jmarsys.2007.12.002.
- Vincent WF. 2020. Arctic climate change: local impacts, global consequences, and policy implications. In: Coates K, Holroyd C, editors. Palgrave Handbook of Arctic Policy and Politics. London: Palgrave Macmillan; p. 507–526. doi:https://doi.org/10.1007/978-3-030-20557-7_31.
- Vincent WF, Belzile C. 2003. Biological UV exposure in the polar oceans: arctic-Antarctic comparisons. In: Huiskes AHL, Gieskes WWC, Rozema J, Schorno RML, van der Vies SM, Wolff WJ, editors. Antarctic biology in a global context. Leiden: Backhuys Publishers; pp. 176–181.
- Vincent WF, Lemay M, Allard M. 2017. Arctic permafrost landscapes in transition: towards an integrated earth system approach. Arctic Science 3:39–64. doi:https://doi.org/10.1139/AS-2016-0027.
- Vincent WF, Rautio M, Pienitz R. 2007. Climate control of underwater UV exposure in polar and alpine aquatic ecosystems. In: Orbaek JB, Kallenborn R, Tombre I, Hegseth E, Falk-Petersen A, Hoel AH, editors. Arctic Alpine ecosystems and people in a changing environment. Berlin: Springer; p. 227–249. doi:https://doi.org/10.1007/978-3-540-48514-8_14.
- Voinot-Baron W. 2020. A bitter taste of fish: the temporality of salmon, settler colonialism, and the work of well-being in a Yupiaq fishing village. Ecol Soc. 25:4. doi:https://doi.org/10.5751/ES-11408-250204.
- Vonk JE, Tank SE, Bowden WB, Laurion I, Vincent WF, Alekseychik P, Amyot M, Billet MF, Canário J, Cory RM, et al. 2015. Reviews and syntheses: effects of permafrost thaw on Arctic aquatic ecosystems. Biogeosciences. 12:7129–7167. doi:https://doi.org/10.5194/bg-12-7129-2015.
- Wei CL, Cusson M, Archambault P, Belley R, Brown T, Burd BJ, Edinger E, Kenchington E, Gilkinson K, Lawton P, et al. 2020. Seafloor biodiversity of Canada’s three Oceans: patterns, hotspots, and potential drivers. Divers Distrib. 26:226–241. doi:https://doi.org/10.1111/ddi.13013.
- Wilson CV. 1968. Notes on the climate of Poste-de-la-Baleine, Québec. Nordicana. 24:1–93.
- Xavier JC, Barbosa A, Agosti S, Alonso-Saéz L, Alvito P, Ameneiro J, Ávila C, Baeta A, Canário J, Carmona R, et al. 2013. Polar marine biology science in Portugal and Spain: recent advances and future perspectives. J Sea Res. 83:9–29. doi:https://doi.org/10.1016/j.seares.2013.05.013.