
ABSTRACT
Increased tourism impact, recreational activities and structures in natural areas can affect wildlife by increasing urbanization, landscape fragmentation and disturbance. I examined the potential effects of tourist destinations on four forest grouse (Tetraoninae) and five mammalian species in northern Finland. I analyzed density data obtained from wildlife counts carried out by hunters around ten tourist destinations. The densities of mountain hare and mustelid species were negatively correlated with the distance to a tourist destination. The densities of adult grouse, juvenile grouse, mountain hare, and mustelids were positively correlated with the area of mixed forests surrounding the destinations. The densities of adult and juvenile grouse were positively correlated, while the densities of pine marten and mustelids were negatively correlated with the area of agricultural land surrounding the destinations. The densities of the studied wildlife species varied among destinations and years. It seems that current recreational activities have not caused significant changes in the occurrence and abundance of wildlife species in the surroundings of the tourist destinations studied. Location of a destination, predator densities, and landscape structure around the destination had the most impact on the density of wildlife species.
Résumé
L’augmentation des effets du tourisme, des activités de récréation et des infrastructures dans les zones naturelles peut affecter la faune en augmentant l’urbanisation, la fragmentation du paysage et les perturbations. J’ai examiné les effets potentiels de destinations touristiques sur quatre espèces de Tetraoninae (tétras, gélinottes et lagopèdes) et cinq espèces de mammifères dans le nord de la Finlande. J’ai analysé les données de densité obtenues de comptages faits par des chasseurs autour de dix destinations touristiques. Les densités de lièvres variables et de mustélidés étaient corrélées négativement avec la distance à une destination touristique. Les densités de Tetraoninae jeunes et adultes, de lièvres variables et de mustélidés étaient positivement corrélées avec la superficie de forêt mixte autour des destinations. Les densités de Tetraoninae jeunes et adultes étaient positivement corrélées avec la superficie de terres agricoles autour des destinations, alors que les densités de martres des pins et de mustélidés étaient négativement corrélées. Les densités des espèces étudiées variaient selon les destinations et les années. Il semble que les activités récréatives actuelles n’ont pas causé de changements significatifs de l’occurrence et de l’abondance des espèces fauniques entourant les destinations touristiques étudiées. L’emplacement d’une destination, les densités de prédateurs et la structure du paysage autour de la destination avaient le plus d’effet sur la densité des espèces fauniques.
Introduction
There is a long-standing tradition of tourism in Lapland, northern Finland. In recent decades, tourism has become a significant source of income, and the leisure industry is now one of the most important economic sectors in Lapland. The number of registered overnight stays in Lapland has been increasing (Official Statistics of Finland, Citation2022). Tourist destinations, ski resorts, and accommodation areas have often been developed in wilderness or protected areas, such as national parks that are part of the Natura 2000 conservation network. This is because biodiversity in these areas is an important attraction for tourists (Puustinen et al. Citation2009; Lyon et al. Citation2012; Siikamäki et al. Citation2015). Protected areas with high biodiversity values can attract more visitors and can further have greater potential for delivering socio-economic benefits to local communities through nature-based tourism, thus providing economic justification for nature protection (Naidoo et al. Citation2011; Lyon et al. Citation2012). The importance of nature as a tourist attraction has increased visitor numbers in protected areas globally (Balmford et al. Citation2009; Siikamäki et al. Citation2015). The number of visitors to national parks in Lapland has significantly increased (Metsähallitus, Citation2022). As the number of visitors continues to rise, there is a greater need for space, infrastructure, and other facilities, which can have negative impacts on wildlife species that are sensitive to disturbances.
Tourism and recreation are known to affect wildlife directly and indirectly (Tolvanen and Kangas Citation2016). The increasing popularity of outdoor activities, nature-based tourism, and recreation leads to urban development, landscape fragmentation, and increased disturbance in natural areas (e.g., Tolvanen and Kangas Citation2016). Recreation activities are expanding into new areas, and existing leisure facilities are being expanded. The increase of tourism, including outdoor sports, recreation, and infrastructure development, into natural areas can have various impacts on biodiversity and wildlife species. These impacts can be either direct such as animals being killed in cable-collisions (e.g., Miquet Citation1986; Storch Citation1998) or waste providing supplementary food (e.g., Pickering et al. Citation2003), or indirect through habitat modification and fragmentation (Storch Citation2000). The expansion of tourist destinations and recreational activities can change the structure of the landscape, resulting in degradation and reduction of wildlife habitats. The development of tourist infrastructure, such as buildings, trails, roads, and ski-lifts, creates areas that may be unsuitable for wildlife, leading to habitat fragmentation and increased human activity (Pickering et al. Citation2003; Laiolo and Ronaldo Citation2005; Balmford et al. Citation2009).
Loss and fragmentation of habitats at local levels can result in the loss of connectivity and gene flow within a population (Saunders et al. Citation1991). Additionally, outdoor recreation can disturb wildlife, increase their energy expenditure, lead to reproductive failures, alter their behavior, and cause them to avoid otherwise suitable habitats (Burger and Gochfeld Citation1998; Miller and Hobbs Citation2000; Taylor and Knight Citation2003; Laiolo and Ronaldo Citation2005; Balmford et al. Citation2009; Tolvanen and Kangas Citation2016; Larm et al. Citation2021). Therefore, it is crucial to understand the limits of urban growth and the ecological impacts of urban sprawl, particularly in areas near ecologically valuable regions. This knowledge is also essential for the planning and management of recreational areas as part of ecologically sustainable tourism. Sustainability principles refer to the suitable balance between management, environmental, economic, and socio-cultural aspects of tourism development necessary to guarantee its long-term sustainability (World Trade Organization, Citation2004; Lim and McAleer Citation2005).
Forest grouse species (Tetraoninae) are considered to be good indicators of habitat and landscape quality (Lindén and Helle Citation1996). For example, the capercaillie (Tetrao urogallus) has been shown to act as an umbrella species for several endangered mountain birds in Central Europe (Suter et al. Citation2002). Forest grouses have large home ranges and they are often characterized by limited habitat preference. They are highly sensitive to human disturbance and to habitat alterations which need to be taken into account in tourism projects (Rolstad and Wegge Citation1987; Zeitler Citation2000; Sachot et al. Citation2003).
Several harmful effects of tourism on grouse species have been reported. For example, in areas with ski resorts, collisions with wire fences, overhead wires, and ski wires often result in the death of grouse (e.g., Miquet Citation1986; Watson and Moss Citation2004). In the Alps, the disturbance caused by snow sport free-riders increases the concentration of faecal stress hormone in the black grouse (Terao tetrix) and capercaillie (Arlettaz et al. Citation2007; Thiel et al. Citation2011). Cross country ski trails and tracks have been found to reduce the available range for the capercaillie, black grouse, and hazel grouse (Tetrastes bonasia) (Brenot et al. Citation1996; Ménoni and Magnani Citation1998; Summers et al. Citation2007). According to Matysek et al. (Citation2020) and Tost et al. (Citation2020), when capercaillie habitat overlaps with cross country skiing facilities in Midi Pyrénées, the population of capercaillie wintering in the area declines. The presence of human activity in the black grouse winter habitat may result in a negative energy budget, leading to deaths from starvation or making weakened individuals easy prey for predators (Ménoni and Magnani Citation1998). Furthermore, disturbances at traditional lekking sites, which are typically located on ridges and hilltops that are also popular for winter sports, can have a negative impact on the social system of the black grouse, and consequently their ability to reproduce successfully (Ménoni and Magnani Citation1998). In areas where downhill skiing is common, activities such as cleaning up ski centers during the summer and starting the hiking season early can disrupt black grouses during the incubation and rearing of their young (Zeitler Citation2000).
The populations of generalist nest predators, such as corvids and red foxes (Vulpes vulpes), have been found to be high in urban areas and tourist destinations due to human-generated waste and feeding (Jokimäki and Huhta Citation2000; Storch and Leidenberger Citation2003; Watson and Moss Citation2004; Huhta and Sulkava Citation2014). In the areas surrounding tourist destinations, corvids and red foxes can have significant impacts on prey species like forest grouses (Vainio et al. Citation1997; Pickering et al. Citation2003; Contesse et al. Citation2004; Kaisanlahti et al. Citation2012).
The purpose of this study was to assess how tourist destinations in northern Finland affect the populations of forest grouses, mammalian predators, and mountain hares (Lepus timidus). I predicted that the number of forest grouses would increase as the distance from tourist destinations increases, due to reduced human disturbance. The second hypothesis I tested was that tourist destinations may lead to higher densities of mammalian predators. These species may directly or indirectly benefit from human activity, which enhances habitat productivity and provides anthropogenic waste.
Material and methods
Study area
The study area, which is approximately 36522 km2, is primarily located in the northern boreal zone. Only the southernmost parts of the study area are located in the midboreal zone (Ahti et al. Citation1968). The landscape in these areas is characterized by coniferous forests and open mires. In the northern parts of the study area, the average length of the growing season (defined as days with an average temperature of + 5°C or higher) is approximately 100–120 days. The ground is covered in snow for about 6–7 months of the year (Finnish Meteorological Institute, Citationn.d.). The study was conducted in the ten largest tourist destinations in Finnish Lapland and their surrounding areas: Iso-Syöte, Levi, Luosto, Pallastunturi, Pyhätunturi, Ruka, Saariselkä, Sallatunturi, Suomu, and Ylläs. These destinations are all downhill skiing centers, with elevations ranging from approximately 400 m to over 700 m a.s.l (Official Statistics of Finland Citation2022, , ).
Figure 1. Locations of the studied tourist destinations (red circles). The study area around each destination is represented as a circle with a radius of 40 km. The established wildlife triangles in the study are represented by small green circles.
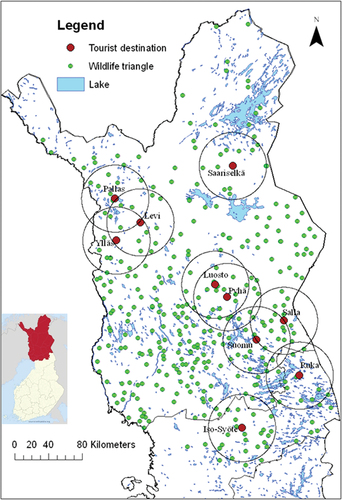
Table 1. Basic features of the studied tourist destinations (Official Statistics of Finland Citation2022). Numbers of registered overnights for Pallas and Suomu were not available. The overnights for Pyhätunturi and Luosto were combined.
The main tourist season in the study sites is winter because they are popular destinations for skiing. However, due to the increasing popularity of nature-based tourism, other seasons such as summer and autumn are also becoming more popular. The number of registered overnight stays in these destinations and their main features during the study period are presented in (Official Statistics of Finland Citation2022). In addition to downhill skiing, there are various activities available for tourists, including cross-country skiing, snowshoe walking, winter fishing, ice climbing, winter golf, dog-sled and reindeer safaris, and snowmobile driving. During the snow-free time, leisure activities such as hiking, berry picking, white water rafting, paddling, fishing, mountain biking, horseback riding, bird watching, rock climbing, hunting, and buggy driving are available. All of these activities may disturb wildlife.
Wildlife triangle data
I used data from Finnish wildlife triangle censuses of tetraonids (Lindén et al. Citation1996; Natural Resources Institute Finland Citationn.d.). The wildlife triangle is the basic unit used to assess wildlife populations in Finland. This monitoring program is organized by the Natural Resources Institute and the Finnish Wildlife Agency, and it is carried out by volunteers. The triangle is a permanent, triangular route that measures 12 km in total (each side is 4 km). It is censused twice a year, once in late summer and once in mid-winter. To ensure random selection of routes, each wildlife triangle is limited to a topographic map sheet measuring 10 × 10 km, and no map sheet has more than one triangle (Lindén et al. Citation1996).
The main objective of summer censuses is to count the number of grouse species within a 60-m wide belt using a chain of three people. All observations of grouse are marked on a topographic map with a scale of 1:20,000. During the winter count, all tracks made by mammals in the snow are recorded. The winter count can be done by one person, and it is recommended to carry out the actual count within a day after a pre-check or a significant snowfall. The total area covered by one triangle in the census is 0.72 km2. The unit used to measure grouse densities is individuals/km2 on forest land, while the densities of mammal species are measured as crossings/24 h/10 km (Lindén et al. Citation1996).
I collected data from 88 wildlife triangles located near tourist destinations within a 40-km radius. If there were multiple tourist destinations within this radius, only the closest destination to each triangle was included. Each triangle was only used once in the study. I measured the distance from the center point of each triangle to the nearest tourist destination. The center point of the tourist destination was determined by either the largest hotel or the hotel closest to the main ski lift.
Because not every single triangle was counted every year, I only selected those triangles that were counted at least ten times during the study period. I selected the density data for capercaillie, black grouse, hazel grouse (Tetrastes bonasia), and willow grouse (Lagopus lagopus) from the summer censuses. From the winter counts, I selected the track density data of small and medium-sized mammalian predators; red fox, stoat (Mustela erminea), least weasel (Mustela nivalis), and pine marten (Martes martes). Additionally, I assessed the data of mountain hare, which is an important prey species for many predators, from the winter survey data.
The analyses were conducted separately for adult and juvenile grouse because the potential effects of tourist destinations may vary with age. In this study, I combined the data from different grouse species because I was interested in the overall effects of tourist destinations on grouse, rather than the effects on individual grouse species. For further analyses, I combined the data of stoats and least weasels, considering them as mustelids.
Landscape data and analyses
Landscape analyses were carried out with ArcMap (ArcGis 9.2) from the CORINE2000 Land Cover. The CORINE2000 classification was based on the interpretation of LANDSAT 7 ETM satellite images and data integration with existing digital map data. The IMAGE2000 national satellite image mosaic was produced from the LANDSAT 7 ETM satellite images. The CLC2000 uses information from several sources: the Finnish Environment Institute, National Land Survey of Finland, The Ministry of the Agriculture and Forestry, Population Register Centre (built-up areas), and satellite image interpretation (Corine Land Cover Citation2000).
I created a circle with a radius of 2.5 km (approximately covering an area of 19.63 km2) around the center point of each wildlife triangle. Within this circle, I determined the proportions of different habitat classes (). Using a circle with a radius of 2.5 km is a reasonable way to cover the entire triangle area (Helle and Nikula Citation1996). In order to have more meaningful variables for analysis, I combined discontinuous urban fabric with sport and leisure facilities to represent built-up areas. I also combined non-irrigated arable land and land primarily used for agriculture, which also had significant areas of natural vegetation, into agricultural areas. Shrubs and open areas were derived from classes such as moors and heathland, transitional woodland/shrub (including clearcut areas and sapling stands), and bare rock. Water courses and water bodies were combined to represent water areas. Broad-leaved forest, coniferous forest, mixed forest, and peat bog were treated as separate habitat classes ().
Table 2. Average proportions (± S.D.) of different habitat classes in the wildlife triangles surrounding the studied tourist destinations (within a radius of 2.5 km).
Statistical methods
I chose to use correlation-based principal component analysis (PCA; McGarigal et al. Citation2000) in order to minimize the effects of multicollinearity and identify patterns in the data related to habitat structure. The main goal of PCA is to summarize the information from a large number of original variables into a smaller set of composite dimensions, while minimizing the loss of information. PCA is an unconstrained ordination technique, meaning it does not attempt to define the relationship between independent variables and dependent variables. This task is left to subsequent analyses (McGarigal et al. Citation2000). Only components with an eigenvalue greater than 1.0 were included in further analyses.
Coniferous and deciduous forests, as well as shrubs and open areas, were the most dominant habitat classes in the wildlife triangles around the destinations (). In the principal component analysis, the first two components accounted for the majority of the variation. The first principal component axis explained 25.9% of the total variation and showed a positive correlation with the amount of mixed and broad-leaved forests, which represent mixed forests. The second principal component axis explained 23.0% of the total variation and showed a positive correlation with agricultural and built-up areas, representing agricultural land ().
Table 3. Variables describing landscape composition around the wildlife triangles (within a radius of 2.5 km).
I used general linear models (GLM) to analyze the factors that influence the densities of the species studied, including adult and juvenile forest grouse and predator species. The independent variables in the model were tourist destination (a fixed factor), year (a random factor), distance from the triangle to the nearest tourist destination, and the first two habitat components derived from the PCA (covariates). The interaction term between a tourist destination and distance was also included. However, since distance did not have a significant effect, the interaction term was not included in the final model.
Relationships between densities of prey species and predator species were analyzed with general linear models. I only included wildlife triangles that were counted in both summer and winter in the analysis. The models for prey species densities included habitat components (PC1 and PC2), year, and the abundance of the red fox. The red fox was chosen for the models because it is an important predator that limits the numbers of hare and grouse (Lindström et al. Citation1994). All statistical analyses were conducted using SPSS 9.05 for Windows. The reported significance level is p < 0.05.
Results
In general, the densities of adult and juvenile grouse, mountain hare, red fox, and mustelids varied between study years and tourist destinations (). The spatial variation in densities was higher for mountain hare (2.1–15.1 crossings/24 h/10 km) and grouse species (2.7–12.0 individuals/km2) than for predator species ().
Table 4. Mean (± S.D.) abundances of wildlife species around tourist destinations.
Table 5. Results of general linear models for wildlife densities, year, habitat variables, and distance to destination.
The densities of mountain hares and mustelids decreased as the distance to tourist destinations increased (). However, there was no correlation between the distance to a tourist destination and grouse densities or the densities of red foxes and pine martens (). Among the habitat variables, the densities of adult and juvenile grouses, mountain hares, and mustelids were positively correlated with the amount of mixed forest. The densities of adult and juvenile grouses were positively correlated, while the densities of pine martens and mustelids were negatively correlated with the amount of agricultural land (). The abundance of red foxes was positively correlated with the density of mountain hares, but the abundances of predators did not affect grouse density ().
Table 6. Results of general linear models for the densities of prey species, habitat variables and red fox density.
Discussion
The densities of the studied grouse species were not affected by distance to a tourist destination. However, the densities of mountain hare and mustelids were higher closer to tourist destinations. Based on these findings, it can be concluded that current land use and recreational activities have not had significant negative effects on the wildlife living near the tourist destinations studied.
The tourist destinations may offer human-made food sources and suitable foraging habitats, such as edge habitats and open areas. These factors can have a positive impact on the wildlife survival (Henttonen Citation1989; Budela et al. Citation1998; Newsome and van Eeden Citation2017). Mustelids may follow their main prey species, small rodents, which are likely to prefer urban and cultivated areas within the destinations. Most vole species eat the bark of trees and bushes, as well as the roots of young trees, Carex species, and grasses (Hansson and Larsson Citation1978, Aunapuu and Oksanen Citation2003). These types of food are abundant in gardens, grassy areas, and edge habitats.
The results support the finding of Heikkilä et al. (Citation2007) in the Levi and Ylläs tourist destinations that the density of mountain hares and mustelids was higher in developed areas and campfire sites compared to forest areas in the Pallas-Yllästunturi National Park. Additionally, the density of voles was higher in areas with tourism-related infrastructure than in natural areas. The reason for the higher densities of mustelids near the destinations may be that mustelids, being more specialized predators of voles compared to red foxes and pine martens, prefer the same habitats that voles use (Hanski et al. Citation1991).
In this study the presence of agricultural land was positively correlated with higher densities of adult and juvenile grouse, but negatively correlated with densities of pine marten. This suggests that the agricultural habitat is generally more productive for grouse. Previous studies have shown that the likelihood of finding a grouse hen with a brood was higher in wildlife triangles located near fields (Kurki and Lindén Citation1995; Kurki et al. Citation2000). In areas with high productivity, agricultural lands have been cleared. As a result, the surrounding forest stands may also have higher productivity and offer a more suitable breeding habitat for grouse (Kurki and Lindén Citation1995; Kurki et al. Citation2000).
The pine marten is a species that is strictly dependent on forests (Storch et al. Citation1990). In this study, I observed a positive relationship between pine marten density and mixed forests, as well as a negative relationship between marten density and agricultural land. Kurki et al. (Citation1998) found that the negative effect of increasing agricultural land was particularly strong in northern Finland. They suggested that the presence of agricultural fields likely indicates the presence of villages, and that disturbance and hunting pressure may be higher near villages. This could explain the negative correlation between pine marten abundance and agricultural land.
The presence of mixed forests was positively associated with the populations of mountain hare, adult grouse, and juvenile grouse. Hiltunen et al. (Citation2004) found that hares prefer thickets of willow (Salix spp.), downy birch (Betula pubescens), and spruce (Picea abies) during the summer. Additionally, aspen is known to be an important source of nutrition for hares in their winter diet in Finnish Lapland (Pulliainen and Tunkkari Citation1987). Dense understories are crucial for mountain hare habitat use, as they provide both food and protection against predators (Hiltunen et al. Citation2004). The significance of mixed forests for grouse is not surprising, as all grouse species require both conifers and broad-leaved trees for either food or shelter from predators (e.g., Seiskari Citation1962; Pulliainen Citation1982; Sachot et al. Citation2003; Åberg et al. Citation2003).
The density of all species varied among the studied tourist destinations, with most species being more abundant in southern compared to northern destinations. Differences in species densities between destinations are likely due to a general decrease in productivity from south to north. The density of wildlife species, except for pine marten, also varied between study years. This finding aligns with previous studies (e.g., Siivonen Citation1954; Lindén Citation1989) that have reported significant temporal variations, sometimes in a cyclic pattern, in wildlife species densities. These results emphasize the importance of conducting research over multiple years when studying the habitat association of wildlife species.
Landscape data was only available for a year, so how the landscape has changed over the past years remains unknown. Additionally, digital data on the location and length of snowmobile and cross-country ski routes, which could potentially disturb the landscape and have a negative impact on species like grouse during their display season was not available. More information is needed on the spatial distribution and frequency of use of cross-country ski routes and snowmobile routes, among other factors. More information is also needed on the combined ecological impacts of tourism and climate change.
Conclusion
Overall, the tourist destinations do not have a significant impact on the occurrence and abundance of the studied wildlife species in northern Finland. Species densities were not lower near the studied tourist destinations. In fact, the numbers of mountain hares and mustelids were higher near the tourist destinations compared to areas further away. This suggests that human disturbances and recreational activities are not negatively impacting the species, at least within the spatial scale of this study. The locations of the tourist destinations and the surrounding landscape structure seem to have a greater influence on the densities of wildlife species than the tourist destinations themselves. The studied tourist destinations was relatively small, suggesting that the level of human disturbance was not very high. Additionally, some of the destinations were located in the middle of wilderness areas with a large proportion of old forests. The nearby pristine forest landscape may have offset any harmful effects of the tourist destinations on wildlife populations by providing alternative habitats. However, it is possible that negative impacts of tourism on wildlife populations may occur with a delay. Long-term monitoring is needed to provide information on the effects of tourism on wildlife populations, for example through movement into suboptimal habitats, increased energy expenditure, reduced feeding time, and increased nest predation.
Understanding and predicting the impacts of tourism destinations on species is an important prerequisite for achieving sustainable use of natural resources in tourism destinations. More information is needed to further evaluate the ongoing development of tourist destinations and their surrounding areas. The potential for positive or negative feedback mechanisms in the relationship between tourists and wildlife highlights the importance of finding a balance between conserving biodiversity and ensuring continued recreational opportunities.
Acknowledgments
I thank the voluntary hunters who contributed to the study by performing grouse counts. I thank the Finnish Environment Institute (SYKE) for providing the landscape data.
Disclosure statement
No potential conflict of interest was reported by the author(s).
Additional information
Funding
References
- Åberg J, Swenson JE, Angelstam P. 2003. The habitat requirements of hazel grouse (Bonasa bonasia) in managed boreal forest and applicability of forest stand descriptions as a tool to identify suitable patches. For Ecol Manag. 175:437–444. doi: 10.1016/S0378-1127(02)00144-5.
- Ahti T, Hämet-Ahti L, Jalas J. 1968. Vegetation zones and their sections in northwestern Europe. Ann Bot Fenn. 5:169–211.
- Arlettaz R, Patthey P, Baltic M, Leu T, Schaub M, Palme R, Jenni-Eiermann S. 2007. Spreading free-riding snow sports represent a novel serious threat for wildlife. P Roy Soc B-Biol Sci. 274:1219–1224. doi: 10.1098/rspb.2006.0434.
- Aunapuu M, Oksanen T. 2003. Habitat selection of coexisting competitors: a study of small mustelids in northern Norway. Null. 17(4):371–392. doi: 10.1023/A:1027356618140.
- Balmford A, Beresford J, Green J, Naidoo R, Walpole M, Manica A. 2009. A global perspective on trends in nature-based tourism. PLOS Biol. 7(6):e1000144. doi: 10.1371/journal.pbio.1000144.
- Brenot JF, Catusse M, Menoni E. 1996. The effects of the Plateau de Beille cross-country ski station (Ariège) on an important population of the capercaillie Tetrao urogallus. Alauda. 64:249–260.
- Budela TM, Dicman CR, Newsome AE. 1998. Diet and winter foraging behaviour of the red fox (Vulpes vulpes) in alpine and subalpine New South Wales. Australian Mammal. 20:321–330.
- Burger J, Gochfeld M. 1998. Effects of ecotourism on bird behaviour at Loxahatchee National Refuge, Florida. Environ Conserv. 25:13–21. doi: 10.1017/S0376892998000058.
- Contesse P, Hegglin D, Gloor S, Bontadina F, Deplazes P. 2004. The diet of urban foxes (Vulpes vulpes) and the availability of anthropogenic food in the city of Zurich, Switzerland. Mammal Biol. 69:81–95. doi: 10.1078/1616-5047-00123.
- Corine Land Cover. 2000. https://geoportal.ymparisto.fi/meta/julkinen/dokumentit/CorineLandCover2000.pdf.
- Finnish Meteorological Institute. n.d. Climate statistics. https://en.ilmatieteenlaitos.fi/.
- Hanski I, Hansson L, Henttonen H. 1991. Specialist predators, generalist predators, and the microtine rodent cycle. J Anim Ecol. 60:353–367. doi: 10.2307/5465.
- Hansson L, Larsson TB. 1978. Vole diet on experimentally managed reforestation areas in northern Sweden. Holarct Ecol. 1:16–26. doi: 10.1111/j.1600-0587.1978.tb00934.x.
- Heikkilä T, Sulkava P, Huhta E, Ukkola M, Helle P. 2007. Effects of nature-based tourism on mammal densities on three different levels of disturbance in western Finnish Lapland. In: Kaisanlahti-Jokimäki M, Jokimäki J, Kivilahti R, and Härkönen J, editors. Nature and tourism. Tools for sustainability. Rovaniemi: Arctic Centre, University of Lapland; p. 15.
- Helle P, Nikula A. 1996. Usage of geographic information systems (GIS) in analyses of wildlife triangle data. Finn Game Res. 49:26–36.
- Henttonen H. 1989. Does an increase in the rodent and predator densities, resulting from modern forestry, contribute to the long-term decline in Finnish tetraonids? Suomen Riista. 35:83–90. (in Finnish with English Summary).
- Hiltunen M, Kauhala K, Lindén H. 2004. Habitat use of the mountain hare Lepus timidus in summer: the importance of different vegetation layers. Acta Theriol (Warsz). 49(4):479–490. doi: 10.1007/BF03192592.
- Huhta E, Sulkava S. 2014. The impact of nature-based tourism on bird communities: a case study in Pallas-Yllästunturi National Park. Environ Manage. 53:1005–1014. doi: 10.1007/s00267-014-0253-7.
- Jokimäki J, Huhta E. 2000. Artificial nest predation and abundance of birds along an urban gradient. Condor. 102(4):838–847. doi: 10.1093/condor/102.4.838.
- Kaisanlahti-Jokimäki ML, Jokimäki J, Huhta E, Siikamäki P. 2012. Impacts of seasonal small-scale urbanization on nest predation and bird assemblages at tourist destinations. In: Lepczyk C Warren P, editors. Urban bird ecology and conservation. Studies in Avian Biology 45. Berkeley (CA): University of California Press; p. 93–110.
- Kurki S, Lindén H. 1995. Forest fragmentation due to agriculture affects the reproductive success of the ground-nesting black grouse Tetrao tetrix. Ecography. 18:109–113. doi: 10.1111/j.1600-0587.1995.tb00330.x.
- Kurki S, Nikula A, Helle P, Lindén H. 1998. Abundances of red fox and pine marten in relation to the composition of boreal forest landscapes. J Anim Ecol. 67:874–886. doi: 10.1046/j.1365-2656.1998.6760874.x.
- Kurki S, Nikula A, Helle P, Lindén H. 2000. Landscape fragmentation and forest composition effects on grouse breeding success in boreal forests. Ecology. 81(7):1985–1997. doi: 10.1890/0012-9658(2000)081[1985:LFAFCE]2.0.CO;2.
- Laiolo P, Ronaldo A. 2005. Forest bird diversity and ski-runs: a case of negative edge effect. Null. 8:9–16. doi: 10.1017/S1367943004001611.
- Larm M, Norén K, Angerbjörn A. 2021. Temporal activity shift in arctic foxes (vulpes lagopus) in response to human disturbance. Global Ecol Conserv. 27:e01602. doi: 10.1016/j.gecco.2021.e01602.
- Lim C, McAleer M. 2005. Ecologically sustainable tourism management. Environ Model Soft. 20(11):1431–1438. doi: 10.1016/j.envsoft.2004.09.023.
- Lindén H. 1989. Characteristics of tetraonid cycles in Finland. Finn Game Res. 46:34–42.
- Lindén H, Helle E, Helle P, Wikman M. 1996. Wildlife triangle scheme in Finland: methods and aims for monitoring wildlife populations. Finn Game Res. 49:4–11.
- Lindén H, Helle P. 1996. Preface: The welfare on wildlife reflects the welfare of nature – wildlife monitoring produces easily understandable parameters. Finn Game Res. 49:3.
- Lindström ER, Andrén H, Angelstam P, Cederlund G, Hörnfeldt B, Jäderberg L, Lemnell PA, Martinsson B, Sköld K, Swensson JE. 1994. Disease reveals the predator: sarcoptic mange, red fox predation, and prey populations. Ecology. 75:1042–1049. doi: 10.2307/1939428.
- Lyon K, Cottrell SP, Siikamäki P, Van Marwijk R. 2012. Biodiversity hotspots and visitor flows in Oulanka National Park. Scand J Hospit Tour. 11:100–111. doi: 10.1080/15022250.2011.629909.
- Matysek M, Gwiazda R, Zieba F, Klimecki M, Mateja R, Krzan P. 2020. High tourism activity alters the spatial distribution of Hazel Grouse (Tetrastes bonasia) and predation on artificial nests in a high-mountain habitat. Ornis Fenn. 97(2):53–63. doi: 10.51812/of.133966.
- McGarigal K, Cushman S, Stafford S. 2000. Multivariate statistics for wildlife and ecology research. New York (NY): Springer-Verlag.
- Ménoni E, Magnani Y. 1998. Human disturbance of grouse in France. Grouse News. 15:4–8.
- Metsähallitus. 2022. Development of national park visits and national park network, 2012-2022. https://www.metsa.fi/en/outdoors/visitor-monitoring-and-impacts/.
- Miller JR, Hobbs NT. 2000. Recreational trails, human activity, and nest predation in lowland riparian areas. Landscape Urban Plan. 50:227–236. doi: 10.1016/S0169-2046(00)00091-8.
- Miquet A. 1986. A contribution to the study of the relation between the black grouse (Tetrao tetrix L. Tetraonidae) and winter tourism in Haute-Tarentaise. Acta Oecol (Oecol Appl). 7:325–335.
- Naidoo R, Weaver LC, Stuart-Hill G, Tagg J. 2011. Effect of biodiversity on economic benefits from communal lands in Namibia. J Appl Ecol. 48:310–316.
- Natural Resources Institute Finland. n.d. Grouse censuses. https://luonnonvaratieto.luke.fi/numerotieto/raportit?panel=metsakanalintulaskennat&lang=en.
- Newsome TM, van Eeden LM. 2017. The effects of food waste on wildlife and humans. Sustainability. 9:1269. doi: 10.3390/su9071269.
- Official Statistics of Finland. 2022. Accommodation statistics. Helsinki: Statistics Finland. http://www.stat.fi/til/matk/index_en.html.
- Pickering CM, Harrington J, Worboys G. 2003. Environmental impacts of tourism on the Australian Alps protected areas. Mt Res Dev. 23:247–254. doi: 10.1659/0276-4741(2003)023[0247:EIOTOT]2.0.CO;2.
- Pulliainen E. 1982. Autumn and winter habitat selection in the willow grouse (Lagopus lagopus) in Northern Finland. Suomen Riista. 29:46–52.
- Pulliainen E, Tunkkari PS. 1987. Winter diet, habitat selection and fluctuation of a mountain hare Lepus timidus population in Finnish Forest Lapland. Holarctic Ecol. 10:261–267. doi: 10.1111/j.1600-0587.1987.tb00767.x.
- Puustinen J, Pouta E, Neuvonen M, Sievänen T. 2009. Visits to national parks and the provision of natural and man-made recreation and tourism resources. J Ecotourism. 8(1):18–31. doi: 10.1080/14724040802283210.
- Rolstad J, Wegge P. 1987. Habitat characteristics of capercaillie Tetrao urogallus display grounds in southeastern Norway. Holarctic Ecol. 10:219–229. doi: 10.1111/j.1600-0587.1987.tb00762.x.
- Sachot S, Perrin N, Neet C. 2003. Winter habitat selection by two sympatric forest grouse in western Switzerland: implications for conservation. Biol Conserv. 112(3):373–382. doi: 10.1016/S0006-3207(02)00334-8.
- Saunders DA, Hobbs RJ, Margules CR. 1991. Biological consequences of ecosystem fragmentation: a review. Cons Biol. 5:18–32. doi: 10.1111/j.1523-1739.1991.tb00384.x.
- Seiskari P. 1962. On the winter ecology of the capercaillie, Tetrao urogallus, and black grouse, Lyrurus tetrix, in Finland. Game Res. 22:1–119.
- Siikamäki P, Kangas K, Paasivaara A, Schroderus S. 2015. Biodiversity attracts visitors to national parks. Biodivers Conserv. 24(10):2521–2534. doi: 10.1007/s10531-015-0941-5.
- Siivonen L. 1954. On the short-term fluctuations in numbers of tetraonids. Game Res. 13:1–10.
- Storch I. 1998. Chairman´s column. Grouse News. 15:3–8.
- Storch I. 2000. An overview to population status and conservation of black grouse worldwide. Cah d’Ethologie. 20:153–164.
- Storch I, Leidenberger S. 2003. Tourism, mountain huts and distribution of corvids in the Bavarian Alps, Germany. Wildl Biol. 9:301–308. doi: 10.2981/wlb.2003.018.
- Storch I, Lindström E, de Jounge J. 1990. Diet and habitat selection of the pine marten in relation to competition with the red fox. Acta Theriol (Warsz). 35:311–320. doi: 10.4098/AT.arch.90-36.
- Summers RW, McFarlane J, Pearce-Higgins JW. 2007. Measuring avoidance by capercaillies Tetrao urogallus of woodland close to tracks. Wildl Biol. 13:19–27. doi: 10.2981/0909-6396(2007)13[19:MABCTU]2.0.CO;2.
- Suter W, Roland FG, Hess R. 2002. Capercaillie (Tetrao urogallus) and avian biodiversity: testing the umbrella-species concept. Cons Biol. 16:778–788. doi: 10.1046/j.1523-1739.2002.01129.x.
- Taylor AR, Knight RI. 2003. Wildlife response to recreation and associated visitor perceptions. Ecol Appl. 13:951–963. doi: 10.1890/1051-0761(2003)13[951:WRTRAA]2.0.CO;2.
- Thiel D, Jenni-Eiermann S, Palme R, Jenni L. 2011. Winter tourism increases stress hormone levels in the Capercaillie Tetrao urogallus. Ibis (Lond 1859). 153(1):122–133. doi: 10.1111/j.1474-919X.2010.01083.x.
- Tolvanen A, Kangas K. 2016. Tourism, biodiversity and protected areas e Review from northern Fennoscandia. J Environ Manag. 169:58–66. doi: 10.1016/j.jenvman.2015.12.011.
- Tost D, E S, Jung K, Siebert U. 2020. Impact of tourism on habitat use of black grouse (Tetrao tetrix) in an isolated population in northern Germany. PLoS One. 15:e0238660. doi: 10.1371/journal.pone.0238660.
- Vainio M, Marjakangas A, Lindgren E, Tornberg R, Paaso P. 1997. The winter diet of red fox in eastern Central Finland. Suomen Riista. 43:56–64 (in Finnish with English Summary).
- Watson A, Moss R. 2004. Impacts of ski-development on ptarmigan (Lagopus mutus) at Cairn Gorm, Scotland. Biol Conserv. 116(2):267–275. doi: 10.1016/S0006-3207(03)00197-6.
- World Trade Organization. 2004. World trade report 2004 Exploring the linkage between the domestic policy environment and international trade. https://www.wto.org/english/res_e/booksp_e/anrep_e/world_trade_report04_e.pdf.
- Zeitler A. 2000. Human disturbance, behaviour and spatial distribution of black grouse in skiing areas in the Bavarian Alps. Cah d’éthologie. 2-3-4:381–402.