
 ?Mathematical formulae have been encoded as MathML and are displayed in this HTML version using MathJax in order to improve their display. Uncheck the box to turn MathJax off. This feature requires Javascript. Click on a formula to zoom.
ABSTRACT
In the data stream, the data has non-stationary quality because of continual and inconsistent change. This change is represented as the concept drift in the classifying process of the streaming data. Representing this data drift concept in data stream mining requires pre-labeled samples. However, labeling samples in real-time streaming (online) is not feasible due to resource utilization and time constraints. Therefore, this paper proposes the concept of Probabilistic Concept Drift Detection (PCDD) in the group classifier. PCDD relies on the data stream classification process and provides concept drift without labeled samples. The PCDD model is evaluated through an empirical study on a dataset called Poker-Hand. The study results show a high concept drift detection rate and a significant reduction in false alarms and missed detections compared to contemporary models. Hence, the results of the experimental study prove the accuracy and scalability of the PCDD model.
1. Introduction
Data mining approaches are being used across multiple dynamic and real-time applications, such as financial transactions, sensor networks, mobile communications, etc. However, the scalability of implementing these models in real-time applications, which produce huge volumes of data in short periods of time, is repeatedly challenged. As the information generated in such applications is dynamic and forms data streams with voluminous instances, storing information prior to processing is not feasible. Further, specific applications require instant and real-time solutions. One of the most prominent issues faced by researchers during the mining process is that the data streams in such instances can be non-stationary and witness concept drifts along an infinite length [Citation1,Citation2]. Due to the infinite distance and voluminous characteristics of these data streams, storing information and utilizing historical patterns for model training is not possible in a practical sense. Accordingly, new mechanisms that can process the information through a single scan and employ limited resources, such as storage space and time, are required. In addition, concept drifts are also observed in real-time data streams where the underlying concept changes over time. Concept drift is observed whenever the underlying concept regarding the gathered information alters over some duration of stability. In the absence of drift, it is hard to maintain the balance between the most recent concept and the previous concept, which leads to the stability-plasticity dilemma [Citation3]. These shifts in the inflow data stream significantly impact the precision rates of the classification model because the classifier learns from historical stable data instances. Some of the areas where the concept drift phenomenon is observed include credit card fraud identification, spam recognition, and weather forecasting. Accordingly, the concept of the drift identification process is considered a vital phase [Citation4].
Upon detecting concept drift in the data stream, the fixed classification models can yield inaccurate results [Citation5]. For instance, consumer buying preferences can vary because of weather shifts or economic fluctuations. Accordingly, business intelligence entities and users of statistical prediction methods must identify such concept drifts within data streams in a timely manner. The learning process for the classifier must be a continuous process, as the model classifies future instances based on concepts learned. This continuous learning process ensures that any concept drift occurring in the streams can be tracked. Across various data streams, past thoughts can reoccur [Citation6]. Data filtering methods that are engaged in understanding user preferences [Citation6,Citation7] can be considered an example. The text highlights essential considerations in handling concept drifts within data streams. It emphasizes the need for classifiers capable of adapting to evolving concepts in real-time and performing continuous classification [Citation8]. The classification of concept drifts is categorized by their speed of change, distinguishing between abrupt and gradual shifts between concepts [Citation9]. Additionally, drifts are categorized by the reason for change, distinguishing between genuine label variations and distribution shifts over time [Citation8,Citation10]. Real and virtual concepts often coexist in practical applications, complicating the distinction between these types of drifts [Citation10]. The identification of abrupt or gradual drift depends on the observed nature of the change in the data stream, where sudden shifts characterize sudden drifts and slow changes denote gradual drifts. An optimal classification model must be able to identify the concept drifts occurring in the data streams to minimize the accuracy loss identified during the concept drift. Numerous methods are put forward to determine concept drift, and some of the prominent ones include online algorithms, ensembles, and drift-detection models. Classification of error rates is the foundational concept for most of the drift detection methods [Citation11–15]. Whenever any concept drift occurs, the trained classifier that belongs to the older data chunks becomes incompatible with the upcoming data chunks, and due to this, the classified new chunk's error rate increases. Hence, the error rate became the crucial parameter when detecting the concept drift occurrence. Hoeffeding bound [Citation16,Citation17] is one of the statistical tests used to calculate the error rate changes. An ensemble is one of the major techniques that are used to improve the classified task’s accuracy. The ensemble includes a set of classifiers that merge the votes to predict the class label. The ensemble produces component classifiers based on the training data inputs. Existing classifiers are evaluated each time any new data chunk arrives, and the weights are revised accordingly. Ensemble removes the weakest classifier after the visibility of any new classifier due to the arrival of new data instances [Citation18]. The ensemble has two component classifiers, such as block-based and online. Block-based classifiers work on the fixed data instance blocks that arrive at the data stream, whereas online classifiers operate immediately after the arrival of the latest data instance [Citation19]. Online classifiers work best when drifts occur suddenly because performance is observed after the arrival of each data instance. However, an online classifier is not suitable if the directions are gradual. Furthermore, block-based classifiers perform well in cases of gradual drifts. Any ensemble that has been proposed as of now can perform well with one type of drift only, either gradual or sudden. These studies suggest combining both the features of block-based and online classifiers into a single ensemble so that it will be possible to provide profitable and efficient methods to detect data stream drifts.
Concept drift and data drift are two related phenomena that can affect the performance of machine learning models over time. They both involve changes in the data that the model is applied to, but they differ in the nature of those changes.
Concept drift occurs when the underlying relationship between the input data and the target variable changes over time. This can happen for a number of reasons, such as changes in the user population, changes in the environment, or changes in the underlying technology. For example, a model that is used to predict customer churn may experience concept drift if the factors that influence customer churn change over time.
Data drift, on the other hand, occurs when the distribution of the input data changes over time. This can happen for a number of reasons, such as changes in the data collection process, changes in the way that data is preprocessed, or changes in the underlying data source. For example, a model that is used to predict creditworthiness may experience data drift if the distribution of credit scores changes over time. Table summarizes the key differences between concept drift and data drift.
Table 1. Summarizing the key differences between concept drift and data drift.
2. Articulating the problem and objectives
If the data streams are the source of a certain data, the data will be voluminous and have data-changing issues i.e. concept drift. Ergo, the relevant data distribution according to the latest trends is not practicable. So, in the fields of information mining, ML techniques, patterning, data extraction, the concept drift issue grabbed major attention. For instance, the studies on the adversaries such as credit fraud detection and spam filters. Even in a predictive modeling, knowing the fact that the element to remain undetected, implements the adaptive learning as well as changes the course behavior, still the system focuses on finding the adversary element characteristic patterns. One another context is learning during the process implementation with the hidden parameters present in the system. Among all learning functions methods, the consumer modeling is commonly used. This method allows the system to create consumer information method which changes during the process time and non-observable. Further, the chances of data change points are higher in the tracking functions as well as prognostic perpetuation. This model not only studies the behavior of the system but also entails worsening of the mechanical object during the learning period. The concept drifts involve the issues of computation related to the result occurred from the changes in the course time. There can be infinite changes and irregular changes based on the emerging conditions. So, the systems also require the capacity to adopt the wide range of techniques. Therefore, the model that suits one-size-fit-all does not manage the change point of data, i.e. concept drift effectively. On the other hand, in the real-time scenario, the requirements may differ with regular features. Thus, the condition demands a structured method for characterizing the application tasks to transfer adaptive techniques between the applications.
Here, in this section, there is a discussion on the issues pertaining to concept drift detection and analysis using an example. For instance, each vector size records from a set of vectors
, therefore, vector space
. Then, in continues sequence streaming of these records, consider
the number of records streamed within a specified time limit
along with
a window buffered. In the same way, another example is also taken for the experiment where
is the number of data that are streamed within a particular time capsule
and
as window buffered.
denotes the present time capsule which is the successor of the earlier time capsule. The previous time capsule is taken as
. Now with the two windows samples, the issue of finding the concept drift can be outlined according to the requirement, i.e. whether both windows with buffered records have equal data distribution. The methods that optimize the detection of concept drift are considered as various statistical methods which are frequently utilized for checking the hypothesis. Some posterior methods process after the functioning of the label detection of the classifiers to identify the concept drift depending on the rate of TP, TN, FP and FN. The various categories evince the overhead of computation However, in all frameworks; the posterior methods of classification process aren’t suitable to detect the data changing point. Further, statistical methods are unsuccessful to identify the attribute values momentum, even though a few methods like Wald-Wolfowitz tests optimize the assessment of similar data distribution. For instance, the two attributes of the two windows have similar distribution values; however, the two attributes present in two windows do not have the similar correlation between the values obtained.
Hence, with the problem formulation, the main objective of this paper is to emphasize the introduction of a statistical evaluation model. This model foresees the data change point concerning the distribution similarity as well as attribute value momentum. The task is given to a suitable classifier of ensemble classification background for presenting the work of existing algorithm and contributing new perceptions for further research opportunities.
3. Related literature
The issue of concept drift in incremental learning has seen varied approaches, such as the sliding window technique, ensemble methods, and drift detection mechanisms. Methods like those by Gama [Citation13], Baena-García et al. [Citation20], and Minku [Citation21] integrate drift detection into learning algorithms, updating models based on detected drift. Quantification of concept drift has been a focus, introducing metrics like drift rate [Citation22] and severity [Citation23] to characterize and measure drift occurrences. In the domain of data mining, several classifier models have been proposed for learning and prediction strategies. Logic-based algorithms and decision trees are commonly used due to their interpretability [Citation24]. Other models include Artificial Neural Networks [Citation25], Bayesian networks [Citation26], k-Nearest Neighbors [Citation27], and an adaptation of Particle Swarm Optimization in kernel-based SVM [Citation28]. Challenges arise in handling data streams, especially with the surge of ‘Big Data,’ causing inefficiencies in processing large volumes of diverse information and constraining contemporary models in data processing and classification [Citation28]. Several methodologies have been proposed in computing for handling large datasets and evolving data streams. Domingos et al. adapted the Hoeffding Tree model for effective processing of voluminous data [Citation29], while other works focused on enhancing classifier performance through adaptations of grid patterns and k-Nearest Neighbor algorithms [Citation25], weighted ensemble classifiers to manage data stream drifting [Citation30], feature hashing for word-based data streams [Citation31], and Incremental Linear Discriminant Analysis (ILDA) usage [Citation32]. Adaptive learning has gained prominence due to the demanding learning requirements of data streams [Citation33]. Evolutionary fuzzy systems modeling has seen advancements [Citation34–36], emphasizing progressive learning aligned with evolving fuzzy systems. Additionally, models like Evolving Fuzzy Pattern Trees [Citation37] and those employing cuckoo search for optimal feature selection [Citation38–41] contribute to classification tasks, each exhibiting varying complexities and limitations in computational efficiency and scope range. Recent research in computing explores various techniques for optimization and classification. Clustering methods, notably utilizing cuckoo search, are introduced [Citation40,Citation42], aiming to optimize values and improve k-means complexity, although the resulting clusters show limited purity. Hybrid supervised clustering, emphasized in Ref. [Citation42], focuses on text classification. Optimization techniques like cuckoo search are widely adopted in feature optimization [Citation41], especially in medical image classification, though the integration with the Firefly algorithm increases computational complexity and restricts the scope to medical images. Concept drift, the change in statistical properties over time in data streams, poses challenges in machine learning. Statistical Test for the Equality of Proportions (STEPD), Dynamic Clustering Forest (DCF), Hoeffding Drift Detection Method (HDDM), and Fisher’s Temporal Drift Detector (FTDD) [Citation43] are some of the methods that have been looked into for finding concept drift. These methods use statistical techniques and probabilistic inequalities to find changes and adjust classifiers as needed. The study conducted in Ref. [Citation44] extensively assessed the drift detection methods mentioned earlier. A significant finding from this investigation is that the descriptions of these methods are restricted by the assumption of a one-to-one mapping between measures X and Y. The research emphasizes the limitations of these drift detection approaches, assuming that concept drift does not occur during distinct time periods and relying on the encoding Pt(X) = Pt + 1(X). Consequently, the review of studies failed to provide clarity regarding the most effective features for calculating concept proximity.
Upon scrutinizing different studies in computing, uncertainties persist regarding the optimal features for gauging concept proximity. Various distance functions like Kullback–Leibler divergence [Citation45] and Hellinger distance [Citation46] are considered, offering insights into interpreting negative distances and reciprocal equivalence between points A and B. Concept drift, categorized into different types, remains a focal point in literature. Definitions like sudden drift [Citation47] and [Citation48] often imply distinct time intervals for drift occurrence, assuming abrupt changes, which might not always align with actual concept alterations. Sudden drift, often viewed as a compact, low-magnitude concept, can precede or follow periods of indistinguishable drift, challenging identification. An approach using statistical deviation identification [Citation49] aids in imbalanced data streams by calculating classifier performance metrics’ true positives, true negatives, false positives, and false negatives to manage imbalanced classification tasks, providing more accurate estimates than traditional precision metrics. Simulations show that detection methods like ADWIN [Citation50], which change the size of the window and send signals based on differences in the mean metrics, are reliable in terms of accuracy, storage efficiency, runtime, and user comfort. Several drift detection methods in computing rely on window-based approaches and reactive learning strategies. The Degree-of-Drift (DoD) method [Citation51] calculates distances between data points in current and previous windows, signaling drift if the distance exceeds a threshold. Another approach [Citation52] distinguishes between reactive and stable learning on new and old data, respectively, marking deviations in accuracy as indicators of drift. Like cross-validation, the permutation approach [Citation53] checks accuracy across K bands and keeps track of performance differences between train and test sets to find drift. Studies that use simulations to compare drift detection methods such as DDM, E-DDM, and STEPD show that the permutation method [Citation54] is more accurate and stable. Also, OLINDDA [Citation55] and MINAS use K-means clustering and CluStream to watch how data stream patterns change over time, showing that they can handle tasks with more than one class. To find concept drift, different computer methods, like the Woo ensemble [Citation56], ECS-Miner [Citation57], CoC [Citation58], and Hellinger distance-based approaches [Citation59], use microclusters or divergence assessment across multiple streams. The Woo ensemble finds strange data outside of clusters and re-calibrates the classifier. The CoC and similar studies look for differences between feature sets or concept pairs to find drift. Distance-based detection, while effective, incurs high computational costs for dense features and multivariant concepts. Techniques employing PCA for feature reduction [Citation60,Citation61] offer computational efficiency but may overlook certain data aspects, impacting false negatives and positives. The conclusion highlights the trade-offs between computational efficiency and information loss, urging appropriate technique selection based on data characteristics. One study [Citation62] centers on detecting concept drift in streaming data via the Ensemble Framework for Concept-Drift Detection in Multidimensional Streaming Data (EFCDD). It emphasizes recurrent drift detection, leveraging field value diversity to identify drift instances, and showing scalability and efficiency in concept drift detection. Another research effort [Citation63] investigates evolutionary algorithms (EAs) in association rule mining, specifically multi-objective evolutionary algorithms (MOEAs). It tackles categorical, quantitative, and fuzzy rule mining problems, offering a comparative analysis of computational complexity and practical applications. A separate study [Citation64] delves into real-time outlier detection in prevalent big data streams, discussing challenges due to dynamic distributions and multidimensionality. It reviews methods, addresses key challenges, and suggests future research directions to enhance outlier detection in such contexts. A study [Citation65] explores deep active learning in software defect prediction, utilizing code metric-based models. It incorporates active learning techniques to enhance learning efficiency and addresses data imbalances using methods like Near-Miss under-sampling and KNN. Evaluations on GitHub and Unified Bug Datasets demonstrate significant performance improvements compared to traditional software defect prediction methods. Model-dependent approaches [Citation66,Citation67] implement classifiers monitoring posterior possibility predictions to identify drift accurately. They integrate probabilistic classifiers generating class probabilities, then limiting to class labels. Tracking these shows drift finding as uni-variate stream tracking, superior computation. The Maximum Mean Discrepancy test [Citation68] and StreamKrimp [Citation69] monitor the prediction of the posterior probability [Citation70]. The margin concept uses mean uncertainty and 1-norm SVM over attributes of the dataset. Extending in Ref. [Citation71] identified improved FPR monitoring ‘A-distance’ of histogram deviation metric between benchmark and new margin samples. The MD3 method [Citation72] tracks sufficient margin sample counts, noticing drift under insensitive boundary changes and insensitive if sparse margin samples. These gain importance in detecting lower FPR and FNR. However, probabilistic tool dependence limits attribute value changes. Detecting changes in margin sample distributions triggers drift. Changes in classification margins matter less, though they are robust to these challenges. The DDAL method [Citation73], a drift detection method based on Active Learning, specifically employing the Fixed Uncertainty strategy. DDAL leverages Active Learning techniques to detect drift in an unsupervised manner, utilizing virtual margins measured in terms of classifier confidence. The proposed method eliminates the need to monitor error rates and reduces reliance on labeled samples. Experimental evaluations conducted on seven datasets, both synthetic and real, demonstrate that DDAL achieves comparable or superior error rates compared to supervised baselines (DDM and EDDM), while maintaining similar drift detection rates. When compared to an unsupervised baseline (MD3), DDAL achieves better error and detection rates. Additionally, DDAL’s flexibility allows it to be used with any learning algorithm, expanding upon the limitations of SVM-based methods. Future work aims to explore the use of classifier ensembles comprising both homogeneous and heterogeneous base classifiers to further enhance classification accuracy and uncertainty estimation. The referenced work [Citation49] presents a statistical change detection model specifically tailored for imbalanced data streams, focusing on monitoring multiple performance metrics. It addresses detection rates by considering metrics like true positive rate, true negative rate, false positive rate, and false negative rate derived from the confusion matrix in classification. This model emphasizes addressing class imbalances within the confusion matrix, offering an elaborate description of the imbalance issue’s resolution. Another approach, proposed in Ref. [Citation74], introduces an incremental model utilizing the Exponentially Weighted Moving Average (EWMA), factoring in deviations in average error rates based on standard deviations from the mean. Similarly, a window-based model called Degree of Drift (DOD) in Ref. [Citation75] computes distance maps, identifying drifts by observing parameter-wise increases. In Ref. [Citation52], the Paired Learners approach involves pairs of reactive learners trained on data chunks, evaluating the accuracy difference between them to detect drift. A binary circular list tracks disagreement, signaling drift if the deviation surpasses a set threshold. Additionally, the study [Citation53] presents a modern model reliant on randomly selected training observations for enhanced accuracy prediction in non-stationary windows. This model adapts the classifier model through cross-validation evaluation principles. Continuous monitoring employs K-means data clustering and data evolution in the Online Novelty and Drift Detection Algorithm (OLINDDA) [Citation55]. This approach involves short-term memory queues capturing unknown samples and forming clusters periodically, which are merged with existing clusters or modern pattern cluster pools. Several computational techniques, such as MINAS [Citation76], DETECTNOD [Citation77], ECS Miner [Citation57], Woo Ensemble [Citation56], and GC3 [Citation78], utilize clustering or grid density-oriented algorithms to identify drift in data streams. These methods add outliers or questionable samples to existing clusters, which helps fix concept drift, especially when there are more than two classes to classify. However, these approaches face challenges with dimensional course and distance-based issues, particularly in binary data spaces. Other methods, like COC [Citation58], which uses changes in correlations, and HDDDM [Citation59], which uses Hellinger distance, measure changes in distribution to find address drift. PCA-based methods [Citation60,Citation61] focus on computational efficiency by reducing observed features but are prone to higher false alarm rates compared to alternative multivariate distribution models. These methods reduce false alarm rates very effectively. However, the probabilistic models’ dependence produces implications for the application. The methods also influence the change pattern in further distributions streaming in sequence, which is due to the diversity recommended in the selection of margin samples and a number of factors can cause shifts in data patterns, leading to concept drift, which influences the performance and accuracy of machine learning models over time. Here are a few, along with simple examples:
Seasonal Changes: In retail, consumer preferences change with the seasons. For instance, ice cream sales rise in summer and decrease in winter, inducing a concept drift in purchasing patterns.
Evolving Trends: Consider social media platforms where trending topics change frequently. A sudden shift from discussing one topic to another alters the nature of the data being generated.
Technological Advancements: An upgrade in smartphone technology might change user behavior. For example, a new feature in phones might affect the way users interact with apps, causing a drift in usage patterns.
Market Dynamics: Financial markets are highly dynamic. A sudden economic crisis might alter investors’ behavior, affecting stock market trends and inducing a concept drift in trading data.
Policy Changes: Changes in government policies or regulations can significantly impact data characteristics. For instance, a change in tax laws can affect financial data distributions.
4. Proposed work
The proposed statistical assessment model creates a strategy using the two-tail t-test and the Kolmogorov–Smirnov test to determine the distribution and momentum similarity of the intended values of each attribute in the buffered record of the two windows. The former test is to assess distribution similarity, and the latter is to check the similarity of the momentum. The proposed model handles the gradual drift by detecting the data-changing points through the comparison of the projected attribute values of both distribution and momentum similarities. These projected attribute values are used for training the classifier as well as recording the current window buffering levels. This model has the capability to deal with abrupt as well as recursive drifts because it trains ensemble classifiers on distributions with varied similarity. Further, the proposed model definition, drift detection strategy, and used data structure are explained in the next sections. The block diagram of PCDD is in Figure . Nonstandard abbreviations and acronyms used in the proposed model are given in Table .
Figure 1. The diagram of block PCDD.
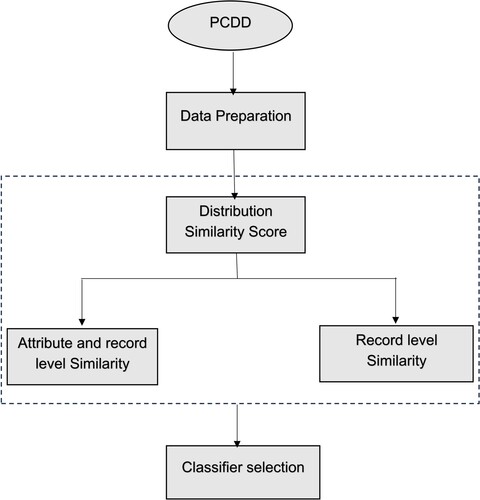
Table 2. Nonstandard abbreviations and acronyms.
4.1. Data structure
For suppose consider denotes a diverse collection of records, where each set
is choose for training the corresponding classifier
listed in the ensemble classifiers of data streaming. Then, each classifier
in the classifier group
is trained using its corresponding training set
. Furthermore, consider that the construction of the training sets
training sets and set of ensemble classifiers is the size
of the set
is similar to ensemble set of classifiers
count
.
4.2. Model definition
The model aims to identify distribution similarity by evaluating the covariance at the attribute level. Additionally, it detects momentum similarity by assessing the covariance at the record level for projected attribute values within two windows. As a result, the process of accurately identifying concept drift from a selected set of buffered records derived from the source data stream is achieved. To facilitate this, the model incorporates two tests: the two-tailed t-test and the K–S test. The former is employed to examine attribute-level covariance, while the latter is used to evaluate record-level covariance. The subsequent sections of the study delve into the specifics of the proposed methods, including their details and validation processes.
4.2.1. Kolmogorov–Smirnov (K–S) test
According to Ref. [Citation79], the Kolmogorov–Smirnov test (K–S test) shows the distribution diversity of the two specified datasets which is depicted in a distance metric form. The distance metric doesn’t need the details of data distribution because it is a de facto of potential distance metric for estimating the diversity distribution. The implementation procedure of Kolmogorov–Smirnov test is as follows:
Here the test is applied to examine whether these vectors distributions have distribution diversity or similarity. So initially, consider the selected two vector values as .
First, estimates the two vectors aggregate values
.
Furthermore, consider that the construction of the training sets in the following way:
Let's now examine the symbols used in the aforementioned process: represents every element of a vector
; in the iteration
represents the previous element cumulative ratio;
represents the total of the values shown in the vector
;
represents the set consisting of all elements cumulative ratios depicted in the vector
. In such a way the above-stated process is used to get the cumulative ratio and to find the value total ratios that are existed in the vectors
in the form of corresponding sets
.
Next, the minimum distance value was found for these ratios obtained from the values in the similar index in vectors using the following method:
Furthermore, now obtain the d-stat, maximum value present in the set
Then obtain the d-critic using the KS-table for the total values of vectors
at a specified degree of probability (p-value) limit
where commonly 0.05 is taken as the value.
In case of obtaining higher d-stat than the d-critic, then it depicts the distribution similarity between the two vectors.
4.2.2. t-Test
One of the major significant features of the study is adapting the t-test. This test checks if the projected values of each attributes is present in both window are similar to the record momentum values. Moreover, the test is done only when the training, as well as target records, demonstrate that both records have similar distribution; and these records with similar distribution are verified by examining the attribute-level covariance also known as distribution similarity check. According to recent statistics [Citation80], the t-test is suitable for determining whether the values of two different sets from similar distributions are significantly different or similar. The works [Citation81,Citation82] propose the optimal use of the t-test. This test t-score is used to verify the record-level discrepancy between the buffered records of the set taken from the source of the data stream and recorded sets which are utilized in training the respective ensemble classifiers.
Further, the t-score represents differences in the values as two varied vectors which are stated in Equation (1):
(1)
(1)
In Equation (1)
represent the mean of the values discern in the respective vectors denoted as
Each value present in the corresponding vectors
Therefore, this test is the ratio of the corresponding vectors, meaning the differences, and the square root of the accumulated average of squared distances.
The significance level [Citation83], referred to as p-value in the t-table [Citation84], is considered. Based on the characteristics of the carriers, the nature and advantage of these carriers are observed. A low probability p-value indicates that the vectors are different in their nature, indicating the optimality of these carriers.
5. Methods
5.1. Record- and attribute-level similarity scale for CDD
The description elucidates the process of employing a strategy to select specific classifiers within an ensemble classification environment through the detection of concept drift within data streams. The classified record sets of ensemble classifier sets are selected from the streamed buffered records within stipulated time capsule. This model evaluates the attributed level distribution similarity as well as buffered records set’s record-level similarity related to every record set which is utilized in training the corresponding classifier to choose the suitable classifier from the sets of ensemble classifiers. Furthermore, based on the obtained similarity scores, the model decide which classifier would categorize the buffered record set. These similarity scores are obtained by conducting the tests which are discussed in the above section. The concept drift detection process follows a specific flow, wherein the KS-Test is utilized to assess the distribution similarity at the attribute level, while the t-test is employed to determine the record-level similarity is as follows:
o For
//now according to the below-mentioned process compute the distribution similarity among records-set
For
o Consider characteristic
o Now assess the distribution similarity of the vectors
o The similarity scores mean value of every characteristics connected with both sets
For
o For
o Now use the t-test to identify the similarities between the two records
Then obtain the similarity average between
o Then the classifiers are listed which are used to train record sets with distribution similarity corresponding to
Now, from the list of classifiers, choose the classifier with the highest scope to record set .
The subsequent section outlines the evaluation of similarity concerning distribution levels and record levels.
5.2 Assessment of distribution similarity score
Here, we focus on the distribution similarity detection algorithmic model. This is performed through the assessment of covariance between every attribute of the buffered record set projected value and the chosen training set attribute value projected for the same attribute. The hypothesis of this model is explained below.
For suppose, represents a set consisting of total attributes (field ids) and it represents the values present in training set’s every record related to set of ensemble classifiers.
trs ← transpose(rs) // interchange the rs records set as trs set which is buffered from data stream within the stipulated time capsule. So, the set trs every row denotes values shown for the respective attribute.
5.3. Similarity level of record – the momentum of attributes assigned with projected values
This section explores the formulation flow that shows the assessment of the ratio at record-level similarity between the two sets: (1) test record set, (2) training record set. These sets are taken from all classifiers enlisted in ensemble classification.
5.4. Selection of classifiers based on concept drift
Enumerate the classifiers that satisfy the criterion of having a distribution similarity ratio greater than or equal to the designated threshold value
(usually 0.6). Subsequently, select the classifier from this list that exhibits the highest record-level similarity ratio.
Here the classifiers are listed where every classifier in the list contains
, distribution similarity ratio that is higher or same as the specified ratio of
, distribution similarity threshold and commonly, the threshold point will be 0.7; has
ration of record-level similarity which is higher or same as the specified ratio of record-level similarity at threshold
point, which is usually 0.6 value. After that, choose the ensemble classifier with the highest record-level similarity ratio from the list of classifiers.
6. Experimental study
6.1. Setup of experimental
The researchers worked out an experiment using both the proposed model PCDD and another modern model, DDAL which is explained in related work. Both of the models are implemented on the Poker-Hand dataset. Then the obtained individual results of both models are compared to verify the performance of the proposed model PCDD for understating the benefits of the PCDD model. To conduct the experimental study, nearly 1,330,115 transactions are selected from the Poker-Hand Dataset. As presented in the work [Citation85], the execution of the two models: PCDD and DDAL were carried out using java; implementation of the statistical analysis happened using the MOA tool.
6.2. Dataset description
The Poker-Hand [Citation86] dataset is one of the popular datasets which is frequently used to conduct experiments in the data stream mining domain. This poker-hand dataset contains 1,025,010 transactions; every transaction involves eleven attributes. The transaction happens in the dataset mentions a set with five playing cards; every card denotes by two attributes; these attributes mention suit as well as rank where the suit represents any one type of cards from types such as Spate, heart, Dimond and star; the rank denotes order number among 13 ranks. From the ten attributes, each attribute denotes ever card of five sets representing the data set’s every transaction; the 11th attribute is predictive showing the poker-hand state which is denoted by 0–9 number ranges. The poker-hand corpus is considered as optimal data set and is often selected simulation phase to generate records flow which contains values of diverse distribution to the features exist in each record.
6.3. Classifier
The process of classification is known to be machine learning method and supervised learning. The parameters such as misclassification rate, sensitivity, process overhead, accuracy, and specificity are referred to as metrics to represent the classifiers performance advantage. Relating to the performance advantage of the classifier presented by AdaBoost [Citation87] demonstrated average performance but depicted optimal performance under the metrics mentioned in the paper. One of the most modern model is used frequently by the relevant research contribution is the AdaBoost classifier. So, the AdaBoost is adapted to the proposed model to do the classification of ensemble classifiers underneath the concept drift detection.
6.4. Performance analysis
Using the five-fold strategy, the total experiments are done on the specified dataset. The specified data set’s all-encompassing records are divided into clusters with the dynamic number. The clusters are formed using x-means [Citation88], a novel clustering algorithm; this algorithm is an enhanced version of k-means that shows the best clusters dynamic number. And again, each partitioned cluster is divided into five partitions; each part has twenty percent records of the cluster in particular. Of all the five parts of every cluster, four parts that consist of 80% are utilized to train the classifier; remaining one part with 20% of the cluster is used to form the classified stream.
As the proposed model uses ensemble classification strategy, the AdaBoost classifiers individual copy is involved with every dataset cluster as well as trained with eighty percent records of the cluster.
Here the objective is clear that the results of classification are utilized only to study the proposed model performance on the concept drift detection. In the case of detecting the drift occur accurately, and then this model allows a suitable classifier from the ensemble classifier structure depicting the accuracy level of equality in the process of classification. The experiment is worked out on the basis of depicting concept correlation between the set of classifiers with two different records: streaming records and training records. To assess the potential for false alarms in the proposed approach, the drift detection rate metric is employed. This metric, defined by Equation (2), shares similarities with the classification rate metric.
(2)
(2)
Likewise, the error rate of the drift detection is considered and also compared. This error rate is measured in a ratio of false drift detected numbers against the attempts of drift detection numbers. It is calculating as:
(3)
(3)
The effectiveness of the proposed model, PCDD, is evaluated by comparing the rate of drift detection achieved from the dataset with the values acquired from the implementation of DDAL using the same datasets.
7. Results and discussion
The experiment was a workout on the poker-hand dataset. Using the clustering process x-means, this dataset is divided into 12 clusters. As 10 (0–9) number of labels are mentioned in the specified, the records of the specified dataset have 10 variant labels. However, as per the PCDD model, the records with a label ‘0,’ and ‘1’ are grouped into three clusters and two clusters in a particular sequence where every cluster contains the same label records. Moreover, each cluster is allotted to assign to a classifier of AdaBoost of the ensemble classification structure. The binary classifier of AdaBoost trains the cluster records; tries to categorize assigned unlabeled records of the classifier underneath the strategy of drift detection to check whether these unlabeled records come under cluster-labeled records. In this process, it is found that 20% records of every cluster fall under unlabeled category; these are formed into set and streamed to check the buffered records which come under the same cluster. This process helps to study the performance advantage of the models in the scenario of abrupt drift detection. Besides, the experiments were done repeatedly to stream the pooled records of unlabeled records. Three-quarters of the buffered records come under a similar group of the cluster. The process is to test the model’s performance in the gradual drift conditions. Likewise, experiments are repeated the third time to stream the records again because the similar cluster buffered several times beneath the random time intervals. This is done to verify the model’s performance in the recursive condition of concept drift.
Tables and show experimental results and are also represented in Figures and . The researcher conducted experiments to test the proposed model potential performance as well as modern model’s performance on detecting the concept drift under the three conditions: (1) sudden drift, (2) gradual drift, and (3) recursive drifts. In Table , the drift detection rate over various drift conditions is mentioned.
Figure 2. The differentiation of the drift detection rates between PCDD and DDAL.
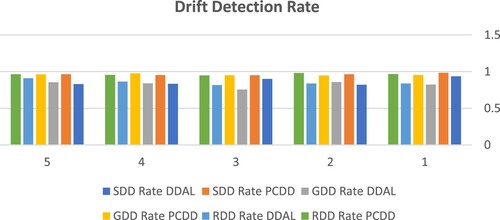
Figure 3. The differentiation of the rates of drift detection error between PCDD and DDAL.
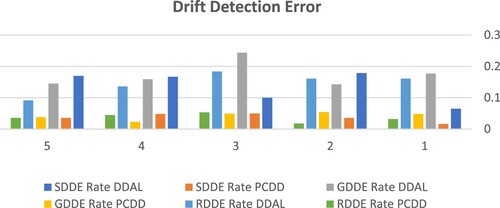
Table 3. The detection rates of concept drift were observed from PCDD and DDAL.
Table 4. The observed rates of drift detection error from both PCDD and DDAL.
For the PCDD model, the average detection rates under three scenarios are 0.96 0.012, in the sudden drift, 0.957
0.011 in the gradual drift, and 0.96
0.011 recursive drift. Hence the statistical results of the experiment demonstrate the performance advantage of the proposed model, DCDD, when compared with the statistics of the DDAL model where 0.86
0.045, 0.82
0.037, and 0.85
0.032.
The detection error rates for sudden, gradual, and recursive drift detection scenarios in the PCDD model demonstrate significantly lower values compared to the corresponding error rates observed in the DDAL model. The PCDD model average detection error rates are 0.037 0.012, in the sudden drift, 0.042
0.011 during gradual drift, and 0.037
0.012 in recursive drift detection; 0.14
0.045, 0.17
0.037, and 0.15
0.031 are DDAL model average detection error rates in the three drift detection situations.
The experimental results conclusively demonstrate that the proposed PCDD model outperforms the DDAL model in all conducted experiments on various datasets. The robustness of the PCDD model is further validated through statistical assessments, including the t-test and Wilcoxon signed rank test, which evaluate the suitability of the obtained drift detection rates across different datasets using a five-fold cross-validation approach. The drift detection rates of both models are treated as vectors and subjected to these statistical tests. Table presents the results of these tests, where a t-value of 9.6981 and a corresponding p-value of <.00001 are obtained, indicating a statistically significant difference between the two vectors. The obtained p-value is less than .01, indicating a high level of significance. Thus, when applying the t-test, the PCDD model, as the first vector, exhibits distinct drift detection rates that align well with the fitness criteria. In comparison to the drift detection rates of DDAL, the PCDD model demonstrates superior fitness.
Table 5. t-Test and Wilcoxon rank-sum test results, alongside corresponding probability values (p-values).
Likewise, between the two vectors, −3.4163 and 0.0006 are Z-value and corresponding p-value. As z-value is less than .01 the p-value, the first vector, PCDD, divergent drift detection rates show fitness when applied with t-test. Comparing the values of the two vectors, PCDD depicts higher than contemporary model DDAL.
Similarly, the vector values for W and corresponding p-values are 0 and <.01. The first PCDD carrier achieved variable concept drift detection rates when applied with the Wilcoxon signed rank test and demonstrated higher fitness compared to the DDAL concept drift detection rates.
8. Conclusion
The study primarily focused on concept drift detection by assigning data stream datasets to the most suitable classifier in the group classification structure for streaming data in contemporary literature. It indicates that modern models consider concept drift detection only in the context of group flow, which consists of sequences of windows. Here, concept drift detection may be probabilistic. These models show significant false alarms while selecting the appropriate classifier from the list of ensemble classifiers in the data streaming classification structure. Furthermore, the drift detection missing rate is not as negligible as the drift evinced is to be sparse. Therefore, after studying the limitations of modern models of concept drift detection, the paper presented the Proposal Concept Drift Detection (PCDD) model that optimizes drift detection on datasets. This model considers a set of records that are utilized to train the classifiers for finding the changing point of the data among the streamed records as well as buffered records in the stipulated time capsule. The PCDD model assesses the distribution level similarity as well as record-level similarity for detecting concept drift in a deterministic manner. The model used statistical assessment scales such as the Kolmogorov–Smirnov test and the t-test to assess the distribution level similarity, where the former demonstrates the distribution level similarity and the latter shows the record-level similarity. This paper conducted an experimental study on the Poker-Hand dataset for concept drift detection. The poker-hand dataset is divided into five different data sets. The simulation results demonstrate the accuracy of concept drift detection as well as the robustness and scalability of the PCDD model compared to the results obtained from the contemporary DDAL model. As the work carried on the binary classifier in data streaming ensemble classification, it can be further studied to find the concept drift with a single classifier in the data streaming classification. Also, using fitness metrics like soft computing techniques in the proposed Deterministic Concept Drift Detection can be studied for optimization of concept drift detection.
Disclosure statement
The work described has not been published previously and is not under consideration for publication elsewhere. And not the entire paper or any substantial part of its content been submitted to any journal.
Additional information
Notes on contributors
Nail Adeeb Ali Abdu
Nail Adeeb Ali Abdu is a lecturer at the Department of Computer Science, University of Science and Technology, Taiz, Yemen. He is currently pursuing PhD studies at the University of Science and Technology Yemen (UST) in the Department of Information Technology. He received his bachelor's in computer science from the University of Science and Technology, Sanaa, Yemen, and his Master of Computer Information Systems from the Arab Academy for Banking and Financial Sciences, Sana'a, Yemen.
Khaled Omer Basulaim
Professor Dr. Khaled Omer Basulaim, a faculty member in the Information Technology Engineering Department, College of Engineering, University of Aden, has been a professor of computer engineering and information technology since 1995.
References
- Khamassi I, Sayed-Mouchaweh M, Hammami M, et al. Discussion and review on evolving data streams and concept drift adapting. Evol Syst. 2018;9(1):1–23. doi:10.1007/s12530-016-9168-2
- Demšar J, Bosnić Z. Detecting concept drift in data streams using model explanation. Expert Syst Appl. 2018;92:546–559. doi:10.1016/j.eswa.2017.10.003
- Rossi ALD, Souza BFD, Soares C, et al. A guidance of data stream characterization for meta-learning. Intell Data Anal. 2017;21(4):1015–1035. doi:10.3233/IDA-160083
- Cabral DRdL, Barros RSMd. Concept drift detection based on Fisher’s exact test. Inf Sci (Ny). 2018;442–443:220–234. doi:10.1016/j.ins.2018.02.054
- Jadhav A, Deshpande L. An efficient approach to detect concept drifts in data streams. In: Proceedings – 7th IEEE International Advanced Computing Conference, IACC 2017; 2017. p. 28–32.
- Kelly MG, Hand DJ, Adams NM. The impact of changing populations on classifier performance. Proc Fifth ACM SIGKDD Int Conf Knowl Discov Data Min – KDD ‘99. 1999;32(2):367–371. doi:10.1145/312129.312285
- Masud MM, Gao J, Khan L, et al. Integrating novel class detection with classification for concept-drifting data streams. In: Lecture notes in computer science (including subseries Lecture notes in artificial intelligence and Lecture notes in bioinformatics); Vol. 5782; LNAI (PART 2); 2009. p. 79–94.
- Kolter JZ, Maloof MA. Dynamic weighted majority: an ensemble method for drifting concepts. J Mach Learn Res. 2007;8(91):2755–2790.
- Delany SJ, Cunningham P, Tsymbal A, et al. A case-based technique for tracking concept drift in spam filtering. Appl Innov Intell Syst. 2005; XII:3–16.
- Tsymbal A, Pechenizkiy M, Cunningham P, et al. Dynamic integration of classifiers for handling concept drift. Inf Fusion. 2008;9(1):56–68. doi:10.1016/j.inffus.2006.11.002
- Widmer G, Kubat M. Learning in the presence of concept drift and hidden contexts. Mach Learn. 1996;23(1):69–101.
- Tsymbal A. The problem of concept drift : definitions and related work. Technical report. Dublin: Department of Computer Science, Trinity College Dublin; 2004.
- Gama J, Castillo G. Learning with local drift detection. In: Lecture notes in computer science (including subseries Lecture notes in artificial intelligence and Lecture notes in bioinformatics); Vol. 4093; LNAI; 2006. p. 42–55.
- Aggarwal CC, Yu PS. On clustering techniques for change diagnosis in data streams. In: Lecture notes in computer science (including subseries Lecture notes in artificial intelligence and Lecture notes in bioinformatics); Vol. 4198; LNAI; 2006. p. 139–157.
- Rutkowski L, Jaworski M, Pietruczuk L, et al. A new method for data stream mining based on the misclassification error. IEEE Trans Neural Netw Learn Syst. 2015;26(5):1048–1059. doi:10.1109/TNNLS.2014.2333557
- Tchicaya AF, Wognin SB, Aka INA, et al. Conditions d’exposition professionnelle des secrétaires d’une entreprise du secteur privé aux douleurs du rachis et des membres supérieurs à Abidjan, Côte d’Ivoire. Arch Mal Prof Environ. 2015;76(4):345–351. doi:10.1016/j.admp.2015.01.007
- Frías-Blanco I, Campo-Ávila JD, Ramos-Jiménez G, et al. Online and non-parametric drift detection methods based on Hoeffding’s bounds. IEEE Trans Knowl Data Eng. 2015;27(3):810–823. doi:10.1109/TKDE.2014.2345382
- Zhu X, Zhang P, Lin X, et al. Active learning from stream data using optimal weight classifier ensemble. IEEE Trans Syst Man Cybern B Cybern. 2010;40(6):1607–1621. doi:10.1109/TSMCB.2010.2042445
- Abdu NAA, Basulaim KO. A review of tracking concept drift detection in machine learning. Recent Trends Comput Sci. 2023: 36–41. doi:10.1201/9781003363781-6
- Baena-García M, Campo-’ Avila JD, Fidalgo R, et al. Early drift detection method. 4th ECML PKDD Int Work Knowl Discov Data Streams. 2006;6:77–86.
- Minku LL, Yao X. DDD: A new ensemble approach for dealing with concept drift. IEEE Trans Knowl Data Eng. 2012;24(4):619–633. doi:10.1109/TKDE.2011.58
- Sun Y, Tang K, Zhu Z, et al. Concept drift adaptation by exploiting historical knowledge. IEEE Trans Neural Netw Learn Syst. 2018;29(10):4822–4832. doi:10.1109/TNNLS.2017.2775225
- Sidhu P, Bhatia M. Online approach to handle concept drifting data streams using diversity. Int Arab J Inf Technol (IAJIT). 2017;14(3).
- Murthy SK. Automatic construction of decision trees from data: a multi-disciplinary survey. Data Min Knowl Discov. 1998;2(4):345–389. doi:10.1023/A:1009744630224
- Law YN, Zaniolo C. An adaptive nearest neighbor classification algorithm for data streams. In: Lecture notes in computer science (including subseries Lecture notes in artificial intelligence and Lecture notes in bioinformatics); Vol. 3721; LNAI; 2005. p. 108–120.
- Friedman N, Geiger D, Goldszmidt M. Bayesian network classifiers. Mach Learn. 1997;29(2–3):131–163. doi:10.1023/A:1007465528199
- Yu Z, Chen H, Liuxs J, et al. Hybrid κ-nearest neighbor classifier. IEEE Trans Cybern. 2016;46(6):1263–1275. doi:10.1109/TCYB.2015.2443857
- Suykens JAK, Vandewalle J. Least squares support vector machine classifiers. Neural Process Lett. 1999;9(3):293–300. doi:10.1023/A:1018628609742
- Domingos P, Hulten G. Mining high-speed data streams. In: Proceedings of the Sixth ACM SIGKDD International Conference on Knowledge Discovery and Data Mining; 2000. p. 71–80.
- Wang H, Fan W, Yu PS, et al. Mining concept-drifting data streams using ensemble classifiers. In: Proceedings of the ACM SIGKDD International Conference on Knowledge Discovery and Data Mining; 2003, p. 226–235.
- Wang J, Peng J, Liu O. A classification approach for less popular webpages based on latent semantic analysis and rough set model. Expert Syst Appl. 2015;42(1):642–648. doi:10.1016/j.eswa.2014.08.013
- Pang S, Ozawa S, Kasabov N. Incremental linear discriminant analysis for classification of data streams. IEEE Trans Syst Man Cybern B Cybern. 2005;35(5):905–914. doi:10.1109/TSMCB.2005.847744
- Gama J, Gaber MM, editors. Learning from data streams: processing techniques in sensor networks. Springer Science & Business Media; 2007.
- Angelov P. Evolving Takagi-Sugeno fuzzy systems from streaming data (eTS+). Evol Intell Syst Methodol Appl. 2010:21–50. doi:10.1002/9780470569962.ch2
- Lughofer E. Evolving fuzzy systems methodologies, advanced concepts and applications. Stud Fuzziness Soft Comput. 2011;266:1–478. doi:10.1007/978-3-642-18087-3_1
- Senge R, Hüllermeier E. Top-down induction of fuzzy pattern trees. IEEE Trans Fuzzy Syst. 2011;19(2):241–252. doi:10.1109/TFUZZ.2010.2093532
- Shaker A, Senge R, Hüllermeier E. Evolving fuzzy pattern trees for binary classification on data streams. Inf Sci (Ny). 2013;220:34–45. doi:10.1016/j.ins.2012.02.034
- Jiang P, Liu F, Song Y. A hybrid forecasting model based on date-framework strategy and improved feature selection technology for short-term load forecasting. Energy. 2017;119:694–709. doi:10.1016/j.energy.2016.11.034
- Yang X-S, Deb S. Cuckoo search for optimization and computational intelligence. In: Encyclopedia of information science and technology. 3rd ed. IGI global; 2015. p. 133–142.
- Saida IB, Kamel N, Omar B. A new hybrid algorithm for document clustering based on cuckoo search and k-means. Adv Intell Syst Comput. 2014;287:59–68. doi:10.1007/978-3-319-07692-8_6
- Wozniak M, Polap D, Kosmider L, et al. A novel approach toward x-ray images classifier. In: Proceedings – 2015 IEEE Symposium Series on Computational Intelligence, SSCI 2015; 2015. p. 1635–1641.
- Onan A. Hybrid supervised clustering based ensemble scheme for text classification. Kybernetes. 2017;46(2):330–348. doi:10.1108/K-10-2016-0300
- Agrahari S, Singh AK. Concept drift detection in data stream mining: a literature review. J King Saud Univ Comput Inf Sci. 2022;34(10):9523–9540. doi:10.1016/j.jksuci.2021.11.006
- Kosina P, Gama J, Sebastio R. Drift severity metric. Front Artif Intell Appl. 2010;215:1119–1120.
- Lovric M. International encyclopedia of statistical science. Berlin: Springer Heidelberg; 2011.
- Hoens TR, Chawla NV, Polikar R. Heuristic updatable weighted random subspaces for non-stationary environments. In: Proceedings – IEEE International Conference on Data Mining, ICDM; 2011. p. 241–250.
- Dongre PB, Malik LG. A review on real time data stream classification and adapting to various concept drift scenarios. In: Souvenir of the 2014 IEEE International Advance Computing Conference, IACC 2014; 2014. p. 533–537.
- Brzezinski D, Stefanowski J. Reacting to different types of concept drift: the accuracy updated ensemble algorithm. IEEE Trans Neural Netw Learn Syst. 2014;25(1):81–94. doi:10.1109/TNNLS.2013.2251352
- Wang H, Abraham Z. Concept drift detection for streaming data. Proceedings of the International Joint Conference on Neural Networks 2015; 2015 Sept.
- Bifet A, Gavaldà R. Learning from time-changing data with adaptive windowing. In: Proceedings; 2007. p. 443–448.
- Fenza G, Gallo M, Loia V, et al. Concept-drift detection index based on fuzzy formal concept analysis for fake news classifiers. Technol Forecast Soc Change. 2023;194:122640. doi:10.1016/j.techfore.2023.122640
- Bach SH, Maloof MA. Paired learners for concept drift. In: Proceedings – IEEE International Conference on Data Mining, ICDM; 2008. p. 23–32.
- Harel M, Mannor S, El-Yaniv R, et al. Concept drift detection through resampling. International Conference on Machine Learning, PMLR; 2014. p. 1009–1017.
- Ijcai RK. A study of cross-validation and bootstrap for accuracy estimation and model selection. researchgate.net; 1995.
- Spinosa EJ, Carvalho APDLFD, Gama J. OLINDDA: a cluster-based approach for detecting novelty and concept drift in data streams. In: Proceedings of the ACM Symposium on Applied Computing; 2007. p. 448–452.
- Ryu JW, Kantardzic MM, Kim MW, et al. An efficient method of building an ensemble of classifiers in streaming data. In: Lecture notes in computer science (including subseries Lecture notes in artificial intelligence and Lecture notes in bioinformatics); Vol. 7678; LNCS; 2012. p. 122–133.
- Masud M, Gao J, Khan L, et al. Classification and novel class detection in concept-drifting data streams under time constraints. IEEE Trans Knowl Data Eng. 2011;23(6):859–874. doi:10.1109/TKDE.2010.61
- Lee J, Magoulès F. Detection of concept drift for learning from stream data. In: Proceedings of the 14th IEEE International Conference on High Performance Computing and Communications, HPCC-2012 – 9th IEEE International Conference on Embedded Software and Systems, ICESS 2012; 2012. p. 241–245.
- Ditzler G, Polikar R. Hellinger distance based drift detection for nonstationary environments. In: IEEE SSCI 2011: Symposium Series on Computational Intelligence – CIDUE 2011: 2011 IEEE Symposium on Computational Intelligence in Dynamic and Uncertain Environments; 2011. p. 41–48.
- Kuncheva LI, Faithfull WJ. PCA feature extraction for change detection in multidimensional unlabeled data. IEEE Trans Neural Netw Learn Syst. 2014;25(1):69–80. doi:10.1109/TNNLS.2013.2248094
- Qahtan A, Alharbi B, Wang S, et al. A PCA-based change detection framework for multidimensional data streams. In: Proceedings of the ACM SIGKDD International Conference on Knowledge Discovery and Data Mining 2015; 2015 Aug. p. 935–944.
- Prasad KSN, Rao AS, Ramana AV. Ensemble framework for concept-drift detection in multidimensional streaming data. Int J Comput Appl. 2022;44(12):1193–1200. doi:10.1080/1206212X.2020.1711617
- Badhon B, Kabir MMJ, Xu S, et al. A survey on association rule mining based on evolutionary algorithms. Int J Comput Appl. 2021;43(8):775–785. doi:10.1080/1206212X.2019.1612993
- Chen L, Gao S, Cao X. Research on real-time outlier detection over big data streams. Int J Comput Appl. 2020;42(1):93–101. doi:10.1080/1206212X.2017.1397388
- Feyzi F, Daneshdoost A. Studying the effectiveness of deep active learning in software defect prediction. Int J Comput Appl. 2023;45(7–8):534–552. doi:10.1080/1206212X.2023.2252117
- Lindstrom P, Namee BM, Delany SJ. Drift detection using uncertainty distribution divergence. Evolving Systems. 2013;4(1):13–25. doi:10.1007/s12530-012-9061-6
- Žliobaite I. Change with delayed labeling: when is it detectable? In: Proceedings – IEEE International Conference on Data Mining, ICDM; 2010. p. 843–850.
- Gretton A, Borgwardt K, Rasch MJ, et al. A Kernel method for the two-sample problem. arXiv:0805.2368; 2008.
- Leeuwen MV, Siebes A. StreamKrimp: detecting change in data streams. In: Lecture notes in computer science (including subseries Lecture notes in artificial intelligence and Lecture notes in bioinformatics); Vol. 5211; LNAI (PART 1); 2008. p. 672–687.
- Dries A, Rückert U. Adaptive concept drift detection. Stat Anal Data Min Asa Data Sci J. 2009;2(5–6):311–327. doi:10.1002/sam.10054
- Dredze M, Oates T, Piatko C. We’re not in Kansas anymore: detecting domain changes in streams. In: Proceedings of the 2010 Conference on Empirical Methods in Natural Language Processing; 2010. p. 585–595.
- Sethi TS, Kantardzic M. Don’t pay for validation: detecting drifts from unlabeled data using margin density. Procedia Comput Sci. 2015;53(1):103–112. doi:10.1016/j.procs.2015.07.284
- Costa AFJ, Albuquerque RAS, Santos EMD. A drift detection method based on active learning. Proceedings of the International Joint Conference on Neural Networks; 2018 Jul.
- Ross GJ, Adams NM, Tasoulis DK, et al. Exponentially weighted moving average charts for detecting concept drift. Pattern Recognit Lett. 2012;33(2):191–198. doi:10.1016/j.patrec.2011.08.019
- Sobhani P, Beigy H. New drift detection method for data streams. In: Lecture notes in computer science (including subseries Lecture notes in artificial intelligence and Lecture notes in bioinformatics); Vol. 6943; LNAI; 2011. p. 88–97.
- Faria ER, Gama J, Carvalho APLF. Novelty detection algorithm for data streams multi-class problems. In: Proceedings of the ACM Symposium on Applied Computing; 2013. p. 795–800.
- Hayat MZ, Hashemi MR. A DCT based approach for detecting novelty and concept drift in data streams. In: Proceedings of the 2010 International Conference of Soft Computing and Pattern Recognition, SoCPaR; 2010. p. 373–378.
- Sethi TS, Kantardzic M, Hu H. A grid density based framework for classifying streaming data in the presence of concept drift. J Intell Inf Syst. 2016;46(1):179–211. doi:10.1007/s10844-015-0358-3
- Ghasemi A, Zahediasl S. Normality tests for statistical analysis: a guide for non-statisticians. Int J Endocrinol Metab. 2012;10(2):486. doi:10.5812/ijem.3505
- Guyon I, De AM. An introduction to variable and feature selection André Elisseeff. J Mach Learn Res. 2003;3:1157–1182.
- Üniversitesi A, Ve B, Dergisi T, et al. A modified T-score for feature selection. Anadolu Üniversitesi Bilim Ve Teknoloji Dergisi A Uygulamalı Bilimler ve Mühendislik. 2016;17(5):845–852.
- Kummer O, Savoy J. Feature selection in sentiment analysis. In: Proceedings of the 9th French Information Retrieval Conference. p. 273–284.
- Riedel T, Sahoo PK. Mean value theorems and functional equations. World Scientific; 1998.
- Gerstman B. t-table; 2007. Available from: www.sjsu.edu/faculty/gerstman/StatPrimer/t-table.pdf
- Ihaka R, Gentleman R. R: a language for data analysis and graphics. J Comput Graph Stat. 1996;5(3):299–314.
- Lichman M. UCI machine learning repository; 2013. Available from: https://archive.ics.uci.edu/ml/datasets/Poker+Hand
- An TK, Kim MH. A new diverse AdaBoost classifier. Proc Int Conf Artif Intell Comput Intell AICI 2010. 2010;1:359–363.
- Koonsanit K, Jaruskulchai C. X-means: extending K-means with efficient estimation of the number of clusters. Proc 17th Int Conf Machine Learn. 2000;E95-D(5):727–734.