
Abstract
Depending on the mode of nutrition exploitation, major fungal guilds are distinguished as ectomycorrhizal and saprotrophic fungi. It is generally known that diverse environmental factors influence fungal communities; however, it is unclear how fungal communities respond differently to environment factors depend on fungal guilds. In this study, we investigated basidiomycetes communities associated with Quercus mongolica using 454 pyrosequencing. We attempted to detect guild pattern (ectomycorrhizal or saprotrophic fungal communities) by comparing the influence of geography and source (root and surrounding soil). A total of 515 mOTUs were detected from root (321) and soil (394) of Q. mongolica at three sites of Mt. Jeombong in Inje County. We found that patterns of diversity and community structure were different depending on the guilds. In terms of alpha diversity, only ectomycorrhizal fungi showed significant differences between sources. In terms of community structure, however, geography significantly influenced the ectomycorrhizal community, while source appeared to have a greater influence on the saprotrophic community. Therefore, a guild-based view will help to elucidates novel features of the relationship between environmental factors and fungal communities.
1. Introduction
Fungal communities play several important ecological roles in forest ecosystems, especially through their interactions with plants. These interactions, which can be commensal, mutualistic, and pathogenic, can profoundly influence plants in different ways, especially with respect to growth and general health [Citation1,Citation2]. Fungal guilds are distinguished from communities in that guilds are defined by similarities in resource exploitation [Citation3]. Ectomycorrhizal fungi (EMF) and saprotrophic fungi (SPF) are especially important fungal guilds because they are key contributors to forest soil ecosystems. EMF and plants have a mutualistic relationship, with the fungus providing inorganic nutrients such as phosphorous (and often indirectly facilitating the transfer of nitrogen via symbiotic bacteria) in exchange for fixed carbon compounds (e.g. carbohydrates) [Citation4]. SPF, on the other hand, decompose wood and litter, returning available nutrients to the soil [Citation5]. Most plant–fungal interaction studies have focused on EMF; however, the importance of SPF in plant physiology through nutrient turn-over in soil may be equally important [Citation6]. A better understanding of the diversity and distribution of fungal communities within both EMF and SPF guilds will improve our general understanding of forest ecology.
Fungal community structure is affected by both abiotic and biotic factors. Many abiotic factors that influence fungal community structure (e.g. temperature, climate, and soil physiochemistry) are associated with geographical variation [Citation7–9]. Biotic factors, such as competition among fungal species and host plant physiology, are also important in shaping fungal community structure, especially in EMF [Citation9]. While the factors that influence forest fungal communities are extremely complex, important insights can be gained by focusing on differences among and between fungal guilds. For example, EMF species appear to be more heavily influenced by host availability than SPF species. In addition, a recent study demonstrated that plant diversity differentially effects fungal guilds (EMF and SPF) [Citation10]. In general, however, little is known about guild patterns within fungal communities because most studies have focused on a single guild.
Oak trees (Quercus spp.) provide important ecological services to forest ecosystems [Citation11] and are an important source of wood and biocompounds for humans [Citation12], which environmental and economic importance of Quercus species led to several studies that focused on associated fungal communities [Citation13–19]. Most of these studies, however, focused only on EMF communities, and other fungal guilds associated with Quercus remain poorly understood. Quercus mongolica (Mongolian oak) is common in northeastern Asian forests, and is the dominant deciduous tree in forests in Korea, China, Japan, and Russia [Citation20]. Fungal communities associated with Q. mongolica have previously been investigated using high throughput sequencing of soil samples [Citation21,Citation22]. However, a recent study showed little overlap between soil and root fungal communities (just 27% of OTUs in soil community) [Citation23]. This result suggests that the soil fungal community may not adequately represent the overall fungal community associated with Q. mongolica, and that both root and soil samples should be sampled in order to fully understand fungal guilds associated with Q. mongolica.
In this study, we investigated guild related community patterns associated with Q. mongolica with samples from both the root system and surrounding soil using 454 pyrosequencing. We focused on the basidiomycetes community because of their relative importance in forest ecology as both EMF and SPF [Citation24]. This strategy also has the advantage of increasing sequencing depth, thus improving the chances of discovering rare taxa. Describing the composition of key fungal guilds of Q. mongolica will increase our understanding of fungal–plant interactions and inform oak forest management and conservation.
2. Materials and methods
2.1. Sampling site information and sample collection
We collected soil and root samples of Q. mongolica at Mt. Jeombong in Inje, Republic of Korea (38° 2′ 11″N, 128° 28′ 21″E). This mountain is in the southern area of Seorak-san National Park which has been designated by Biosphere Reserves as a part of the Man and Biosphere Project of the United Nations Educational, Scientific and Cultural Organization (UNESCO) [Citation25]. The well conserved forest of Mt. Jeombong is a mixed deciduous forest composed primarily of Acer, Carpinus, Fraxinus, Quercus, Abies, and Pinus tree species [Citation26]. Access to Mt. Jeombong is restricted, thus basidiomycetes communities associated with Q. mongolica are relatively intact and free of human disturbance. We choose three forest patches (50 m × 50 m) where Q. mongolica was dominant and separated by c.a. 5 km. Sampling was conducted twice, once in dry season in spring (May) and again in high humidity and hot season in late summer (August), 2014. Six trees were selected randomly (more than 5 m interval) in each patch for soil and root collection. After removing litter layers, we collected soil samples under the tree from the top soil where lateral root existed. We also collected samples of lateral roots (more than 30 cm length) connected with ectomycorrhizae. Sampling was permitted by the National Park Authority. A total of 36 pairs of soil and root samples were collected and stored at 4 °C prior to DNA extraction.
2.2. DNA extraction, PCR amplification, and pyrosequencing
Genomic DNA was extracted in triplicate from 250 mg of soil sample using the PowerSoil DNA isolation kit (MoBio, Carlsbad, CA, USA) following the manufacturer’s instructions. Roots were rinsed carefully with distilled water until all soil and debris were removed before DNA extraction. After drying, lateral roots were divided into 10 sections (c.a. 2 cm) and ground using a mortar and pestle with 2 ml of CTAB buffer. Then genomic DNA was extracted using a modified CTAB method [Citation27].
We used the basidiomycetes specific primer set ITS1F and ITS4B [Citation28] for primary PCR amplification. Sequencing adapters and multiple index delimitation (MID) sequences were attached to ITS1F and ITS4 primers and a second PCR was carried out for pyrosequencing. PCR amplifications were performed using C1000 thermal cycler (Bio-Rad, Richmond, CA, USA) under the following conditions: 94 °C for 5 min, followed by 30 cycles of 94 °C for 30 s, 55 °C for 30 s, 72 °C for 40 s, and 72 °C for 5 min for final extension. PCR products were checked using 1% agarose gel electrophoresis and purified using the Expin PCR Purification Kit (GeneAll, Korea). Pyrosequencing was conducted using the 454 GS FLX plus platform at Macrogen (Seoul, Korea) in the reverse direction. Sequence data were deposited in the NCBI Sequence Read Archive (SRA) (PRJNA362705).
2.3. Bioinformatic analysis
Raw data from pyrosequencing were filtered using QIIME v1.8.0 [Citation29]. Molecular operational taxonomic units (mOTUs) were clustered (98.5% similarity and single linkage methods), and chimeric sequences were filtered using Usearch 5.2.236 [Citation30] in QIIME. In each mOTU, the most abundant sequence was chosen as a representative, which were then used for taxonomic assignment using BLAST against the UNITE v7.1 (22.08.2016) database [Citation31] as well as sequences from the Seoul National University Fungal Collection. We assigned mOTUs to the genus level. After removing non-fungal and singleton mOTUs, we rarified the number of sequences to the minimum reads number for further analysis. Alpha diversity indices and community distance (Bray–Curtis) were calculated in QIIME. Further statistical tests (ANOVA, and Constrained Analysis of Principal Coordinates [CAP]) were conducted in R [Citation32], and graphical plots (boxplot, barplot, PCoA plot) were drawn using ggplot2 [Citation33] and phyloseq [Citation34] packages in R. Fungal guild was determined using FUNGuild [Citation35], and classified as EMF or SPF. When mOTUs were not classified to EMF or SPF by FUNGuild, we attempted classification refinement by BLAST searching sequences in GenBank. If the BLAST search matched “ectomycorrhizal fungi” with high sequence similarity (>95%), we classified the mOTUs as EMF.
3. Results
3.1. Basidiomycetes diversity and guild classification associated with Q. mongolica
We obtained 107,336 sequence reads, and used 90,408 reads for analysis after filtering. In order to normalize the data, we rarified the sequences of all samples to 420 reads. Five samples (three root and two soil samples) were discarded from the analysis because of the low number of reads. All samples exhibited high Good's coverage (0.96–1.00), thus, we determined that the sequencing effort was sufficient for further analysis. All mOTUs belonged to Agaricomycetes except Cryptococcus (Tremellomycetes). Among 515 mOTUs detected in this study, 473 mOTU were classified into 53 basidiomycetes genera (two classes, 15 orders, and 30 families) and the other 42 mOTU were not classified. Three hundred and twenty-one mOTUs and 394 mOTUs were found in root and soil, respectively.
FUNGuild classified 368 mOTUs (31 genera) as EMF and 104 mOTUs (21 genera) as SPF. In terms of relative abundance, the major EMF genera found in both sample types (soil and root) were Sebacina (28.9%), Russula (12.7%), Tomentella (7.5%), Amphinema (4.2%), Cortinarius (3.5%), and Amanita (3.4%) (). Cryptococcus (6.2%) was the most abundant SPF genus found in both sample types, followed by Mycena (4.9%), Marasmiellus (2.6%), Marasmius (1.8%), Galerina (1.4%), and Trechispora (1.4%). In both root and soil samples, the proportion of EMF was higher than that of SPF, while there was no difference in guild proportion depending on sampling site and season (). In a comparison of all basidiomycetes communities, 33 genera were found in both sample sources, while eight genera were found only in root samples and 12 genera were found only in soil (). Among the three sampling sites and both guilds, 15 genera were commonly found in all root communities, and considered as core genera (; ) and, based on relative abundance, Sebacina, Russula, Tomentella, Cryptococcus, and Mycena were the major core genera associated with Q. mongolica (). Most genera were overlapped together between spring and summer (). Hygrophorus was the only major EMF genus found exclusively in one type of sample source and season (soil in summer season, ).
Figure 1. Frequency of 15 core basidiomycetes genera found in the root and soil.
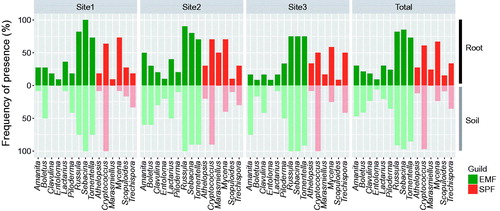
Table 1. Relative abundanceTable Footnotea (%) and mOTU number of basidiomycetes genera (53 genera, 515 mOTU) associated with Quercus mongolica.
Among the 15 core genera, nine were EMF and six were SPF. In root samples, the major EMF genus was Sebacina, which was more than twice as abundant as the next most common genus, Russula (relative abundance: 25.5% and 10.4%, respectively). The next most common EMF genera found in root samples were Tomentella (6.6%) and Cortinarius (3.9%). In soil samples, Sebacina was also dominant, and more than twice as abundant, as Russula (relative abundance: 32.1% and 14.8%, respectively). The next most common EMF genera found in soil samples were Tomentella (8.3%), Amphinema (5.9%), and Amanita (5.5%) (). In terms of presence frequency, the core EMF was well represented in both root and soil samples with similar presence frequency ().
Of the six major SPF genera, all were detected in root samples, and 50% were detected in both soil and root samples. Mycena and Marasmiellus were the dominant SPF genera in root samples (relative abundance: 9.2% and 5.3%, respectively), followed by Marasmius (3.7%), Cryptococcus (3.1%), Galerina (2.9%), and Trechispora (2.5%). In soil, Cryptococcus was by far the most abundant genus with a relative abundance (9.2%) of more than an order of magnitude higher than the other two genera, Mycena and Trechispora (0.6% and 0.5%, respectively) (). With the exception of Trechispora, core SPF genera did not exhibit consistent presence frequency between the root and soil samples. Athelopsis, Mrasmiellus, Mycena, and Scopuloides were more frequently detected in roots, while Cryptoccous was more common in soil samples ().
3.2. Analysis of diversity and community structure
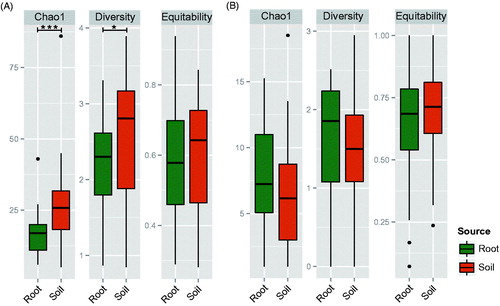
The number of mOTUs (p = .003), chao1 richness (p = .016), and Shannon’s diversity (p = .031) were significantly higher in the soil than in root samples, Shannon’s evenness was not significant (p = .249). No indices were significantly different between root and soil samples with the exception of Shannon’s diversity between sampling season (p = .031). When we separated the fungal communities by guild, we found guild specific difference in alpha diversity. In EMF communities, indices of richness (chao1) (p < .001) and diversity (Shannon) (p = .027) were significantly higher in soil than in root samples, while evenness was not significantly different (p = .773) (). However, none of the diversity indices in EMF communities were significantly different by sampling site and season. In SPF communities, none of the diversity was different in any category (source, sampling site, and season) ().
Figure 2. Alpha diversity of (A) EMF and (B) SPF community in the root and soil of Quercus mongolica. Significance of difference was tested using Wilcoxon test (*: p < .05, ***: p < .001).
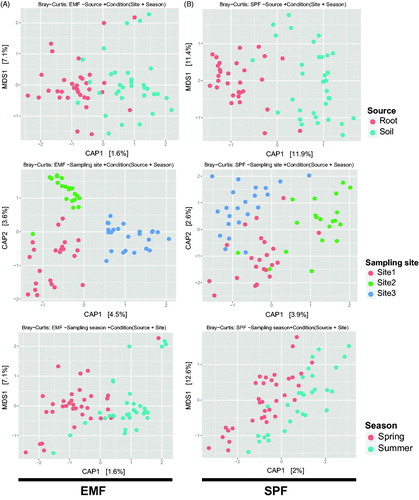
In the ordination analysis (CAP) based on the Bray–Curtis distance, community structure showed clustering by categories. Sample source (p = .001; 2.64% explanatory power) and sampling site (p = .001; 7.65% explanatory power) significantly affected the community structure, while sampling season was not significant (p = .306) (). Similar to alpha diversity, guild specific community structure pattern was also different between EMF and SPF. For EMF, sampling site significantly affected only community structure (p = .001; 7.88% explanatory power), while sample source (p = .446) and sampling season were not significant (p = .437) (). In SPF communities, however, both sample source (p = .001; 11.1% explanatory power) and sampling site (p = .001; 5.60% explanatory power) were significantly different, while sampling season was not (p = .153) ().
Figure 3. Constrained Analysis of Principal coordinates (CAP) plots based on the Bray–Curtis distance for total basidiomycetous community. CAP model for communities (A) constrained by source and conditioned by sampling site and season (2.64% explanatory power; p = .001), (B) constrained by sampling site and conditioned by source and sampling season (7.65% explanatory power; p = .001), and (C) constrained by sampling season and conditioned by source and sampling site (1.53% explanatory power; p = .306).
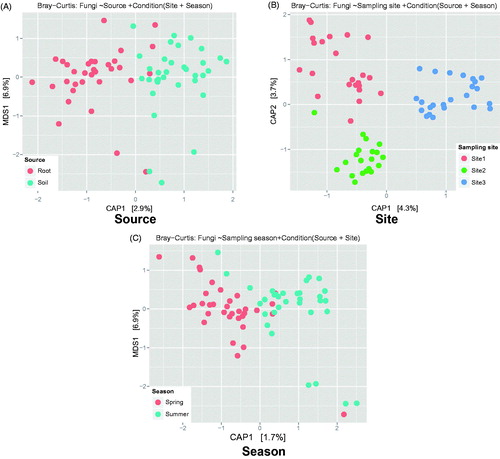
Figure 4. Constrained Analysis of Principal coordinates (CAP) plots based on the Bray–Curtis distance. CAP model constrained by source and conditioned by sampling site and season for (A) EMF and (B) SPF communities.
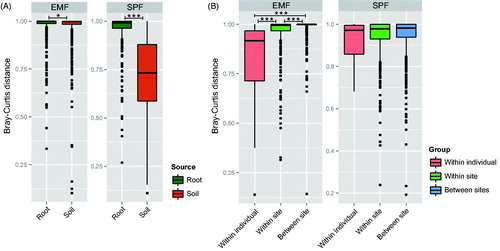
Pairwise beta diversities based on the Bray–Curtis distance were compared within and between sources (root and soil) using Kruskal–Wallis test (). Within sources, both of EMF and SPF showed significantly different beta diversities between the sources (p < .001) with high community difference within the root. However, SPF showed significantly low beta diversities within the soil (). Between sources, we compared the diversities of three groups (within individuals, within sites, and between sites) (). EMF showed significantly different community between groups (p < .001), which showed lowest community differences within same individual tree (individual group), followed by it within same sampling site (within sites group) and between sampling site (between sites group). In SPF, however, community differences did not show significant difference between groups (p = .242).
Figure 5. Pairwise beta diversities based on the Bray–Curtis distance (A) within source (root and soil), and (B) between source. Significance of difference was tested using Kruskal–Walis test (*: p < .05, ***: p < .001).
4. Discussion
4.1. Diversity of basidiomycetes EMF and SPF associated with Q. mongolica
The pattern of dominant EMF genera found in Q. mongolica was different than that of other oak species. Generally, Tomentella is the most dominant genus associated with oak species [Citation13–19]. However, fungal communities of Q. mongolica in two previous studies [Citation21,Citation22], as well as this study (), do not follow this pattern. Although we detected Tomentella frequently in our study, the abundance was low in both root and soil samples, and the most abundant EMF genera in this study were Sebacina and Russula. Thus, Q. mongolica may favor associations with Sebacina or Russula over Tomentella compared to other oak species. The high abundance of Sebacina found in this study also differed from reports of previous studies of fungal communities associated with Q. mongolica [Citation21,Citation22]. Both of the studies showed low abundance of Sebacina, while Russula [Citation21] or Cortinariaceae [Citation22] were dominant. Sebacina is globally distributed and associated with diverse tree species, usually as mycorrhizal symbionts [Citation36]. However, there are reports of endophytic Sabacina species in various herbaceous plants [Citation37], and species that exist as endophytes in Q. mongolica, such as Sebacina, may have gone undetected in the soil samples of previous studies (although we note that we did recover Sebacina in our soil samples). An alternate explanation for the unusually high abundance of Sebacina in this study was the sampling site characteristics. Mt. Jeombong is a well preserved and protected national park, and shows late successional and climax forest stages. Because Sebacina has been shown to be abundant in the late-stage forests compared to early stage forests [Citation38], the relatively high abundance reported here may reflect the relatively pristine site conditions.
The major SPF genera associated with Q. mongolica were Cryptococcus and Mycena, although there were striking differences between these genera depending on sample source. In soil samples, Cryptococcus was far more abundant than any other genera (>an order of magnitude), while in root samples, Mycena was the most abundant genus, however, the relative abundance of other major SPF genera in root samples was not dramatically lower (range: 2.5–5.3%). Thus, Cryptococcus appears to be distinctly dominant in soil while several different SPF genera were generally equally common in roots.
Because there are limited number of other studies for SPF communities in oaks, it is difficult to compare SPF communities in the roots of Q. mongolica and other oak species; however, the high abundance of Cryptococcus and Mycena observed in our study is consistent with a previous study that used soil samples from Q. mongolica [Citation22]. In addition, fruiting bodies of Mycena are commonly found in other oak species [Citation39]. Moreover, Cryptococcus is the most abundant species in various forest soils, include those of oak forests [Citation40]. Therefore, these two SPF genera are probably widely distributed in Q. mongolica forests.
While the importance of EMF in oak forests are well known, our results suggest that diverse SPF are also important contributors to Q. mongolica forest soil systems. SPF can suppress plant pathogens [Citation41,Citation42], induce plant immune response [Citation43], promote growth [Citation42], and increase nutrient uptake [Citation44,Citation45]. Cryptococcus, for example, has been shown to enhance root growth in the medicinal shrub, Agathosma betulina by supplying nutrients [Citation46]. In addition, recent studies showed that SPF often have facultative biotrophic capacity colonizing root [Citation47,Citation48]. Among the 201 wood decaying basidiomycetes tested, 34 species successfully colonized roots of Picea abies or Pinus sylvestris seedlings [Citation47], which suggests that SPF can influence the host directly. Thus, our results suggest that SPF have a significant impact on resource acquisition, growth and disease resistance in Q. mongolica.
4.2. Guild related community patterns and implications on sampling effort
There were clear differences in community structure between EMF and SPF. EMF communities were highly affected by geography, while SPF communities were more dependent on source (e.g. soil versus root) (). The spatial distribution of EMF may be associated with environmental conditions such as soil properties [Citation7–9]. Another explanation for the geographic distinction of EMF communities is the limited dispersal ability of EMF spores. Dispersal distance of EMF spores is limited to approximately 1 m from the fruit body [Citation49], a trait that may be favored by selection due to proximity to the host. Therefore, spore dispersal may constrain the distribution of the EMF community, which may explain the distinct EMF community even within the same host species. On the other hand, EMF showed similar community structure between roots and soils in same site (). EMF in soil may be present as extramatrical hyphae extended from the ectomycorrhiza. If a high proportion of EMF indicates a high abundance of EMF hyphae in soil, then overall soil microbial activity may be largely affected by the hyphal activity of EMF. In contrast, EMF detected in the soil may be not be restricted to extramatrical hyphae from ectomycorrhiza, but also represent spores or non-interactive EMF mycelia (e.g. dead mycelium and non-host fungi) [Citation50–52]. This assumption is supported by the higher alpha diversity of EMF in soil compared to roots (). Therefore, the abundant EMF detected in soil surrounding plant roots may represent a diverse set of EMF life stages (extramatrical hyphae, spore, and free-living mycelia).
Compared to the EMF community, the SPF community was more dependent on source than geography (). In SPF communities, Mycena was dominant in roots and Cryptococcus was dominant in soil, which suggests habitat differentiation between root and soil. Mycena and Cryptococcus may compete with each other for substrates, and such competition can induce such habitat differentiation. On the other hand, during the rinsing process Cryptococcus may be washed away because in its yeast form it is more easily separated from the root surface than in its hyphal form. Therefore, distinct root and soil SPF community structure in Q. mongolica may be associated with the lifestyle form of the dominant SPF genera.
Fruiting bodies are usually used to determine forest fungal communities [Citation53,Citation54]; however, recent advances in molecular based methods (e.g. DGGE, RFLP, next generation sequencing) have improved our understanding of fungal communities in forest soils immensely [Citation40,Citation54,Citation55] and an enormous diversity of fungal communities associated with roots or as mycelium in the soil has been described [Citation56]. EMF community studies comparing root tip and soil samples have revealed significant differences in EMF abundance between sample types [Citation54]. Our results show that fungal communities can have different distributional patterns depending on the guild and sample type. The EMF community was relatively similar between root and soil in same individual, and largely influenced by spatial differences (). In contrast, the SPF community was more influenced by the source, with low correspondence between root and soil samples.
Because sampling strategy is largely connected to community distribution patterns, the guild pattern of community structure may provide insights toward improved research design. The high dissimilarity of EMF communities found in our study suggests a patchy distribution of EMF (), consistent with other studies [Citation57–59]. In addition, SPF community dissimilarity was high between root and soil samples, irrespective of spatial distance (). Because this study was conducted on restrict area in Mt. Jeombong, it is possible that SPF community might be different depending on distance in larger geographical distance scales. Therefore, it is likely that both root and soil samples are needed to adequately sample SPF and EMF communities of Q. mongolica.
5. Conclusion
We surveyed the basidiomycetes associated with Q. mongolica and found different community patterns depending on the fungal guild. Among 53 genera in basidiomycete detected, 15 genera were closely associated with Q. mongolica. Sebacina, Russula, Tomentella, and Amanita were major EMF, while Cryptococcus, Mycena, Marasmiellus, and Marasmius were major SPF. The proportion and alpha diversity of EMF were higher in soil than those of SPF. In addition, geography is likely a major factor determining EMF communities, while source was more important for SPF communities. These finding suggest that the determining factor for community structure is dependent on the fungal guild. Many fungi–tree association studies, especially those of oak trees, focused on the EMF community. Our results, however, show that various SPF genera are also closely associated with Q. mongolica, relatively independent of geography, which suggests that SPF are an essential component of the core fungal community associated with oak species.
Acknowledgements
This study was supported by the research project for exploring potential fungal diversity in forest soil (KNA1-1-14, 14-2) from the Korea National Arboretum.
Disclosure statement
No potential conflict of interest was reported by the authors.
References
- Mayer AM. Plant–fungal interactions: a plant physiologist’s viewpoint. Phytochemistry. 1989;28:311–317.
- Bonfante P, Genre A. Mechanisms underlying beneficial plant–fungus interactions in mycorrhizal symbiosis. Nat Commun. 2010;1:48.
- Root RB. The niche exploitation pattern of the blue‐gray gnatcatcher. Ecol Monogr. 1967;37:317–350.
- Landeweert R, Hoffland E, Finlay RD, et al. Linking plants to rocks: ectomycorrhizal fungi mobilize nutrients from minerals. Trends Ecol Evol. 2001;16:248–254.
- Rayner AD, Boddy L. Fungal decomposition of wood. Its biology and ecology. Chichester (NY): John Wiley & Sons Ltd.; 1988.
- Wardle DA, Bardgett RD, Klironomos JN, et al. Ecological linkages between aboveground and belowground biota. Science. 2004;304:1629–1633.
- Hansen PA. Prediction of macrofungal occurrence in Swedish beech forests from soil and litter variable models. Plant Ecol. 1988;78:31–44.
- Kernaghan G, Harper K. Community structure of ectomycorrhizal fungi across an alpine/subalpine ecotone. Ecography. 2001;24:181–188.
- Jumpponen A, Egerton-Warburton LM. Mycorrhizal fungi in successional environments: a community assembly model incorporating host plant, environmental, and biotic filters. In: Dighton J, White JF, Oudemans P, editors. The fungal community: its organization and role in the ecosystem. Vol. 23. Boca Raton (FL): CRC Press; 2005. p. 139–168.
- Nguyen NH, Williams LJ, Vincent JB, et al. Ectomycorrhizal fungal diversity and saprotrophic fungal diversity are linked to different tree community attributes in a field‐based tree experiment. Mol Ecol. 2016;25:4032–4046.
- Plomion C, Fievet V. Oak genomics takes off… and enters the ecological genomics era. New Phytol. 2013;199:308–310.
- Oldfield S, Eastwood A. The red list of oaks. Cambridge, UK: Fauna & Flora International; 2007.
- Mosca E, Montecchio L, Sella L, et al. Short-term effect of removing tree competition on the ectomycorrhizal status of a declining pedunculate oak forest (Quercus robur L.). For Ecol Manage. 2007;244:129–40.
- Smith ME, Douhan GW, Rizzo DM. Ectomycorrhizal community structure in a xeric Quercus woodland based on rDNA sequence analysis of sporocarps and pooled roots. New Phytol. 2007;174:847–863.
- Walker JF, Miller OK Jr, Horton JL. Seasonal dynamics of ectomycorrhizal fungus assemblages on oak seedlings in the southeastern Appalachian Mountains. Mycorrhiza. 2008;18:123–132.
- Moser AM, Frank JL, D’allura JA, et al. Ectomycorrhizal communities of Quercus garryana are similar on serpentine and nonserpentine soils. Plant Soil. 2009;315:185–194.
- Richard F, Roy M, Shahin O, et al. Ectomycorrhizal communities in a Mediterranean forest ecosystem dominated by Quercus ilex: seasonal dynamics and response to drought in the surface organic horizon. Ann For Sci. 2011;68:57–68.
- Wang Q, He XH, Guo L-D. Ectomycorrhizal fungus communities of Quercus liaotungensis Koidz of different ages in a northern China temperate forest. Mycorrhiza. 2012;22:461–470.
- Toju H, Yamamoto S, Sato H, et al. Community composition of root‐associated fungi in a Quercus‐dominated temperate forest: “codominance” of mycorrhizal and root‐endophytic fungi. Ecol Evol. 2013;3:1281–1293.
- Jang W-S, Park P-S, Han A-R, et al. The spatial distribution of Quercus mongolica and its association with other tree species in two Quercus mongolica stands in Mt. Jiri, Korea. J Ecol Environ. 2010;33:67–77.
- He F, Yang B, Wang H, et al. Changes in composition and diversity of fungal communities along Quercus mongolica forests developments in Northeast China. Appl Soil Ecol. 2016;100:162–171.
- Kim CS, Nam JW, Jo JW, et al. Studies on seasonal dynamics of soil-higher fungal communities in Mongolian oak-dominant Gwangneung forest in Korea. J Microbiol. 2016;54:14–22.
- Goldmann K, Schröter K, Pena R, et al. Divergent habitat filtering of root and soil fungal communities in temperate beech forests. Sci Rep. 2016;6:31439.
- Barrico L, Rodríguez-Echeverría S, Freitas H. Diversity of soil basidiomycete communities associated with Quercus suber L. in Portuguese montados. Eur J Soil Biol. 2010;46:280–287.
- Lee K-S, Cho D-S. Relationships between the spatial distribution of vegetation and microenviromnent in a temperate hardwood forest in Mt. Jeombong biosphere reserve area, Korea. Korean J Ecol. 2000;23:241–253.
- Lee W, Kim J, Jin G. The analysis of successional trends by topographic positions in the natural deciduous forest of Mt. Chumbong. J Korean For Soc. 2000;89:655–665.
- Rogers SO, Bendich AJ. Extraction of total cellular DNA from plants, algae and fungi. In: Gelvin SB, Schilperoort RA, editors. Plant molecular biology manual. Netherlands: Springer; 1994. p. 183–190.
- Gardes M, Bruns TD. ITS primers with enhanced specificity for basidiomycetes – application to the identification of mycorrhizae and rusts. Mol Ecol. 1993;2:113–118.
- Caporaso JG, Kuczynski J, Stombaugh J, et al. QIIME allows analysis of high-throughput community sequencing data. Nat Methods. 2010;7:335–336.
- Edgar RC. Search and clustering orders of magnitude faster than BLAST. Bioinformatics. 2010;26:2460–2461.
- Kõljalg U, Nilsson RH, Abarenkov K, et al. Towards a unified paradigm for sequence-based identification of fungi. Mol Ecol. 2013;22:5271–5277.
- R Core Team. R: A language and environment for statistical computing. Vienna, Austria: R Foundation for Statistical Computing; 2014.
- Wickham H. Ggplot2: elegant graphics for data analysis. Switzerland: Springer; 2016.
- McMurdie PJ, Holmes S. Phyloseq: an R package for reproducible interactive analysis and graphics of microbiome census data. PLoS One. 2013;8:e61217.
- Nguyen NH, Song Z, Bates ST, et al. FUNGuild: an open annotation tool for parsing fungal community datasets by ecological guild. Fungal Ecol. 2016;20:241–248.
- Tedersoo L, Bahram M, Ryberg M, et al. Global biogeography of the ectomycorrhizal/sebacina lineage (Fungi, Sebacinales) as revealed from comparative phylogenetic analyses. Mol Ecol. 2014;23:4168–4183.
- Selosse M-A, Dubois M-P, Alvarez N. Do Sebacinales commonly associate with plant roots as endophytes? Mycol Res. 2009;113:1062–1019.
- Long D, Liu J, Han Q, et al. Ectomycorrhizal fungal communities associated with Populus simonii and Pinus tabuliformis in the hilly-gully region of the Loess Plateau, China. Sci Rep. 2016;6:24336.
- O’Hanlon R, Harrington TJ. The macrofungal diversity and community of Atlantic oak (Quercus petraea and Q. robur) forests in Ireland. Anales Jard Bot Madrid. 2012;69:107–117.
- Buee M, Reich M, Murat C, et al. 454 Pyrosequencing analyses of forest soils reveal an unexpectedly high fungal diversity. New Phytol. 2009;184:449–456.
- Nel B, Steinberg C, Labuschagne N, et al. Isolation and characterization of nonpathogenic Fusarium oxysporum isolates from the rhizosphere of healthy banana plants. Plant Pathol. 2006;55:207–216.
- Vinale F, Sivasithamparam K, Ghisalberti EL, et al. Trichoderma–plant–pathogen interactions. Soil Biol Biochem. 2008;40:1–10.
- Fravel D, Olivain C, Alabouvette C. Fusarium oxysporum and its biocontrol. New Phytol. 2003;157:493–502.
- Subke J-A, Hahn V, Battipaglia G, et al. Feedback interactions between needle litter decomposition and rhizosphere activity. Oecologia. 2004;139:551–559.
- Baum C, Hrynkiewicz K. Clonal and seasonal shifts in communities of saprotrophic microfungi and soil enzyme activities in the mycorrhizosphere of Salix spp. J Plant Nutr Soil Sci. 2006;169:481–487.
- Cloete KJ, Valentine AJ, Stander MA, et al. Evidence of symbiosis between the soil yeast Cryptococcus laurentii and a sclerophyllous medicinal shrub, Agathosma betulina (Berg.) Pillans. Microb Ecol. 2009;57:624–632.
- Smith GR, Finlay RD, Stenlid J, et al. Growing evidence for facultative biotrophy in saprotrophic fungi: data from microcosm tests with 201 species of wood‐decay basidiomycetes. New Phytol. 2017;215:511–513.
- Vasiliauskas R, Menkis A, Finlay RD, et al. Wood-decay fungi in fine living roots of conifer seedlings. New Phytol. 2007;174:441–446.
- Galante TE, Horton TR, Swaney DP. 95% of basidiospores fall within 1 m of the cap: a field-and modeling-based study. Mycologia. 2011;103:1175–1183.
- Taylor J, Jacobson D, Fisher M. The evolution of asexual fungi: reproduction, speciation and classification. Annu Rev Phytopathol. 1999;37:197–246.
- Landeweert R, Leeflang P, Smit E, et al. Diversity of an ectomycorrhizal fungal community studied by a root tip and total soil DNA approach. Mycorrhiza. 2005;15:1–6.
- Van der Linde S, Haller S. Obtaining a spore free fungal community composition. Fungal Ecol. 2013;6:522–526.
- Schmit JP, Lodge DJ. Classical methods and modern analysis for studying fungal diversity. In: Dighton J, White JF, Oudemans P, editors. The fungal community: its organization and role in the ecosystem. Vol. 23. Boca Raton (FL): CRC Press; 2005. p. 193–214.
- Kjøller R. Disproportionate abundance between ectomycorrhizal root tips and their associated mycelia. FEMS Microbiol Ecol. 2006;58:214–224.
- Genney DR, Anderson IC, Alexander IJ. Fine-scale distribution of pine ectomycorrhizas and their extramatrical mycelium. New Phytol. 2006;170:381–390.
- Koide RT, Xu B, Sharda J. Contrasting below-ground views of an ectomycorrhizal fungal community. New Phytol. 2005;166:251–262.
- Dahlberg A, Jonsson L, Nylund J-E. Species diversity and distribution of biomass above and below ground among ectomycorrhizal fungi in an old-growth Norway spruce forest in south Sweden. Can J Bot. 1997;75:1323–1335.
- Gehring CA, Theimer TC, Whitham TG, et al. Ectomycorrhizal fungal community structure of pinyon pines growing in two environmental extremes. Ecology. 1998;79:1562–1572.
- Horton TR, Bruns TD. The molecular revolution in ectomycorrhizal ecology: peeking into the black‐box. Mol Ecol. 2001;10:1855–1871.