
Abstract
In this study, the genetic diversity and the population structure of 77 wild strains and 23 cultivars of Lentinula edodes from Korea were analyzed using 20 genomic SSRs, and their genetic relationship was investigated. The tested strains of L. edodes were divided into three sub-groups consisting of only wild strains, mainly wild strains and several cultivars, and mainly cultivars and several wild strains by distance-based analysis. Using model-based analysis, L. edodes strains were divided into two subpopulations; the first one consisting of only wild strains and the second one with mainly cultivars and several wild strains. Moreover, AMOVA analysis revealed that the genetic variation in the cultivars was higher than that in the wild strains. The expected and observed heterozygosity and values indicating the polymorphic information content of L. edodes cultivars from Korea were also higher than that of the wild strains. Based on these results, we presume that the cultivars in Korea have developed by using numerous strains from other countries. In conclusion, the usage of wild strains for the development of new cultivars could improve the adaptability of L. edodes to biotic and abiotic stress.
1. Introduction
Lentinula edodes is a white rot fungus that is found on dead or rotten tree stumps in forests and it is geographically distributed all over Asia, Australia, and the Americas [Citation1]. This is an edible mushroom, which is not only a highly valuable food source but also contains important pharmacological components such as lentinan [Citation2,Citation3]. The agricultural cultivation of L. edodes was first reported in China about 800 years ago [Citation4] and modern cultivation methods using the pure cultivated mycelium were developed in Japan in the 1930s [Citation5]. Lentinula edodes contributes to approximately 22% of the total mushroom production in the world [Citation6] and the main cultivation region is East Asia including Korea, China, and Japan [Citation7]. This mushroom has been recently highlighted in Europe, North America, and Africa due to its nutritional and pharmacological importance [Citation8].
The development of novel varieties can be achieved by selecting and introducing new resources from crops [Citation9]. In particular, the introduction of wild resources and core collection has been regarded as an effective way to improve the breeding for the development of new cultivars with improved adaptability to biotic and abiotic stress [Citation10,Citation11]. Securing the genetic potential of wild genetic resources is a major tool for crop improvement [Citation12]. Genetic diversity and population structure analysis can provide important information regarding the origin and the evolution of the species, which can aid in selecting potential genetic resources for future use [Citation13]. The genetic diversity can be determined by using morphological characteristics as well as DNA marker analysis [Citation14]. However, the usage of morphological characteristics has been reported to have certain disadvantages as the expression of the phenotypes is influenced by the growth stages and various environmental factors [Citation15]. DNA markers are comparatively less affected by various environmental factors and growth stages [Citation16]. Moreover, analysis using DNA markers is simple and rapid, reproducible by experiment regardless of environmental conditions, and aspects such as the accurate monitoring of seed purity, determination of cultivars, can be performed at low cost [Citation17,Citation18]. Analysis with DNA markers include restriction fragment length polymorphism (RFLP), random amplified polymorphic DNA (RAPD), amplified fragment length polymorphism (AFLP), inter-simple sequence repeats (ISSRs), sequence characterized regions (SCARs), sequence tag sites (STSs), cleaved amplified polymorphic sequences (CAPS), microsatellites or simple sequence repeats (SSRs), and single nucleotide polymorphisms (SNPs), and these methods have been extensively used for current breeding programs [Citation19] and genetic diversity analysis [Citation20]. SSRs, which are randomly repeated DNA sequences, are widely distributed throughout the genome with 1–6 base pairs per unit length, and are codominant, highly polymorphic, and highly reproducible [Citation21]. Hence, this marker is ideal for the analysis of genetic diversity and population structure [Citation22].
In this study, to investigate the genetic relationship between the wild and cultivated strains of L. edodes in Korea, the genetic diversity and population structure analyses of 77 wild strains and 23 cultivars were performed using 20 genomic SSRs.
2. Materials and methods
2.1. Fungal material
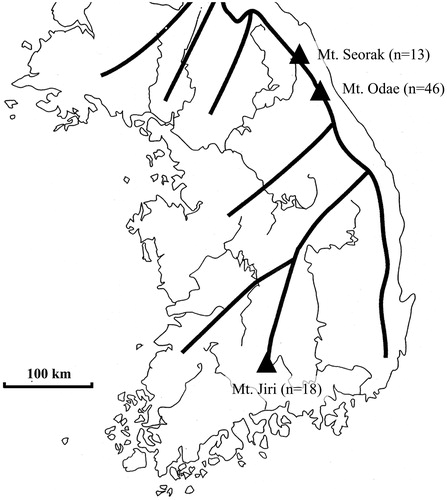
A total of 100 strains of L. edodes consisting of two types of wild strains and cultivars were included in this study. Seventy-seven wild strains were collected and maintained at the National Institute of Forestry Science, Forest Mushroom Research Center and Chungbuk National University, and 23 cultivars were developed by the National Institute of Forestry Science and Forest Mushroom Research Center (, Supplementary Table 1).
Figure 1. Distribution of 77 wild strains of Lentinula edodes in Korea (thin line, river; thick line, mountains).
2.2. DNA extraction and SSR analysis
The strains were incubated in liquid potato dextrose broth (PDB) media at 25 °C for approximately 10 days in darkness. The cultured mycelia were finely ground using liquid nitrogen and the DNA was extracted. DNA extraction was performed using a GenEX Plant Kit (Geneall, Seoul, Korea) and the extracted DNA was quantified to be at 20 ng/μL using a K5600 micro spectrophotometer.
The 20 SSR markers used in this study were selected in our two previous studies [Citation23,Citation24]. The features of selected markers in higher genetic diversity values such as polymorphic information content (PIC), expected and observed heterozygous, genotypes and allele numbers are presented in . We conducted PCR analysis using a total reaction volume of 20 μL containing 2 μL of template DNA, 1 μL of forward and reverse primer (5 pmol) each, 10 μL 2Xi-Taq Master Mix (Intron biotechnology, Seongnam, Korea) and 6 μL of distilled water. The PCR was performed at 95 °C for 3 min; 35 cycles at 95 °C for 30 s, 58 °C for 30 s, and 72 °C for 30 s; and finally, 72 °C for 20 min. The size of the PCR product was confirmed using a size fragment analyzer (Advanced Analytical Technologies, Ankeny, IA).
Table 1. Information of SSR markers and diversity statistics for 100 Lentinula edodes strains.
2.3. Data analysis
The PCR products were analyzed using a size fragment analyzer and confirmed by the PROSize 2.0 software (Advanced Analytical Technologies). Based on scored size of the PCR products, the number of alleles (NA), expected heterozygosity (HE), observed heterozygosity (HO), and PIC values were calculated using PowerMarker V3.25 [Citation25]. The genetic distance was calculated using the Nei [Citation26] method and the unweighted pair group method with arithmetic mean (UPGMA) dendrogram was constructed using MEGA 7.
A population structure analysis was performed using the model-based software program STRUCTURE 2.3.4 and a model allowing for admixture [Citation27]. The program set a burn-in of 100,000 and a run length of 200,000, which was replicated thrice. The log probability of the data (LnP(D)) was calculated to confirm the population structure of the strains. Although the number of populations (K) was analyzed from 1 to 10, it was not clear as the calculated K value on LnP (D) gradually increased. Therefore, we analyzed the ΔK, proposed by Evanno et al. [Citation28], to determine the optimum K. The strains sharing more than 70% of ancestry were assigned into one subpopulation [Citation29].
Analysis molecular of variation analysis (AMOVA) was used to assess the genetic differentiation (FST), and confirmation of the Hardy–Weinberg equilibrium (HWE) was performed using GenAlEx 6.502 [Citation30].
3. Result
3.1. SSR polymorphism
We initially analyzed the information regarding the SSR markers and the diversity statistics of all 100 L. edodes strains. We found that the NA ranged from 9 (RL-LE-028) to 40 (RL-LE-017) with an average of 19. The HE ranged from 0.62 (RL-LE-051) to 0.94 (RL-LE-017) with an average of 0.76, the HO ranged from 0.02 (RL-LE-003) to 0.58 (RL-LE-006) with an average of 0.3. The PIC value ranged from 0.57 (RL-LE-028, RL-LE-051) to 0.94 (RL-LE-017) with an average of 0.73. All the markers significantly deviated from the HWE ().
3.2. Genetic distance and population structure
The 100 L. edodes strains were then divided into two groups with two subgroups using the UPGMA dendrogram based on genetic distance through Nei’s method [Citation26]. The two groups were Group 1 consisting of only 9 wild strains and Group 2, that was divided into subgroup Group 2-1 containing 58 wild strains (10 in Mt. Seorak, 32 in Mt. Odae, and 16 in Mt. Jiri) and 2 cultivars (SJ102 and SJ103), and subgroup Group 2-2 containing 21 cultivars and 10 wild strains (2 in Mt. Seorak, 7 in Mt. Odae, and 1 in Mt. Jiri) (Supplementary Table S1, ).
Figure 2. Clustering of distance- and model-based for 100 Lentinula edodes strains including 77 wild strains and 23 cultivars using 20 genomic SSR markers. (A) UPGMA dendrogram based on Nei’s genetic distance; (B) population structure analysis (green, Pop1; red, Pop2; the strains that did not share more than 70% of ancestry were assigned to admixture).
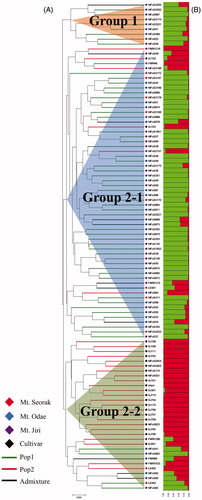
The log probability of the data (LnP(D)) was calculated to confirm the population structure of the strains. ΔK showed the highest value when K was 2 (). Further, 89 strains were assigned into two subpopulations. The subpopulations were divided into Pop1 comprising 59 wild strains, and Pop2 comprising 23 cultivars and 7 wild strains (1 in Mt. Seorak, 4 in Mt. Odae, and 2 in Mt. Jiri). The admixture contained 11 wild strains (1 in Mt. Seorak, 8 in Mt. Odae, and 2 in Mt. Jiri) (Supplementary Table S1, ).
Figure 3. (A) Log probability of the data (LnP(D)) for each K range from 1 to 10; (B) ΔK values calculated as method by Evanno et al. [Citation28].
![Figure 3. (A) Log probability of the data (LnP(D)) for each K range from 1 to 10; (B) ΔK values calculated as method by Evanno et al. [Citation28].](/cms/asset/770efa12-f02a-45c7-a7e1-653436571e40/tmyb_a_1727401_f0003_b.jpg)
3.3. Analysis of genetic diversity based on the collection regions and types
Among the collection regions, wild strains and cultivars, distance- and model-based analysis was done to compare the genetic diversity. The NA was the highest for 12 in Mt. Odae, 7 in Mt. Seorak, and 6 in Mt. Jiri, the HE was the lowest for 0.66 in Mt. Jiri, 0.71 in Mt. Seorak, and 0.72 in Mt. Odae, the HO was the highest 0.27 in Mt. Odae than 0.23 in Mt. Seorak and 0.22 in Mt. Jiri, and the PIC value was 0.62 in Mt. Jiri, 0.67 in Mt. Seorak and 0.68 in Mt. Odae.
Among the wild strains and cultivars, NA of the wild strains was 15 and was higher than that of the cultivars (9), and the HE, HO, and PIC values of the cultivars (0.76, 0.44, and 0.73) were higher than that of the wild strains (0.73, 0.25, and 0.69), respectively ().
Table 2. Diversity statistics as determined by collection regions and types.
3.4. Analysis of molecular variation (AMOVA) and Hardy–Weinberg equilibrium based on collection regions and types
The variation was 1% among collection regions, 66% among strains, and 33% within strains. In addition, FST was 0.01 and gene flow (Nm) was 22.48. Among the wild strains and the cultivars, the variation was 8% between the types, 57% among strains, and 35% within strains, with an FST value of 0.08, and Nm of 2.98 ().
Table 3. Analysis of molecular variance (AMOVA) by collection regions and types.
All the markers of the wild strains and the cultivars deviated significantly from the HWE. In the collection regions, three markers (RL-LE-004, RL-LE-033, and RL-LE-053) corresponding to samples collected from Mt. Seorak and one marker (RL-LE-004) from the sample from Mt. Jiri were confirmed using HWE, and all markers from the samples from Mt. Odae deviated significantly from the HWE (Supplementary Table S2).
4. Discussion
The SSR markers in this study were analyzed to reveal NA of 19, HE of 0.76, HO of 0.3, and PIC value of 0.73 for 100 L. edodes strains including wild strains and cultivars (). The NA, HE, HO, and PIC values obtained from the study by Lee et al. [Citation23] were 4.9, 0.55, 0.31, and 0.51, respectively. Moon et al. [Citation24] reported the values of 6.8, 0.64, 0.32, and 0.61 for NA, HE, HO, and PIC, respectively. Our results showed higher values for HE and PIC while the HO value was slightly lower compared to the results of the previous studies [Citation23,Citation24]. The five SSR markers developed by Kim et al. [Citation31] were reported to have HE of 0.58, HO of 0.38, and PIC value of 0.53 using cultivars from Korea, China, and Japan, as well as wild strains from Korea. Analysis of these markers showed HE of 0.53, HO of 0.38, and PIC value of 0.5 using 10 wild strains collected from Mt. Gariwang and Mt. Jungwang in Korea [Citation32]. The SSR markers used in this study showed higher NA, HE, and PIC values while the HO value was lower than in that found in the other SSR markers from Korea.
Lentinula edodes in Korea was divided into Group 1 consisting of only 9 wild strains. Group 2-1 contained mainly wild strains along with several cultivars, and Group 2-2 consisted of mainly cultivars with several wild strains by distance-based analysis (Supplementary Table S1, ). This result was similar to that observed in a previous study by Xiao et al. [Citation33]. The population structure based on the structure model was divided into subpopulation Pop1, which consisted of 59 wild strains, and subpopulation Pop2, which had 7 wild strains and 23 cultivars. The admixture consisted of 11 wild strains (Supplementary Table S1, ). The result of study from Xiao et al. [Citation33] suggested that the spores or the mycelia of the cultivars in the farm might be dispersed into the wild by natural and human activities or maybe the wild strains were used for the development of cultivars in L. edodes. The Korean L. edodes are also assumed to have influenced each other between cultivars and wild strains. In this study, we showed that the cultivars of Group 2-1 are probably belonged to the cultivars developed using wild strains. However, the wild strains of Groups 2-2 are likely distributed in nature under the influence of the cultivars. The model-based structural analysis of this study, the analyzed strains sharing more than 70% of ancestry were assigned to one subpopulation. Thus, 7 wild strains in Pop2 shared more than 70% of ancestry with cultivars. These results suppose that the wild strains distributed in nature such as distance-based wild strains in Group 2-2 were affected by cultivars.
In this study, HE and HO, which are very sensitive to frequency of allele [Citation34] and the PIC value, which is determined by frequency of allele [Citation35] were 0.76, 0.44, and 0.73 in the cultivars and 0.73, 0.25, and 0.69 in wild strains, respectively (). Therefore, HE, HO, and PIC values of the cultivars were higher than those of the wild strains. In several recent studies, the analysis of 88 wild strains showed HE of 0.44, HO of 0.29, and PIC of 0.31 using two SSRs and 68 InDels [Citation13], and the analysis of 89 cultivars revealed HE of 0.46, HO of 0.55, and PIC value of 0.38 using 48 SSRs and 249 InDels [Citation36]. Studies conducted in Korea and China have shown that the genetic diversity of L. edodes was also higher in the cultivars than in the wild strains. However, Ha et al. [Citation37] reported that the most frequent alleles of A mating type alleles of the L. edodes cultivars developed in Korea, China, and Japan were allele A1 and A5. However, these alleles were not investigated in the wild strains collected from Korea. Therefore, stable cultivars previously developed in other countries are expected to be used for the development of L. edodes cultivars in Korea. Analysis of AMOVA showed that the variations due to among strains in the collection regions and types were 66% and 57%, respectively, which was the highest attributable to variation in the population. However, the variation of among regions and types was the lowest to 1% and 8%, respectively (). These results suggest that the L. edodes in Korea has a very low genetic variation among the collection sites, cultivars and wild strains. Based on the results of the AMOVA analysis, FST and Nm values of the collection regions and types were compared. FST and Nm values between wild strains and cultivars were 0.08 and 2.98, respectively, and the FST and Nm values among collection regions were analyzed to 0.01 and 22.48, respectively. Therefore, the genetic variation between wild strains and cultivars was higher than that among collection regions in wild strains. In the HWE analysis, L. edodes cultivars of Korea significantly deviated from the HWE. Among the collection regions for wild strains, a few markers from the samples from Mt. Seorak and Mt. Jiri were confirmed as HWE (Supplementary Table S2). Non-random mating, migration, mutation, natural selection, and mixture of subpopulation are factors that might lead to deviation from HWE [Citation38]. Therefore, genetic diversity of cultivars was higher than wild strains as it is assumed that the wild strains undergo genetic exchange with other strains less actively than cultivars.
This study revealed the genetic diversity and population structure of wild strains and cultivars of L. edodes collected in South Korea. The analysis of genetic diversity and population structure is able to provide important information about the origin and evolutionary features of species. Moreover, it can be valuable in the selection of potential genetic resources for future use [Citation13]. Securing the genetic potential of wild genetic resources with these powerful analyses has been applied as a major tool for improvement of diverse crop traits [Citation12]. The introduction of wild genetic resources is considered as a method for the development of new cultivars with advanced adaptability to the numerical changes by biotic and abiotic stresses [Citation10,Citation11]. In conclusion, the genetic diversity of L. edodes cultivars from Korea was higher than that of the wild strains as the mixture of diverse cultivars developed presumably in other countries. However, the use of L. edodes wild strains in Korea, which have been never used in the breeding program, will enable the development of novel mushroom cultivars with improved adaptability to biotic and abiotic stress.
Supplemental Material
Download MS Word (25 KB)Disclosure statement
The authors report no conflicts of interest.
Additional information
Funding
References
- Hibbett DS. Shiitake mushrooms and molecular clocks: historical biogeography of Lentinula. J Biogeogr. 2001;28(2):231–241.
- Bisen PS, Baghel RK, Sanodiya BS, et al. Lentinus edodes: a macrofungus with pharmacological activities. Curr Med Chem. 2010;17(22):2419–2430.
- Finimundy TC, Dillon AJ, Henriques JA, et al. A review on general nutritional compounds and pharmacological properties of the Lentinula edodes mushroom. Food Nutr Sci . 2014;5:1095–1105.
- Chang S, Miles P. Historical record of the early cultivation of Lentinus in China. Mushroom J Trop. 1987;7:31–37.
- Terashima K, Matsumoto T, Hasebe K, et al. Genetic diversity and strain-typing in cultivated strains of Lentinula edodes (the shii-take mushroom) in Japan by AFLP analysis. Mycol Res. 2002;106(1):34–39.
- Royse DJ, Barrs J, Tan Q. Current overview of mushroom production in the world. In: Zeid DC, Pardo‐Giménez A, editors. Edible and medical mushrooms: technology and applications. Hoboken: John Wiley & Sons Ltd.; 2017. p. 5–13.
- Kim KH, Ka KH, Kang JH, et al. Identification of single nucleotide polymorphism markers in the Laccase gene of Shiitake mushrooms (Lentinula edodes). Mycobiology. 2015;43(1):75–80.
- George PL, Sripathi VR, Seloame TN, et al. DNA-based identification of Lentinula edodes strains with species-specific primers. Afr J Biotechnol. 2016;15:191–198.
- Abid G, Mingeot D, Udupa SM, et al. Genetic relationship and diversity analysis of Faba Bean (Vicia faba L. var. Minor) genetic resources using morphological and microsatellite molecular markers. Plant Mol Biol Rep. 2015;33(6):1755–1767.
- Rao NK, Reddy LJ, Bramel PJ. Potential of wild species for genetic enhancement of some semi-arid food crops. Genet Resour Crop Evol. 2003;50:707–721.
- Jarvis A, Lane A, Hijmans RJ. The effect of climate change on crop wild relatives. Agric Ecosyst Environ. 2008;126(1–2):13–23.
- Tanskley SD, McCouch SR. Seed banks and molecular maps: unlocking genetic potential from the wild. Science. 1997;277:1063–1066.
- Xiang X, Li C, Li L, et al. Genetic diversity and population structure of Chinese Lentinula edodes revealed by InDel and SSR markers. Mycol Prog. 2016;15:37.
- Liu CJ. Geographical distribution of genetic variation in Stylosanthes scabra revealed by RAPD analysis. Euphytica. 1997;98(1/2):21–27.
- Eagles HA, Bariana HS, Ogbonnaya FC, et al. Implementation of markers in Australian wheat breeding. Aust J Agric Res. 2001;52(12):1349–1356.
- Kaur S, Panesar PS, Bera MB, et al. Simple sequence repeat markers in genetic divergence and marker-assisted selection of rice cultivars: a review. Crit Rev Food Sci Nutr. 2015;55(1):41–49.
- Ye-Yun X, Zhan Z, Yi-Ping X, et al. Identification and purity test of super hybrid rice with SSR molecular markers. Rice Sci. 2005;12:7–12.
- Cirillo A, Gaudio SD, Bernardo DG, et al. Molecular characterization of Italian rice cultivars. Eur Food Res Technol. 2009;228(6):875–881.
- Khan F. Molecular markers: an excellent tool for genetic analysis. J Mol Biomark Diagn. 2015;06(03):233.
- Zhang Q, Li J, Zhao Y, et al. Evaluation of genetic diversity in Chinese wild apple species along with apple cultivars using SSR markers. Plant Mol Biol Rep. 2012;30(3):539–546.
- Selkoe KA, Toonen RJ. Microsatellites for ecologists: a practical guide to using and evaluating microsatellite markers. Ecol Lett. 2006;9(5):615–629.
- Du QZ, Wang BW, Wei ZZ, et al. Genetic diversity and population structure of Chinese white poplar (Populus tomentosa) revealed by SSR markers. J Hered. 2012;103(6):853–862.
- Lee HY, Moon S, Shim D, et al. Development of 44 Novel polymorphic SSR markers for determination of shiitake mushroom (Lentinula edodes) cultivars. Genes. 2017;8(4):109.
- Moon S, Lee HY, Shim D, et al. Development and molecular characterization of novel polymorphic genomic DNA SSR markers in Lentinula edodes. Mycobiology. 2017;45(2):105–109.
- Liu K, Muse SV. PowerMarker: a intergrated analysis environment for genetic marker analysis. Bioinformatics. 2005;21(9):2128–2129.
- Nei M. Analysis of gene diversity in subdivided populations. Proc Natl Acad Sci USA. 1973;70(12):3321–3323.
- Pritchard JK, Stephens M, Donnelly P. Inference of population structure using multilocus genotype data. Genetics. 2000;155:945–959.
- Evanno G, Regnaut S, Goudet J. Detecting the number of clusters of individuals using the software STRUCTURE: a simulation study. Mol Ecol. 2005;14(8):2611–2620.
- Yoon MY, Moe KT, Kim DY, et al. Genetic diversity and population structure analysis of strawberry (Fragaria x ananassa Duch.) using SSR markers. Electron J Biotechnol. 2012;15:1–16.
- Peakall R, Smouse PE. GenAlEx 6.5: genetic analysis in Excel. Population genetic software for teaching and research-an update. Bioinformatics. 2012;28(19):2537–2539.
- Kim KH, Kim YY, Ka KH, et al. Microsatellite marker for population-genetics studies of shiitake (Lentinula edodes) strains. Genes Genom. 2009;31(6):403–411.
- Jeong YS, Jang Y, Ryoo R, et al. Genotyping of the wild mushroom Lentinula edodes from Mt. Jungwang and Mt. Gariwang in Korea. Kor J Mycol. 2016;44:289–295.
- Xiao Y, Cheng X, Liu J, et al. Population genomic analysis uncovers environmental stress-driven selection and adaptation of Lentinula edodes population in China. Sci Rep. 2016;6(1):36789.
- Greenbaum G, Templeton AR, Zarmi Y, et al. Allelic richness following population founding events – a stochastic modeling framework incorporating gene flow and genetic drift. PLOS One. 2014;9(12):e115203.
- Sharma MV, Kantartzi SK, Stewart JM. Molecular diversity and polymorphism information content of selected Gossypium hirsutum accessions. Summ Ark Cotton Res. 2009;582:124–126.
- Li C, Gong W, Zhang L, et al. Association mapping reveals genetic loci associated with important agronomic traits in Lentinula edodes, Shiitake mushroom. Front Microbiol. 2017;8:237.
- Ha B, Kim S, Kim M, et al. Diversity of A mating type in Lentinula edodes and mating type preference in the cultivated strains. J Microbiol. 2018;56(6):416–425.
- Schaid DJ, Batzler AJ, Jenkins GD, et al. Exact tests of Hardy–Weinberg equilibrium and homogeneity of disequilibrium across strata. Am J Hum Genet. 2006;79(6):1071–1080.