
Abstract
Agaricus bisporus is a popular edible mushroom that is cultivated worldwide. Due to its secondary homothallic nature, cultivated A. bisporus strains have low genetic diversity, and breeding novel strains is challenging. The aim of this study was to investigate the genetic diversity and population structure of globally collected A. bisporus strains using simple sequence repeat (SSR) markers. Agaricus bisporus strains were divided based on genetic distance-based groups and model-based subpopulations. The major allele frequency (MAF), number of genotypes (NG), number of alleles (NA), observed heterozygosity (HO), expected heterozygosity (HE), and polymorphic information content (PIC) were calculated, and genetic distance, population structure, genetic differentiation, and Hardy–Weinberg equilibrium (HWE) were assessed. Strains were divided into two groups by distance-based analysis and into three subpopulations by model-based analysis. Strains in subpopulations POP A and POP B were included in Group I, and strains in subpopulation POP C were included in Group II. Genetic differentiation between strains was 99%. Marker AB-gSSR-1057 in Group II and subpopulation POP C was confirmed to be in HWE. These results will enhance A. bisporus breeding programs and support the protection of genetic resources.
1. Introduction
Agaricus bisporus is a popular edible mushroom that constitutes approximately 15% of global mushroom production [Citation1]. Consumption of A. bisporus has increased in recent years alongside growth of the mushroom market, and A. bisporus is considered to be particularly healthy mushroom due to its higher protein, fiber, and amino acid contents and lower calories than other cultivated mushrooms such as Pleurotus ostreatus and Lentinula edodes [Citation2]. Furthermore, extracts of A. bisporus have high antioxidant activities and may help to prevent breast cancer and cardiovascular disease [Citation3,Citation4]. Agaricus bisporus, which was first cultivated in France in the seventeenth century [Citation5], is mainly cultivated in North America, Europe, India, and China [Citation6], with recent increases in China and South Korea [Citation5].
The growing demand for mushroom crops has increased the importance of developing new A. bisporus cultivars. New cultivars can be developed by selection of favorable traits from existing stocks and by introduction of traits from new genetic resources [Citation7]. Furthermore, use of elite cultivars to introduce traits of interest in breeding programs can facilitate the development of novel cultivars [Citation8,Citation9]. Cultivars of A. bisporus, a secondary homothallic fungus, have low genetic diversity [Citation10] owing to genetic erosion caused by the use of limited genetic resources for cultivar development [Citation5,Citation11]. Studies of genetic diversity and population structure have provided essential insights into potential genetic resources for crop breeding [Citation12]. However, as the development of new cultivars from existing cultivars narrows the genetic relationships between breeding parents, accurate information on genetic diversity and relationships among strains is needed to support breeding goals [Citation13]. Phenotypic, biochemical, and molecular markers can all be used to evaluate genetic diversity but, unlike phenotypic and biochemical markers, molecular markers are unaffected by the environment [Citation14]. Molecular markers such as restriction fragment length polymorphisms (RFLPs), random amplified polymorphic DNA (RAPD) markers, amplified fragment length polymorphisms (AFLP), simple sequence repeats (SSRs), and single nucleotide polymorphisms (SNPs) have been used for A. bisporus genotyping in a range of studies [Citation15].
Advances in next-generation sequencing technologies have facilitated the sequencing of whole genomes, and the development of SSR and SNP markers for assessing variability among strains has actively progressed [Citation16]. SSR markers have several advantages over many of the other available marker types, including codominance, high polymorphism levels, reproducibility, reliability, and genome-wide distribution [Citation17]. SSRs in non-coding regions of the genome are particularly valuable as they display higher polymorphism levels than markers in other regions and are extremely useful for analysis of genetic diversity, population structure, and cultivar variability [Citation18–20].
Previous studies investigated the genetic diversity and population structures of several edible mushrooms, including L. edodes [Citation20–22], Flammulina velutipes [Citation23–25], and Auricularia auricula-judae [Citation26]. In A. bisporus, previous studies assessed genetic diversity and population structure using RFLP markers [Citation27], RAPD markers [Citation28,Citation29], SSR markers [Citation30–32], and Inter Simple Sequence Repeat (ISSR) markers [Citation33,Citation34]. An extensive evaluation of commercially cultivated, genetically similar A. bisporus resources is therefore needed to support breeding programs. In this study, 40 SSR markers distributed across the genome were used to examine the genetic diversity and population structure of 156 A. bisporus strains collected from around the world.
2. Materials and methods
2.1. Agaricus bisporus strains and SSR markers
In total, 156 A. bisporus strains collected from markets around the world were used in this study. Strains were deposited and preserved at the Mushroom Division of the National Horticultural Science Academy, Rural Development Administration, Republic of Korea (Table S1). Strains were cultured in Petri dishes loaded with cellophane on compost dextrose agar (CDA) for 60 days at 25 °C in darkness. Cultured mycelia were harvested, freeze-dried for 4 days, and homogenized. DNA was extracted using a Plant SV mini kit (GeneAll, Seoul, Korea) in accordance with the manufacturer’s instructions, quantified using an Epoch Microplate Spectrophotometer (BioTek, Winooski, VT, USA), and adjusted to a final concentration of 20 ng/µL. Forty SSR markers with high polymorphic information content (PIC) values were selected, and allele counts for the 40 SSR markers were determined using the methods of Lee et al. [Citation31] and An et al. [Citation32] (Table S2).
Table 1. Genetic diversity parameters of 40 SSR markers with 156 Agaricus bisporus strains.
Table 2. Genetic diversity indices for distance-based groups and model-based subpopulations of 156 Agaricus bisporus strains.
2.2. PCR and genotyping
For PCR, 20 µL Excel TB 2× Taq Pre-Mix (Inclone Biotech, Yongin, Korea), 2 µL each primer (10 pmol), and 3 µL template DNA were combined in a final reaction volume of 40 µL. PCR was performed at 95 °C for 2 min; 30 cycles at 95 °C for 20 s, 55 °C for 40 s, and 72 °C for 45 s; and a final extension at 72 °C for 10 min. PCR product sizes were determined using a Fragment Analyzer (Advanced Analytical Technologies Inc., Santa Clara, CA, USA) and by genotyping using Pro Size® 2.0 software (Advanced Analytical Technologies Inc.).
2.3. Data analysis
Genotype data for each individual were scored and imported into PowerMarker ver. 3.25 [Citation35] for calculation of major allele frequency (MAF), number of genotypes (NG), number of alleles (NA), observed heterozygosity (HO), expected heterozygosity (HE), and polymorphism information content (PIC) values. A genotype accumulation curve was plotted using the R studio package “poppr” to determine the power of increasing numbers of SSR markers to distinguish individual genotypes [Citation36]. Agaricus bisporus strains were divided based on genetic distance-based groups and by model-based subpopulations. A phylogenetic tree was constructed using MEGA ver. 5.2 using the unweighted pair group method with arithmetic mean (UPGMA) inference in accordance with genetic distances determined using the Nei method [Citation37,Citation38]. Population structure was analyzed using STRUCTURE ver. 2.3.1 [Citation39]. The number of subpopulations (K) was assumed to be in the 1–10 range, and the length of burn-in and number of Monte Carlo Markov chains (MCMCs) were 10,000 and 100,000, respectively, with five replicates. STRUCTURE HARVESTER was used to determine delta K from the derived results [Citation40]. Each strain was divided into subpopulations or admixtures (Admix) based on the probability of belonging to each subpopulation. Strains sharing more than 80% of ancestry were assigned to one subpopulation. Strains and subpopulation were presented on an unrooted tree to reveal structured relationships between strains and subpopulations. Analysis of molecular variance (AMOVA) using GenAlex 6.41 was performed to determine the degree of genetic variation and strain differentiation within each group, and Hardy–Weinberg equilibrium (HWE) was assessed using “pegas” in the R studio [Citation41,Citation42].
3. Results
3.1. SSR polymorphisms and marker set selection
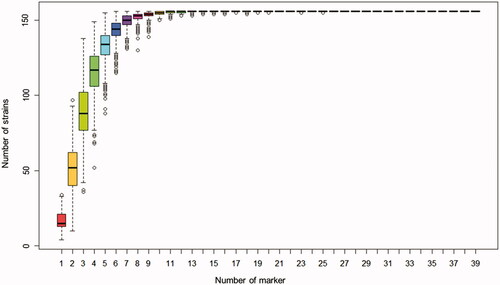
A population of 156 A. bisporus strains was genotyped using 40 SSR markers. Upon assessment of the 156 strains with the full set of 40 SSR, the major allele frequency (MAF) ranged from 0.20 (AB-gSSR-0182, AB-gSSR-1184) to 0.87 (AB-gSSR-1058), with an average of 0.431. The number of genotypes (NG) ranged from 3 (AB-gSSR-1058) to 33 (AB-gSSR-0940), with an average of 16.3, and the number of alleles (NA) ranged from 3 (AB-gSSR-1036, AB-gSSR-1058) to 25 (AB-gSSR-0940), with an average of 10.5 alleles. Observed heterozygosity (HO) ranged from 0.00 (AB-gSSR-1058, AB-gSSR-1208) to 0.97 (AB-gSSR-0709), with an average of 0.441, and expected heterozygosity (HE) ranged from 0.23 (AB-gSSR-1058) to 0.88 (AB-gSSR-1184), with an average of 0.697. The polymorphic information content (PIC) value ranged from 0.21 (AB-gSSR-1058) to 0.87 (AB-gSSR-1184), with an average of 0.660 (). A genotype accumulation curve for the population showed that the genotypes of the 156 strains could be distinguished using as few as seven markers (). Differences among strains were confirmed by construction of a phylogenetic UPGMA tree based on a combination of the seven markers (Figure S1).
Figure 1. Genotype accumulation curve to assess Agaricus bisporus genotype differentiation using increasing numbers of cumulative SSR markers. N loci were randomly sampled 1000 times for variance in each box. This analysis screened the minimum set of markers for strain discrimination.
3.2. Phylogenetic relationship and population structure of A. bisporus strains
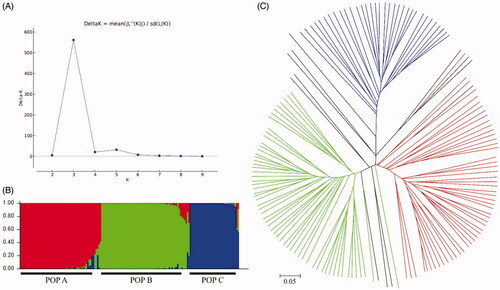
Phylogenetic analysis of the 156 A. bisporus strains divided the population into two groups: Group I and Group II (). Group I comprised 122 strains collected from Australia (1), Belgium (1), Brazil (1), Cambodia (1), Canada (3), China (6), France (5), Germany (9), Indonesia (2), Italy (1), Japan (7), Netherlands (3), New Zealand (2), Peru (1), South Korea (39), Switzerland (1), Thailand (3), UK (9), USA (26), and Vietnam (1). Group II comprised 34 strains from Brazil (3), Canada (6), France (2), Germany (3), Japan (3), Netherlands (2), New Zealand (2), Peru (1), South Korea (8), and USA (4). Grouping was not in accordance with the country origins of the strains (Table S1). The optimal number of subpopulations (K) for division of the A. bisporus population was three (). Strains were allocated to a subpopulation when the probability of belonging to that subpopulation was >80% (). Subpopulation A (POP A) comprised 51 strains collected from Australia (1), Brazil (1), Canada (2), China (4), Germany (4), UK (2), Italy (1), Japan (3), Cambodia (1), South Korea (21), Netherlands (2), New Zealand (2), Peru (1), and USA (6). Subpopulation B (POP B) comprised 57 strains from Canada (1), Germany (5), France (3), UK (7), Indonesia (2), Japan (3), South Korea (13), Netherlands (1), Thailand (3), and USA (19). Subpopulation C (POP C) comprised 33 strains from Brazil (3), Canada (6), Germany (3), France (2), Japan (3), South Korea (8), Netherlands (2), New Zealand (2), and USA (4). The remaining 15 strains, from Belgium (1), Switzerland (1), China (2), France (2), Japan (1), South Korea (5), Peru (1), USA (1), and Vietnam (1) were included in Admix (Table S1). An unrooted tree displayed the clear subpopulation structure ().
Figure 2. Phylogenetic tree of Agaricus bisporus strains. The 156 genotypes were divided into two clusters (Groups I and II). Strains were not geographically clustered.
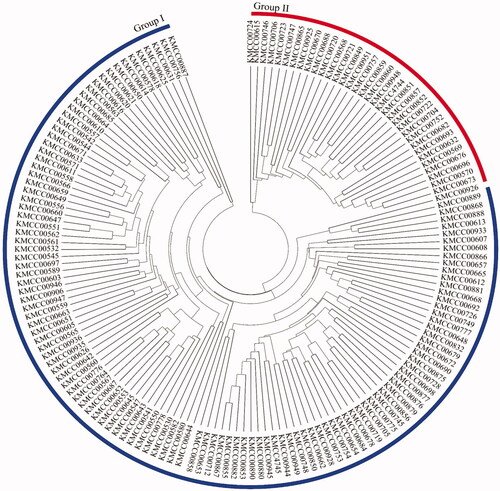
Figure 3. Subpopulations of Agaricus bisporus strains. Strains were assigned three subpopulations. (A) Delta K was calculated to estimate the optimal population number (K). (B) STRUCTURE ver.2.3.4 was used to assign each of the 156 strains to a subpopulation and visualize the probability of belonging to each subpopulation. Strains are arranged in a row and grouped by subpopulation within the whole sample. (C) Unrooted tree of A. bisporus strains. Colors indicate that the probability of each strain belonging to that specific subpopulation is ≥80%.
3.3. Genetic diversity
Strains were considered according to distance-based grouping. MAF was 0.468 for Group I and 0.541 for Group II, and HO was 0.439 for Group I and 0.449 for Group II. NG and NA values for Group I were approximately double those for Group II, at 13.6 and 9.1 for Group I and 6.1 and 5.8 for Group II, respectively. Diversity index He and PIC values were higher in Group I than in Group II, at 0.664 and 0.624 in Group I and 0.571 and 0.528 in Group II, respectively ().
Strains were also considered according to their model-based subpopulations. MAF and HO values were 0.509 and 0.393 for POP A, 0.532 and 0.470 for POP B, 0.547 and 0.452 for POP C, and 0.409 and 0.467 for Admix, respectively. of the three subpopulations, NG and NA values were the highest in POP A, at 7.7 and 6.3 for POP A, 7.0 and 6.1 for POP B, 5.6 and 5.5 for POP C, and 7.4 and 6.3 for Admix. Diversity index He values were 0.605, 0.581, 0.562, and 0.715 for POP A, POP B, POP C, and Admix, respectively, and PIC values were 0.553, 0.535, 0.519, and 0.677, respectively ().
3.4. Analysis of molecular variance and HWE
AMOVA was used to examine genetic variation for each group and subpopulation, and a fixed index Fst value was determined to confirm differentiation. Upon division of strains into genetic distance-based groups or model-based subpopulations, approximately 100% and 99% of the total genetic variation were observed between strains and Fst values were −0.002 and 0.013, respectively ().
Table 3. AMOVA analysis of genetic differentiation for groups and subpopulations of Agaricus bisporus.
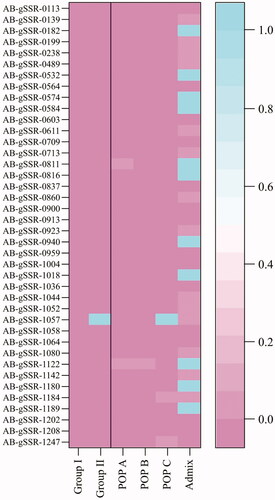
HWE was used to assess the genetic constitution of each group and subpopulation (). In the distance-based groups, strains in Group I deviated significantly from HWE for all markers, and those in Group II were in HWE for AB-gSSR-1057. For the model-based subpopulations, strains in POP A and POP B deviated significantly from HWE for all markers, while those in POP C were in HWE only for AB-gSSR-1057. Admix was confirmed to be in HWE for 11 markers (AB-gSSR-0182, AB-gSSR-0532, AB-gSSR-0574, AB-gSSR-0584, AB-gSSR-0811, AB-gSSR-0816, AB-gSSR-0940, AB-gSSR-1018, AB-gSSR-1122, AB-gSSR-1180, and AB-gSSR-1189).
Figure 4. Hardy–Weinberg equilibrium (HWE) plot for each group and subpopulation of Agaricus bisporus. Pink indicates significant deviation from HWE. Almost all the markers deviated significantly from the HWE but, The AB-gSSR-1057 marker was confirmed to be in HWE in Group II and POP C.
4. Discussion
In this study, it was possible to discriminate 156 globally collected A. bisporus strains with 40 SSR markers, confirming the efficiency of the SSR markers used in this study. The A. bisporus strains were not clustered by geographical distribution. Several studies have reported that the relationship between phylogenetic analysis and geographical distribution of the mushroom strains is not high. In the study of An et al. analyzed to 26 A. bisporus strains using 170 genomic SSR markers, the stains were not geographical clustered [Citation32] and L. edodes wild strains in Korea were not clustered by collected regions [Citation22].
Agaricus bisporus resources are widely sold in markets in many countries. A genotype accumulation curve indicated that A. bisporus strains could be distinguished using as few as seven SSR markers, and complete recognition of all multilocus genotypes was possible using 96 alleles (AB-gSSR-0182, 13 alleles; AB-gSSR-0238, 9; AB-gSSR-1018, 12; AB-gSSR-1184, 19; AB-gSSR-0913, 9; AB-gSSR-0940, 25; AB-gSSR-1080, 9), indicating that the seven SSR markers had the capacity to accurately identify the 156 globally collected A. bisporus strains ( and and ). The genotype accumulation curve allowed individual samples to be distinguished from random samples of n loci [Citation43]. The minimum number of markers can be readily determined using the accumulation curve method, potentially helping to refine minimum marker sets needed for sample discrimination.
For the set of 156 A. bisporus strains assessed with 40 SSR markers in this study, average MAF, NG, NA, HE, HO, and PIC value were 0.431, 16.3, 10.5, 0.697, 0.441, and 0.660, respectively. Among the diversity indices, HE and HO are sensitive to allele frequency [Citation44], and allele frequency helps to determine the PIC value [Citation45]. These diversity indices were higher than those reported for other mushrooms. NA and PIC values were 0.47 and 0.47 for A. auricular-judae, respectively [Citation26]; NA and PIC values were 2.9 and 0.43 for F. velutipes, respectively [Citation25]; and NG, NA, HE, HO, and PIC values were 5.5. 4.9, 0.552, 0.309, and 0.51 for L. edodes, respectively [Citation20]. Furthermore, the diversity indices in this study were higher than in recent A. bisporus studies. NA, HE, HO, and PIC values were 5, 0.68, 0.53, and 0.62, in an analysis of A. bisporus cultivars from USA (6), China (4), Netherlands (2), England (1), Germany (1), and Spain (1), and 13 wild strains from China, with 17 SSR markers conducted by Fu et al. [Citation19]. NG, NA, HE, HO, and PIC values were 2.3, 2.5, 0.40, 0.29, and 0.43 in an analysis of six A. bisporus strains with 44 markers by Lee et al. [Citation31]. Finally, NG, NA, HE, HO, and PIC values were 6.17, 5.47, 0.619, 0.227, and 0.569 in a study of 26 A. bisporus strains with 121 markers conducted by An et al. [Citation32]. The genetic diversity of the A. bisporus strains used in this study was higher than in other studies.
Analysis of genetic diversity and population structure provides valuable information on genetic resources for crop breeding [Citation12]. Genetic diversity analysis of cultivars and wild strains is underway to aid the development of new A. bisporus cultivars with desirable traits and improved adaptability. Diversity of A. bisporus resources, cultivars, and wild strains was assessed using molecular RFLP, SSR, and SNP markers [Citation30,Citation32,Citation46–48]. Genetic diversity was also assessed using SSR markers to incorporate disease resistance into breeding programs [Citation18,Citation19]. Understanding genetic diversity is an important factor in maximizing crop yields and developing sustainable agriculture [Citation49]. The globally collected strains in this study exhibited higher genetic diversity than other A. bisporus collections, and the results of this study will facilitate the analysis and use of these diverse strains, as well as cultivars and wild strains, in breeding programs to develop new A. bisporus cultivars with desirable traits.
In this study, the genetic diversity (HE and PIC values) of distance-based Group I was higher than that of Group II. Genetic diversity was generally higher for POP A and POP B than for POP C, and diversity was higher for POP A than POP B, in model-based subpopulations. Consequently, the genetic diversity of Group I, which consisted of strains from POP A and POP B, was high. The 122 strains in Group I were from 20 countries, whereas the 34 strains in Group II were from 10 countries. POP A contained 51 strains from 14 countries, POP B contained 57 strains from 10 countries, and POP C contained 33 strains from 9 countries. Genetic diversity was high in groups and subpopulations, and all groups and subpopulations contained strains from diverse countries.
AMOVA for each grouping method revealed that >99% of genetic variation in A. bisporus occurred between individual strains, with little variation observed between groups or subpopulations. This was supportive of high rates of genetic exchange among strains. Factors that can contribute to deviations from HWE include nonrandom mating, migration, mutation, natural selection, and mixing of subpopulations [Citation50]. The AB-gSSR-1057 marker was confirmed to be in HWE in Group II and POP C and was presumed to be indicative of the lower genetic diversity in Group II than in Group I.
In conclusion, this study screened high-efficiency SSR markers for their capacity to discriminate among A. bisporus strains collected worldwide. Genetic diversity was assessed using distance-based and model-based analysis. Analysis of genetic diversity not only facilitates germplasm preservation efforts, but can also provide guidance for better use of germplasms in genetic breeding programs [Citation49]. The results of this study will be beneficial for the future development of improved cultivars of A. bisporus.
Supplemental Material
Download MS Excel (12.3 KB)Supplemental Material
Download MS Excel (14.6 KB)Supplemental Material
Download MS Power Point (281.3 KB)Disclosure statement
No potential conflict of interest was reported by the authors.
Additional information
Funding
Related Research Data
References
- Royse DJ, BJ, Tan Q. Edible and medicinal mushrooms: technology and applications. In: Zied DC, Pardo-Giménez A, editors. Edible and medicinal mushrooms: technology and applications. New York, NY: John Wiley & Sons Ltd; 2017. p. 5–13.
- Reis FS, Barros L, Martins A, et al. Chemical composition and nutritional value of the most widely appreciated cultivated mushrooms: an inter-species comparative study. Food Chem Toxicol. 2012;50(2):191–197.
- Chen S, Oh S-R, Phung S, et al. Anti-aromatase activity of phytochemicals in white button mushrooms (Agaricus bisporus). Cancer Res. 2006;66(24):12026–12034.
- Jeong SC, Jeong YT, Yang BK, et al. White button mushroom (Agaricus bisporus) lowers blood glucose and cholesterol levels in diabetic and hypercholesterolemic rats. Nutr Res. 2010;30(1):49–56.
- Sonnenberg A, et al. Breeding and strain protection in the button mushroom Agaricus bisporus. In Proceedings of the 7th International Conference of the World Society for Mushroom Biology and Mushroom Products, 4–7 October 2011, Arcachon, France. 2011.
- Kabel MA, Jurak E, Mäkelä MR, et al. Occurrence and function of enzymes for lignocellulose degradation in commercial Agaricus bisporus cultivation. Appl Microbiol Biotechnol. 2017;101(11):4363–4369.
- Abid G, Mingeot D, Udupa SM, et al. Genetic relationship and diversity analysis of faba bean (Vicia faba L. var. minor) genetic resources using morphological and microsatellite molecular markers. Plant Mol Biol Rep. 2015;33(6):1755–1767.
- Rao VR, Hodgkin T. Genetic diversity and conservation and utilization of plant genetic resources. Plant Cell Tissue Organ Culture. 2002;68(1):1–19.
- Hamrick JL, Godt MW. Allozyme diversity in plant species. In: Brown AHD, Clegg MT, Kahler AL, Weir BS, editors. Plant population genetics, breeding, and genetic resources. Sunderland: Sinauer Associates Inc.; 1990. p. 43–63.
- Sonnenberg ASM, Baars JJP, Gao W, et al. Developments in breeding of Agaricus bisporus var. bisporus: progress made and technical and legal hurdles to take. Appl Microbiol Biotechnol. 2017;101(5):1819–1829.
- Callac P, Imbernon M, Kerrigan RW, et al. The two life cycles of Agaricus bisporus. In Mushroom biology and mushroom products. University Park, PA: Pennsylvania State University; 1996. p. 57–66.
- Xiang X, Li C, Li L, et al. Genetic diversity and population structure of Chinese Lentinula edodes revealed by InDel and SSR markers. Mycol Prog. 2016;15(4):37.
- Choudhary G, Ranjitkumar N, Surapaneni M, et al. Molecular genetic diversity of major Indian rice cultivars over decadal periods. PLoS One. 2013;8(6):e66197.
- López PA, Widrlechner MP, Simon PW, et al. Assessing phenotypic, biochemical, and molecular diversity in coriander (Coriandrum sativum L.) germplasm. Genet Resour Crop Evol. 2008;55(2):247–275.
- Agarwal M, Shrivastava N, Padh H. Advances in molecular marker techniques and their applications in plant sciences. Plant Cell Rep. 2008;27(4):617–631.
- Kalia RK, Rai MK, Kalia S, et al. Microsatellite markers: an overview of the recent progress in plants. Euphytica. 2011;177(3):309–334.
- Miah G, Rafii MY, Ismail MR, et al. A review of microsatellite markers and their applications in rice breeding programs to improve blast disease resistance. Int J Mol Sci. 2013;14(11):22499–22528.
- Rokni N, Goltapeh EM, Shafeinia A, et al. Evaluation of genetic diversity among some commercial cultivars and Iranian wild strains of Agaricus bisporus by microsatellite markers. Botany. 2016;94(1):9–13.
- Fu Y, Wang X, Li D, et al. Identification of resistance to wet bubble disease and genetic diversity in wild and cultivated strains of Agaricus bisporus. IJMS. 2016;17(10):1568.
- Lee H-Y, Moon S, Shim D, et al. Development of 44 novel polymorphic SSR markers for determination of shiitake mushroom (Lentinula edodes) cultivars. Genes. 2017;8(4):109.
- Xiao Y, Liu W, Dai Y, et al. Using SSR markers to evaluate the genetic diversity of Lentinula edodes’ natural germplasm in China. World J Microbiol Biotechnol. 2010;26(3):527–536.
- Lee H-Y, Moon S, Ro H-S, et al. Analysis of genetic diversity and population structure of wild strains and cultivars using genomic SSR markers in Lentinula edodes. Mycobiology. 2020;48(2):115–121.
- Liu XB, Li J, Yang ZL. Genetic diversity and structure of core collection of winter mushroom (Flammulina velutipes) developed by genomic SSR markers. Hereditas. 2018;155(1):3.
- Liu XB, Feng B, Li J, et al. Genetic diversity and breeding history of winter mushroom (Flammulina velutipes) in China uncovered by genomic SSR markers. Gene. 2016;591(1):227–235.
- Zhang R, Hu D, Zhang J, et al. Development and characterization of simple sequence repeat (SSR) markers for the mushroom Flammulina velutipes. J Biosci Bioeng. 2010;110(3):273–275.
- Zhang RY, Hu DD, Gu JG, et al. Development of SSR markers for typing cultivars in the mushroom Auricularia auricula-judae. Mycol Prog. 2012;11(2):587–592.
- Loftus M, Moore D, Elliott T. DNA polymorphisms in commercial and wild strains of the cultivated mushroom, Agaricus bisporus. Theor Appl Genet. 1988;76(5):712–718.
- Moore AJ, Challen MP, Warner PJ, et al. RAPD discrimination of Agaricus bisporus mushroom cultivars. Appl Microbiol Biotechnol. 2001;55(6):742–749.
- Khush RS, Becker E, Wach M. DNA amplification polymorphisms of the cultivated mushroom Agaricus bisporus. Appl Environ Microbiol. 1992;58(9):2971–2977.
- Foulongne-Oriol M, Spataro C, Savoie J-M. Novel microsatellite markers suitable for genetic studies in the white button mushroom Agaricus bisporus. Appl Microbiol Biotechnol. 2009;84(6):1125–1135.
- Lee H-Y, Raveendar S, An H, et al. Development of polymorphic simple sequence repeat markers using high-throughput sequencing in button mushroom (Agaricus bisporus). Mycobiology. 2018;46(4):421–428.
- An H, Jo I-H, Oh Y-L, et al. Molecular characterization of 170 new gDNA-SSR markers for genetic diversity in button mushroom (Agaricus bisporus). Mycobiology. 2019;47(4):527–532.
- Wang Z, Chen M, Cai Z, et al. DNA fingerprinting of genetic diversity of Agaricus bisporus. In Mushroom biology and mushroom products. In Proceedings of the 7th International Conference on Mushroom Biology and Mushroom Products, Arcachon, France, 4–7 October, 2011. Volume 2. Poster session. 2011. France: Institut National de la Recherche Agronomique (INRA).
- Malekzadeh K, Shahri BJM, Mohsenifard E. Use of ISSR markers for strain identification in the button mushroom, Agaricus bisporus. In Proceedings of the 7th international conference on mushroom biology and mushroom products (ICMBMP7). 2011. Citeseer.
- Liu K, Muse SV. PowerMarker: an integrated analysis environment for genetic marker analysis. Bioinformatics. 2005;21(9):2128–2129.
- Kamvar ZN, Tabima JF, Grünwald NJ. Poppr: an R package for genetic analysis of populations with clonal, partially clonal, and/or sexual reproduction. PeerJ. 2014;2:e281.
- Nei M, Chesser RK. Estimation of fixation indices and gene diversities. Ann Hum Genet. 1983;47(3):253–259.
- Kumar S, Stecher G, Tamura K. MEGA7: molecular evolutionary genetics analysis version 7.0 for bigger datasets. Mol Biol Evol. 2016;33(7):1870–1874.
- Pritchard JK, Wen W, Falush D. Documentation for STRUCTURE software: Version 2; 2003.
- Earl DA, vonHoldt BM. Structure harvester: a website and program for visualizing Structure output and implementing the Evanno method. Conservation Genet Resour. 2012;4(2):359–361.
- Peakall R, Smouse PE. GENALEX 6: genetic analysis in Excel. Mol Ecol Notes. 2006;6(1):288–295.
- Paradis E. pegas: an R package for population genetics with an integrated-modular approach. Bioinformatics. 2010;26(3):419–420.
- Grünwald NJ, Everhart SE, Knaus BJ, et al. Best practices for population genetic analyses. Phytopathology. 2017;107(9):1000–1010.
- Greenbaum G, Templeton AR, Zarmi Y, et al. Allelic richness following population founding events – a stochastic modeling framework incorporating gene flow and genetic drift. PLOS One. 2014;9(12):e115203.
- Sharma M, Kantartzi S, Stewart J. Molecular diversity and polymorphism information content of selected Gossypium hirsutum accessions. Summ Ark Cotton Res. 2009;582:124–126.
- Oh Y-L, Choi I-G, Kong W-S, et al. Evaluating genetic diversity of Agaricus bisporus accessions through phylogenetic analysis using single-nucleotide polymorphism (SNP) markers. Mycobiology. 2020;49(1):61–68.
- Wang L-n, Gao W, Wang Q-y, et al. Identification of commercial cultivars of Agaricus bisporus in China using genome-wide microsatellite markers. J Integr Agric. 2019;18(3):580–589.
- Xu J, Kerrigan RW, Callac P, et al. Genetic structure of natural populations of Agaricus bisporus, the commercial button mushroom. J Heredity. 1997;88(6):482–488.
- Fu Y-B. Understanding crop genetic diversity under modern plant breeding. Theor Appl Genet. 2015;128(11):2131–2142.
- Schaid DJ, Batzler AJ, Jenkins GD, et al. Exact tests of Hardy–Weinberg equilibrium and homogeneity of disequilibrium across strata. Am J Hum Genet. 2006;79(6):1071–1080.