
Abstract
Amylomyces rouxii is commonly found as amylolytic fungi in tapai fermentation. However, its diversity is rarely reported despite being often used for food production in Southeast Asia. This research aims to analyze the genetic diversity and the distribution pattern of A. rouxii from Ragi tapai in Java Island, Indonesia. We isolated the fungus from samples obtained from Ragi tapai producing centers in Bandung, Sumedang, Muntilan, Blora, Yogyakarta, and Bondowoso. The obtained isolates were molecularly identified based on the ribosomal regions ITS1/ITS2 and D1/D2, then analyzed for phylogenetic tree reconstruction, genetic distance, genetic variation, and haplotype networking. Six isolates showed specific morphological traits of A. rouxii. However, phylogenetic tree reconstruction on the ribosomal genes showed that the isolates were grouped into two different clades related to two species. Clade A included BDG, SMD, and MTL isolates related to A. rouxii, whereas clade B included YOG, BLR, and BDS isolates related to Mucor indicus. The genetic distances between clades for ITS1/ITS2 and D1/D2 were 0.6145 and 0.1556, respectively. In conclusion, we confirmed the genetic diversity of molds from Ragi tapai in Java Island and showed that the isolates are not only related to A. rouxii as reported before.
1. Introduction
Indonesia is famous for fermented food products, such as tapai. In Java Island, different kinds of tapai can be found, such as peyeum from West Java, tapai ketan from Central Java, and tapai manis from East Java [Citation1]. The production of traditional fermented food through the saccharification and fermentation process. Those processes include the addition of the microbial-filled inoculum with amylolytic and fermentative properties. In Indonesia, these types of inoculum are called Ragi tapai.
Ragi tapai is the dry starter culture containing a mixture of pure microorganism culture, rice flour, and spices such as pepper, garlic, cinnamon, cayenne, and water. It is usually circle-shaped, dry, and white-colored, about 2.5 cm and 0.5 in thickness. The small-scale industry often manufactures ragi for tapai, other fermented foods, and beverages production [Citation2,Citation3].
The fermentation process in ragi involves two groups of microorganisms, the group responsible for breaking down the starch into glucose and the group which converts glucose into ethanol [Citation4]. The amylolytic and fermentative microbes which had been successfully isolated from Ragi tapai in Indonesia, including Amylomyces rouxii, Rhizopus oryzae, Endomycopsis burtonii, Mucor spp., Candida utilis, Saccharomyces cerevisiae, and some lactic acid bacteria, such as Pediococcus pentosaceus, Lactobacillus plentarum, and L. fermentum [Citation5–7,Citation8,Citation9,Citation10].
Amylomyces is a monotypic genus with only one species, A. rouxii, which can break down starch to glucose. This mold produces the amyloglucosidase enzyme for fermentation and grows on raw substrates. However, it is unable to sporulate [Citation11]. This species has specific characteristics, including its inability to form sporangia, and often produces abortive sporangia (sporangia without spores) and its abundance of chlamydospores. Amylomyces rouxii is known with other synonyms, including Chlamydomucor rouxii, C. oryzae, C. racemosus, C. rouxianus, and Rhizopus chlamydosporus [Citation12].
Amylomyces rouxii had a vast dispersal due to its usage in ragi as a starter inoculum for tapai production. However, research about genetic diversity and distribution patterns of A. rouxii is still limited. The most recent research to our knowledge about the genetic diversity of A. rouxii in Java Island was reported in 2012 about the isolation of amylolytic mold from Ragi tapai "66" and "SAE," which identified the presence of A. rouxii in the samples [Citation13].
The recent trend of genetic diversity analysis is the usage of DNA barcoding methods. This method is often used to rapidly identify species using a short sequence DNA as its identifier [Citation14]. This method can accurately analyze the fungal diversity by using DNA sequences from ribosomal DNA (rDNA). This region includes the Internal Transcribed Spacer (ITS) genes and 28S rRNA genes. The ITS region consists of ITS1 located between 18S rRNA to 5.8S rRNA, and ITS2 located between 5.8S rRNA and 28S rRNA. Meanwhile, the 28S rRNA contains D1/D2 region as an identifier for DNA barcoding [Citation15].
The advantages of using DNA sequences for fungal phylogenetic analysis are its relatively short fragments, low variability, and ease of amplification [Citation16]. These DNA regions usually give better taxonomy resolution than coding regions previously used. The simultaneous use of ITS1/ITS2 and D1/D2 improved the success rate for identification at the species level, especially between closely related species [Citation17].
Proper investigation of the genetic diversity and distribution pattern of A. rouxii is necessary to enrich the knowledge about Ragi tapai and improve the quality of tapai on Java Island. Although certain information about A. rouxii had been reported earlier, identification using DNA barcoding based on ribosomal regions ITS1/ITS2 and D1/D2 is needed to analyze the phylogenetic relationship between A. rouxii various places in Java Islands. In the present study, A. rouxii from Ragi tapai have been isolated, characterized, identified by molecular techniques, further studied its genetic diversity, and reconstructed its phylogenetic trees based on ribosomal genes ITS1/ITS2 and D1/D2.
2. Materials and methods
2.1. Samples collection
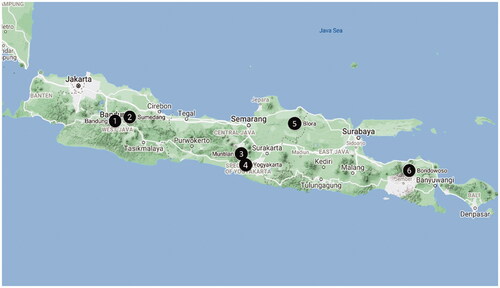
The Ragi tapai were collected from six different tape-producing cities on Java Island. The locations for sample collection including Pasar Gegerkalong, Bandung, West Java; Pasar Tanjung, Sumedang, West Java; Pasar Muntilan, Muntilan, Central Java; Pasar Blora, Blora, Central Java; traditional market in Yogyakarta, D.I. Yogyakarta; and Pasar Kali Nangkaan, Bondowoso, East Java, the map is shown in . All the collected Ragi tapai were stored in plastic zipper bags and put inside the boxes until the next steps.
Figure 1. Location of Ragi tapai sample collection sites in Java Island.1. Bandung, 2. Sumedang, 3. Muntilan, 4. Yogyakarta, 5. Blora, 6. Bondowoso. Map from Google Maps.
2.2. Samples preparation
One gram of Ragi tapai was cultured in 5 mL potato dextrose broth (PDB) media and homogenized for 1 min. Then, the cultures were incubated at room temperature for 3–7 d for initial screening. The screening results were transferred to potato dextrose agar (PDA) in a petri dish by dot method and incubated for 3–7 d until the stable isolates were obtained.
2.3. Microscopic and macroscopic identification
The identification was conducted on all stable isolates from PDA to confirm the presence of A. rouxii. Macroscopic identification included color, diameter, and texture of colonies. Microscopic identification was performed by observing the isolates previously stained with glycerol and Trypan blue under the microscope. Microscopic identification included the presence of abortive sporangia, chlamydospores, and coenocytic [Citation12].
2.4. DNA analysis
Genomic DNA extraction was performed using Quick-DNA Fungal/Bacterial Miniprep kit (Zymo Research) under the original protocol. Extracted DNA concentration and purity were tested using Nanodrop. Then, 1 µL of extracted DNA was placed on Nanodrop and absorbed on 260/280 nm and 260/230 nm. DNA amplification was performed on ribosomal DNA ITS1/ITS2 and D1/D2 regions. ITS1/ITS2 region was amplified with universal primers ITS-1 (5′-TCCGTCGGTGAACCTGCGG-3′) and ITS-4 (5′-TCCTCCGCTTATTGATATGC-3′). D1/D2 region was amplified with universal primers NL-1 (5′-GCATATCAATAAGCGGAGGAAAAG-3′) and NL-4 (5′-GGTCCGTGTTTCAAGACGG-3′) [Citation17].
The amplification was conducted in 25 μL reaction using PCR Master Mix consisting of 9.5 µL ddH2O, 12.5 µL MyTaq Red Mix 2x (Bioline), approximately 10 ng (1 µL) DNA template, and 0.4 μM (1 µL) of each primer. The PCR parameters were as follows: initial denaturation at 95 °C for 3 min; 35 cycles of 95 °C for 10 s, 52 °C for 30 s, and 72 °C for 45 s; and final hold at 4 °C. Electrophoretic analysis of the PCR products was conducted to reveal the size of DNA bands. The amplicons were subjected to bi-directional sequencing for nucleotides sequencing and conducted in First Base Sdn Bhd (Malaysia) using the Big Dye Terminator (Applied Biosystems) and the ABI 3730xl Genetic Analyzer (Applied Biosystems).
2.5. Sequences analysis and alignment
DNA sequences of ITS1/ITS2 and D1/D2 regions were edited with GeneStudio (GeneStudio, Inc., Georgia, USA) and SeqMan (DNASTAR Inc., Madison, USA) to create consensus sequences. The consensus sequences were analyzed with Nucleotide BLAST (https://blast.ncbi.nlm.nih.gov/ Blast.cgi) to predict the corresponding species from isolates. The sequenced nucleotides and sequences from the NCBI database were combined with Rhizopus oryzae sequences as an outgroup. Multiple sequences alignments were performed using MESQUITE [Citation18]. The DNA sequences of this study's ITS1/ITS2 and D1/D2 regions had been assigned to the GenBank database under accession Nos. MZ851361–MZ851366 and MZ841799–MZ841804, respectively.
2.6. Phylogenetic analysis
The combined sequences of ITS1/ITS2 and D1/D2 region were analyzed with the Kimura-2-parameter (K2P) model in MEGA X to estimate the genetic distances. Phylogenetic trees were reconstructed using the Neighbor-Joining (NJ) method with 1000 bootstrap value and K2P model in MEGA X. Rhizopus oryzae 126.05 (HQ435095), and R. oryzae FSU 8743 (JN939136) were set as the outgroup for ITS1/ITS2 and D1/D2 phylogenetic analysis, respectively. Genetic variation between clade, including haplotypes, polymorphic sites, parsimony sites, haplotype diversity, and nucleotide diversity, were analyzed with DnaSP 5.10.01 [Citation19]. The distribution pattern of isolates was performed with Principal Coordinate Analysis (PCoA) in GenAlEx 6.5 (Genetic Analysis in Excel) [Citation20].
3. Results
3.1. Morphological characteristics of isolates
Six isolates were observed, showing the characteristics of A. rouxii. Macroscopic and microscopic identification were subjected to Ragi tapai isolates to detect any matching traits with specific characteristics of A. rouxii. Colonies growth on potato dextrose agar (PDA) showed brownish gray to white colonies and light cream on reverse. Microscopic features of A. rouxii include abortive sporangia, abundant chlamydospores, and coenocytic hyphae [Citation12]. The morphological characteristics of Ragi tapai isolates are shown in .
Table 1. Macroscopic and microscopic characteristics of Ragi tapai isolatesa.
Six isolates grown in PDA showed similar colonies' characteristics with A. rouxii previously described by (Citation12]. All isolates showed colonies' color ranging from black with a white margin on BLR to grayish-white on BDS to white colonies on other isolates. On the reverse, all isolates showed light cream color, aside from slightly duller cream on BLR. BLR also showed different fibrous texture rather than floccose as observed on other isolates. These different macroscopic features of BLR might indicate the presence of different strains of A. rouxii or other molds in Ragi tapai.
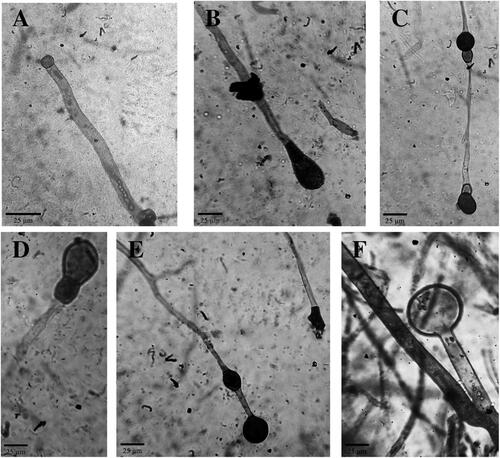
The presence of abortive sporangia is a specific characteristic of A. rouxii. An abortive sporangium is a type of sporangia formed by the failure of sporulation during spores formation [Citation12]. This characteristic is a unique trait only possessed by the monotypic genera of A. rouxii mold. All isolates were observed to form abortive sporangia in the upper hemisphere of the sporangium. The sightings of abortive sporangia in Ragi tapai isolates are shown in .
Figure 2. Abortive sporangia of Ragi tapai isolates (400x). (A) BDG, (B) SMD, (C) MTL, (D) BLR, (E) YOG, (F) BDS.
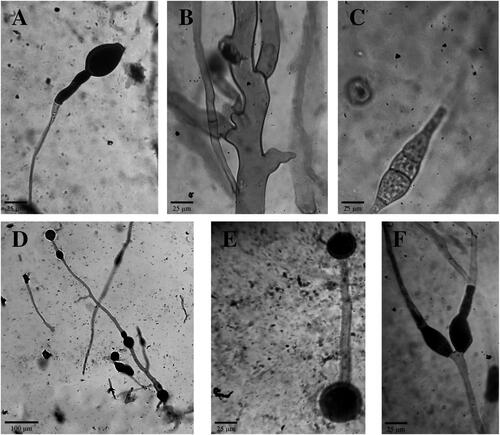
Aside from the presence of abortive sporangia, A. rouxii possesses other morphological characters. Macroscopically, A. rouxii colonies consist of white or brownish-gray mycelia. Microscopically, A. rouxii hyphae are coenocytic hyphae without septa which belong to the Zygomycetes group. A. rouxii also possesses an abundance of chlamydospores for asexual reproduction and zygospores for sexual reproduction. Some A. rouxii also showed the formation of Y-shaped spore-like bodies [Citation12]. Microscopic features of Ragi tapai isolates are shown in .
Figure 3. Microscopic features of Ragi tapai isolates. (A) oval abortive sporangia with enlarged apophyses SMD (400x); (B) Coenocytic hypha YOG (400x); (C) Zygospore YOG (400x); (D) Chlamydospores BLR (100x); (E) Intercalary chlamydospores BDS (400x); (F) Y-shaped spore-like bodies BLR (400x).
3.2. NCBI Blast results
Query cover values for the selected identical species based on BLAST results must be ≥ 80% [Citation21]. Consequently, homolog species must possess similarity values above 99.6% for the ITS region and 99.8% for the LSU region [Citation22]. The top BLAST results based on the highest query cover and similarity values of ribosomal genes ITS1/ITS2 and D1/D2 are shown in .
Table 2. NCBI BLAST results of ITS1/ITS2 region of ribosomal DNA.
Table 3. NCBI BLAST results of D1/D2 region of ribosomal DNA.
BLAST results showed different groups of isolates based on their homolog species for both ITS1/ITS2 and D1/D2. The group consisted of SMD, BDG, and MTL were identical to Amylomyces rouxii, while the other group consisted of BLR, BDS, and YOG were identical to Mucor indicus. In addition, YOG isolate on ribosomal region ITS1/ITS2 showed the most identical homolog species to Mucor indicus F5-02 and Rhizomucor sp. Rm-33 with 100% similarity.
3.3. Phylogenetic tree of ITS1/ITS2 and D1/D2 sequences
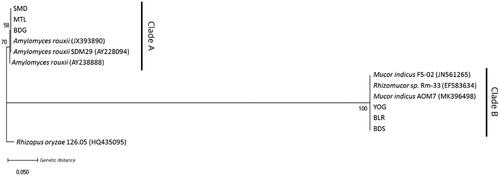
Phylogenetic tree reconstruction of ribosomal gene ITS1/ITS2 in showed the formation of two distinctive clades. Clade A consisted of BDG, MTL, and SMD isolates that formed a monophyletic group with A. rouxii (JX393890), A. rouxii SDM29 (AY228094), and A. rouxii (AY238888) with average genetic distances 0.0006. Clade B consisted of BLR, BDS, and YOG isolates that formed a monophyletic group with Mucor indicus F5-02 (JN561265), M. indicus AOM7 (MK396498), and Rhizomucor sp. Rm-33 (EF583634) with zero average genetic distances. Both clades were separated by average genetic distances of 0.6145. The genetic distances of ribosomal region ITS1/ITS2 are presented in Table S1.
Figure 4. Phylogenetic tree of ITS1/ITS2 region using the Neighbor-Joining (NJ) method and Kimura-2-parameter (K2P) with 1000 bootstrap value.
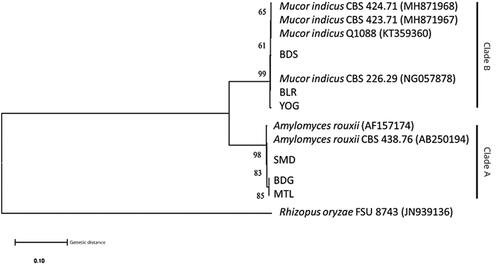
Phylogenetic tree reconstruction of ribosomal gene D1/D2 in showed similar results as ITS1/ITS2. The phylogenetic tree of ribosomal gene D1/D2 formed two distinctive clades between Ragi tapai isolates. Clade A consisted of BDG, MTL, and SMD isolates that formed a monophyletic group with A. rouxii CBS 438.76 (AB250194) and A. rouxii (AF157174) with average genetic distances 0.0033. Clade B consisted of BLR, BDS, and YOG isolates that formed a monophyletic group with M. indicus CBS 424.71 (MH871968), M. indicus CBS 423.71 (MH871967), M. indicus Q1088 (KT359360), and M. indicus CBS 226.29 (NG057878) with average genetic distances 0.0025. Both clades were separated by average genetic distances of 0.1556. The genetic distances of ribosomal region ITS1/ITS2 are shown in Supplementary Table S2.
Figure 5. Phylogenetic tree of D1/D2 region using the Neighbor-Joining (NJ) method and Kimura-2-parameter (K2P) with 1000 bootstrap value.
3.4. Genetic variation
The results of genetic variation analysis showed higher variation in ribosomal region ITS1/ITS2 compared to the D1/D2 region based on the number of polymorphic sites and nucleotides diversity. The total fragment length of ribosomal region ITS1/ITS2 is 565 bp for both clades. As for ribosomal gene D1/D2, the total fragment length for both clades is 564 bp. Genetic variation between clades of ribosomal regions ITS1/ITS2 and D1/D2 is shown in .
Table 4. Genetic variation between clades of ITS1/ITS2 and D1/D2 regions of ribosomal DNA.
ITS1/ITS2 sequences showed more polymorphic sites in clade B than clade A. Clade A possessed fewer polymorphic sites 7 bp, with lower nucleotides diversity 0.00413. In contrast, clade B possessed 9 bp polymorphic sites with nucleotide diversity 0.00566. Both clades possessed the same haplotype and haplotype diversity with 3 haplotypes and 0.600 haplotype diversity.
Ribosomal gene D1/D2 showed less significant genetic variation between clades than ITS1/ITS2. Both clades in ribosomal gene D1/D2 possessed the same numbers of polymorphic sites, 4 bp. The difference was shown in clade A for more parsimony sites and nucleotide diversity. However, clade B possessed more haplotypes and higher haplotype diversity than clade A.
3.5. Distribution pattern of Ragi tapai isolates
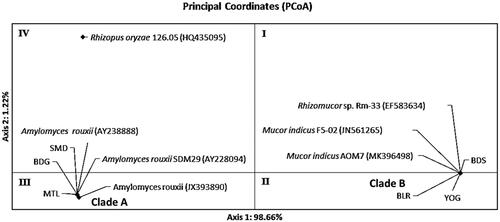
The distribution pattern of Ragi tapai isolates with PCoA supported the phylogenetic tree reconstruction by forming two similar clades. PCoA results of ribosomal region ITS1/ITS2 in showed the formation of two clades in quadrants II and III. Quadrant II showed the distribution of clade B that consisted of BLR, YOG and BDS isolate with M. indicus F5-02 (JN561265), M. indicus AOM7 (MK396498), and Rhizomucor sp. Rm-33 (EF583634). In quadrant III, clade A consisted of SMD, BDG and MTL isolates with A. rouxii (JX393890), A. rouxii SDM29 (AY228094), and A. rouxii (AY238888). Both clades were separated from R. oryzae 126.05 (HQ435095) as the outgroup.
Figure 6. Distribution pattern of ragi isolates using Principal Coordinates Analysis (PCoA) based on ribosomal genes ITS1/ITS2.
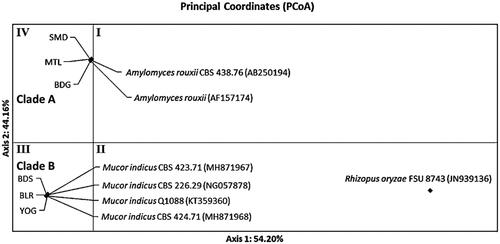
The distribution pattern of Ragi tapai isolates of ribosomal gene D1/D2 showed similar results with ITS1/ITS2. PCoA results of ribosomal gene D1/D2 in showed the formation of two clades clustered in different quadrants. Quadrant III showed clade B distribution consisting of YOG, BLR, and BDS isolates with M. indicus CBS 424.71 (MH871968), M. indicus CBS 423.71 (MH871967), M. indicus Q1088 (KT359360), and M. indicus CBS 226.29 (NG057878). Quadrant IV showed the distribution of clade A consisted of BDG, SMD, and MTL isolates with A. rouxii CBS 438.76 (AB250194) and A. rouxii (AF157174). Both clades were separated from R. oryzae FSU 8743 (JN939136) as the outgroup.
Figure 7. Distribution pattern of ragi isolates using Principal Coordinates Analysis (PCoA) based on ribosomal genes D1/D2.
4. Discussion
This study investigated the genetic diversity and distribution pattern of molds from Ragi tapai in Java Island based on ribosomal regions ITS1/ITS2 and D1/D2. Six isolates showed similar macroscopic and microscopic features to A. rouxii. Between all isolates, BLR and BDS showed different morphological characteristics in colonies' color and texture from the others. The characteristics of those isolates might indicate the presence of different strains of A. rouxii or other molds in Ragi tapai which are closely-related to A. rouxii, such as R. oryzae, Rhizopus spp., Mucor javanicus, and Mucor circinelloides [Citation33].
Higher genetic diversity was observed in the ribosomal region ITS1/ITS2 based on the genetic variation analysis. ITS1/ITS2 region possessed more polymorphic sites and higher nucleotides diversity on both clades than ribosomal gene D1/D2. These results showed that the ribosomal region ITS1/ITS2 is a better marker to identify closely related species, including intraspecies diversity between strains in a species [Citation34]. It is linked to the fact that the ITS1/ITS2 region is a non-coding region of small subunit (SSU) rDNA, while the D1/D2 region is a coding region of large subunit (LSU) rDNA. It means that ribosomal gene D1/D2 is more conserved than ITS1/ITS2, causing higher substitution rates and genetic variation in ITS1/ITS2 region [Citation35].
Based on sequence analysis of ribosomal regions ITS1/ITS2 and D1/D2, different mold species were identified from the isolates, presumably identified as entirely A. rouxii isolates. Phylogenetic tree reconstruction on both ribosomal genes showed that isolates from ragi were grouped into two different clades related to two mold species. Clade A consisted of BDG, MTL, and SMD which related to A. rouxii. Meanwhile, BLR, BDS, and YOG isolates were grouped in Clade B which is related to Mucor indicus. The genetic distances between clades for both ribosomal regions ITS1/ITS2 and D1/D2 were 0.6145 and 0.1556, respectively. Genetic distances between both clades exceeded the mean interspecific genetic distances for fungal species identification at 0.0094 [Citation36], which implied that both clades could be identified as different species.
Previous researchers stated that M. indicus was the synonym of A. rouxii and therefore considered the same species [Citation37,Citation38]. It was also widely known to possess fermentative properties and often used as starters in beer and traditional fermented foods production, such as tape, tempe, and alcoholic drinks [Citation4,Citation39,Citation40]. However, our results showed that the genetic distance of ribosomal regions ITS1/ITS2 and D1/D2 between A. rouxii and M. indicus clades exceeded the species and genus threshold despite possessing similar characteristics. Thus, based on this study, A. rouxii and M. indicus belong to different species and questioned the current taxonomic standing of M. indicus.
Mucor indicus is a dimorphic member of Mucorales that possesses filamentous form and yeast-like form. It shared a similar characteristic with A. rouxii regarding the presence of abortive sporangia. This similar morphological adaptation might be related to their usage in traditional fermented food production [Citation41]. It had been reported that M. indicus grown at 40 °C for seven days failed to sporulate and started to produce abortive sporangia [Citation42]. A similar condition might occur during fermentation by the CO2 production that increases the temperature and leads to abortive sporangia formation in M. indicus.
The issue regarding taxonomic standing of A. rouxii did not only occur in this present study between A. rouxii and M. indicus [Citation43] was the first one who suggested the reclassification of the taxa based on rDNA ITS sequence similarity between A. rouxii and R. oryzae. It also stated that some strains of R. oryzae had undergone morphological or physiological variations that resulted in A. rouxii characteristics. Zheng et al. [Citation44] supported this idea by stating that the long-term adaptation to the fermentative environment caused degeneration that resulted in the morphological changes of A. rouxii and did not occur naturally as varietal characteristics. Amylomyces rouxii could also be considered the mutant form of the non-sporangiospores-forming strains of R. oryzae or Rhizopus delemar [Citation41].
This study also reported the distribution patterns of molds in Ragi tapai using PCoA, resulting in two distinctly separated clusters on different quadrants. The patterns supported the phylogenetic tree by forming similar clades that related to A. rouxii and M. indicus in similar patterns. The formation of patterns suggested the presence of geographical distribution between isolates across Java Island. Ragi tapai isolates collected from western Java in Clade A were clustered with A. rouxii, while the eastern Java isolates in Clade B tend to cluster with M. indicus. This result matched the previous finding identifying A. rouxii (formerly Chlamydomucor oryzae) from the ragi sample collected from Bandung, West Java [Citation45]. Thus, this study pointed out the distinctive distribution pattern between molds species that are present in Ragi tapai in Java Island and the possibility of similar findings in other samples of Ragi tapai elsewhere.
5. Conclusion
Universal primers ITS-1/ITS-4 and NL-1/NL-4 were able to identify M. indicus and A. rouxii as different species and proved versatility to identify closely related species. Based on the results, ribosomal regions ITS1/ITS2 and D1/D2 could be used to study the genetic diversity and distribution pattern of molds from Ragi tapai in Java Island.
Author contributions
E.D. obtained and analyzed the data and wrote the manuscript. T.A. designed the research, analyzed the data, and revised the manuscript. M.I. designed the research, analyzed the data, revised the manuscript, and supervised the project.
Supplemental Material
Download MS Excel (12.5 KB)Acknowledgments
The authors would like to thank the Indonesian Ministry of Research and Technology for supporting this research through the Master Research Grants program (nr. 2012/UN1/DITLIT/DIT-LIT/PT/2020).
Disclosure statement
The authors declare no conflicts of interest. All the experiments were undertaken in this study comply with the country's current laws where they were performed.
References
- Cronk TC, Steinkraus KH, Hackler LR, et al. Indonesian Tapé Ketan fermentation. Appl Environ Microbiol. 1977;33(5):1067–1073.
- Azmi AS, Ngoh GC, Mel M, et al. Ragi tapai and Saccharomyces cerevisiae as potential culture in viscous fermentation medium for ethanol production. Afr J Biotechnol. 2010;9(42):7122–7127.
- Kasmidjo RB. 1983. Mikrobiologi ragi. Yogyakarta: PAU Pangan dan Gizi Universitas Gadjah Mada.
- Ardhana MM, Fleet GH. The microbial ecology of tape ketan fermentation. Int J Food Microbiol. 1989;9(3):157–165.
- Gandjar I. 2003. Tapai from Cassava and Cereals (pp. 13–17). Presented at the the First International Symposium and Workshop on Insight into the World of Indigenous Fermented Foods for Technology Development and Food Safety, the First International Symposium and Workshop on Insight into the World of Indigenous Fermented Foods for Technology Development and Food Safety: Kasetsart University.
- Ko SD. Tape fermentation. Appl Microbiol. 1972;23(5):976–978.,
- Komagata K, Rahayu E, Uchimura T. 1988. Identification of lactic acid bacteria isolated from a Chinese starter, ragi, in Indonesia. LIPI.
- Saono S, Basuki T, Sastraatmadja S. 1978. Indonesia ragi. Symposium on indigenous foods. Bangkok, Thailand: Presented at the Symposium on Indigenous Foods.
- Saono S. 1982. Microflora of ragi: its composition and as source of industrial yeast. In Proceedings of a technical seminar. Jakarta: Indonesia: the Indonesian Institute of Science (LIPI); pp. 241–249.
- Steinkraus K. Handbook of indigenous fermented foods. New York: CRC Press; 1995.
- Dijksterhuis J, Samson RA. 2007. Food mycology: a multifaceted approach to fungi and food. (1st ed.). Boca Raton: CRC Press; p. 428.
- Ellis JJ, Rhodes LJ, Hesseltine CW. The genus Amylomyces. Mycologia. 1976;68(1):131–143.
- Kartika AN. 2012. Isolasi amylomyces dari berbagai jenis ragi untuk pembuatan tape rendah alkohol. Yogyakarta: Tekhnologi Pangan dan Hasil Pertanian. Universitas Gadjah Mada.
- Hebert PDN, Cywinska A, Ball SL, et al. Biological identifications through DNA barcodes. Proc R Soc Lond B. 2003;270(1512):313–321.
- White TJ, Tom DB, Lee SB, et al. 1990. Amplification and direct sequencing of fungal ribosomal RNA genes for phylogenetics. In: Gurr SJ, editor. PCR protocols, a guide to methods and applications. London: Academic Press. p. 315–322.
- Zein M, Prawiradalaga D. 2013. DNA barcode fauna Indonesia. Jakarta: Prenadamedia Group.
- Kwiatkowski NP, Babiker WM, Merz WG, et al. Evaluation of nucleic acid sequencing of the D1/D2 region of the large subunit of the 28S rDNA and the internal transcribed spacer region using SmartGene IDNS [corrected] software for identification of filamentous fungi in a clinical laboratory. J Mol Diagn. 2012;14(4):393–401.
- Maddison WP, Maddison DR. 2019. Mesquite: a modular system for' 'evolutionary analysis (3.61). 2019. Available from: http://www.mesquiteproject.org.
- Librado P, Rozas J. DnaSP v5: a software for comprehensive analysis of DNA polymorphism data. Bioinformatics. 2009;25(11):1451–1452.
- Peakall R, Smouse PE. GenAlEx 6.5: genetic analysis in excel. Population genetic software for teaching and research-an update. Bioinformatics. 2012;28(19):2537–2539.
- Raja HA, Miller AN, Pearce CJ, et al. Fungal identification using molecular tools: a primer for the natural products research community. J Nat Prod. 2017;80(3):756–770.
- Vu D, Groenewald M, de Vries M, et al. Large-scale generation and analysis of filamentous fungal DNA barcodes boosts coverage for kingdom fungi and reveals thresholds for fungal species and higher taxon delimitation. Stud Mycol. 2019;92:135–154.
- Nucleotide [Internet]. Bethesda (MD): National Library of Medicine, National Center for Biotechnology Information; [1988]. Accession No. AY238888, Amylomyces rouxii 18S ribosomal RNA gene, partial sequence; internal transcribed spacer 1, 5.8S ribosomal RNA gene and internal transcribed spacer 2, complete sequence; and 28S ribosomal RNA gene, partial sequence; [cited 2020 Nov 11]. Available from: https://www.ncbi.nlm.nih.gov/nuccore/29692017/
- Nucleotide [Internet]. Bethesda (MD): National Library of Medicine, National Center for Biotechnology Information; [1988]. Accession No. AB181331, Amylomyces rouxii genes for 18S rRNA, ITS1, 5.8S rRNA, ITS2, 28S rRNA, partial and complete sequence, strain: ATCC 22962; [cited 2020 Nov 11]. Available from: https://www.ncbi.nlm.nih.gov/nuccore/AB181331.1/
- Ying L. 2012. Identification of mold isolated from Rice Wine Start (Master thesis).
- Nucleotide [Internet]. Bethesda (MD): National Library of Medicine, National Center for Biotechnology Information; [1988]. Accession No. EF583634, Rhizomucor sp. Rm-33 small subunit ribosomal RNA gene, partial sequence; internal transcribed spacer 1, 5.8S ribosomal RNA gene, and internal transcribed spacer 2, complete sequence; and large subunit ribosomal RNA gene, partial sequence; [cited 2020 Nov 11]. Available from: https://www.ncbi.nlm.nih.gov/nuccore/EF583634
- Lv X-C, Huang Z-Q, Zhang W, et al. Identification and characterization of filamentous fungi isolated from fermentation starters for Hong Qu glutinous rice wine brewing. J Gen Appl Microbiol. 2012;58(1):33–42.
- Anupma A. Filamentous moulds associated with some traditionally prepared mixed starter cultures of North East India. Microbiology. 2019;11(905):1–16.
- Abe A, Oda Y, Asano K, et al. The molecular phylogeny of the genus Rhizopus based on rDNA sequences. Biosci Biotechnol Biochem. 2006;70(10):2387–2393.
- O'Donnell K, Lutzoni FM, Ward TJ, et al. Evolutionary relationships among mucoralean fungi (Zygomycota): evidence for family polyphyly on a large scale. Mycologia. 2001;93(2):286.
- TajAldeen SJ, Boekhour T, Theelen B. 2015. Mucor indicus from Qatar. CBS-KNAW Fungal Biodiversity Centre (CBS).
- Vitale RG, de Hoog GS, Schwarz P, et al. Antifungal susceptibility and phylogeny of opportunistic members of the order Mucorales. J Clin Microbiol. 2012;50(1):66–75.
- Rahayu ES, Indrati R, Utami T, et al. 1993. Bahan pangan hasil fermentasi. Yogyakarta: PAU Pangan dan Gizi. Universitas Gadjah Mada.
- Schoch CL, Seifert KA, Huhndorf S, et al. Nuclear ribosomal internal transcribed spacer (ITS) region as a universal DNA barcode marker for fungi. Proc Natl Acad Sci. 2012;109(16):6241–6246.
- Fajarningsih ND. Internal transcribed spacer (ITS) as dna barcoding to identify fungal species: a review. Squalen Bull Marine Fisheries Postharvest Biotech. 2016;11(2):37.
- Pino-Bodas R, Martín MP, Burgaz AR, et al. Species delimitation in Cladonia (Ascomycota): a challenge to the DNA barcoding philosophy. Mol Ecol Resour. 2013;13(6):1058–1068.
- Karimi K, Zamani A. Mucor indicus: biology and industrial application perspectives: a review. Biotechnol Adv. 2013;31(4):466–481.
- Sharifyazd S, Karimi K. Effects of fermentation conditions on valuable products of ethanolic fungus Mucor indicus. Electron J Biotechnol. 2017;30:77–82.
- Dung NTP, Rombouts FM, Nout MJR. Functionality of selected strains of moulds and yeasts from Vietnamese rice wine starters. Food Microbiol. 2006;23(4):331–340.
- Siebenhandl S, Lestario LN, Trimmel D, et al. Studies on tape Ketan–an Indonesian fermented rice food. Int J Food Sci Nutr. 2001;52(4):347–357.
- Kito Hideki Abe A, Sujaya I-N, Oda Y, et al. Molecular characterization of the relationships among Amylomyces rouxii, Rhizopus oryzae, and rhizopus delemar. Biosci Biotechnol Biochem. 2009;73(4):861–864.
- de Souza CF, Lima D, de Oliveira RV, et al. Mucor indicus isolated from the semiarid region of Brazil: a first record for South America. Mycotaxon. 2016;131(4):897–906.
- Abe A, Sone T, Sujaya IN, et al. rDNA ITS sequence of Rhizopus oryzae: its application to classification and identification of lactic acid producers. Biosci Biotechnol Biochem. 2003;67(8):1725–1731.
- Zheng R, Chen G, Huang H, et al. A monograph of Rhizopus. Sydowia. 2007;59(2):273–372.
- Djien KS. Tape fermentation. Appl Microbiol. 1972;23:976–978.