
Abstract
Strawberries are a popular economic crop, and one of the major plantations and exporting countries is Korea in the world. The Fusarium oxysporum species complex (FOSC) is a soil-borne pathogen with genetic diversity, resulting in wilt disease in various crops. In Korea, strawberries wilt disease was first reported in the 1980s due to the infection of FOSC, causing significant economic damage every year. The causal agent, F. oxysporum f. sp. fragariae, is a soil-borne pathogen with a characteristic of FOSC that is difficult to control chemically and mutates easily. This study obtained genetic polymorphism information that was based on AFLP, of F. oxysporum f. sp. fragariae 91 strains, which were isolated from strawberry cultivation sites in Gyeongsangnam-do and Chungcheongnam-do, and compared strains information, which was the isolated location, host variety, response to chemical fungicide, and antagonistic bacteria, and mycelium phenotype. As a result, AFLP phylogeny found that two groups were mainly present, and group B was present at a high frequency in Gyeongsangnam-do. Group B proved less sensitive to tebuconazole than group A through Student’s t-test. In addition, the fractions pattern of AFLP was calculated by comparing the strain information using PCA and PERMANOVA, and the main criteria were separated localization and strawberry varieties (PERMANOVA; p < 0.05). And tebuconazole was different with weak confidence (PERMANOVA; p < 0.10). This study suggests that the F. oxysporum f. sp. fragariae should be continuously monitored and managed, including group B, which is less chemically effective.
1. Introduction
Fusarium oxysporum, a soil-borne fungus, has infection ability in diverse plants, reported being about 150 species including tomato, banana, and strawberry plants in worldwide throughout the world [Citation1]. The broad host range is caused by host specificity and genetic diversity. Because of the genetic diversity, the F. oxysporum is called Fusarium oxsporum species complex (FOSC) and it is further classified at the species level according to host range with the concept of formae speciales (f. sp.) [Citation2]. The FOSC usually inhabits soil outside the host and reproduces three types of spores: microconidia, microconidia, and chlamydospores. The life cycle of FOSC in the soil and the chemical decomposition system of soil microorganisms make it challenging to control pathogenic FOSC. One of the well-known pathogenic FOSC is F. oxysporum f. sp. cubense, which almost wiped out a variety, Gros Michel, of banana worldwide, causing Fusarium wilt disease, also known as Panama disease [Citation3]. The banana Fusarium wilt started in earnest in the 1960s. It is a genetic mutation defined as four tropical species. It is still causing significant damage to the current main banana variety, Cavendish [Citation2,Citation3].
Strawberry (Fragaria × ananassa) is mainly produced by Poland, South Korea, Mexico, Egypt, Turkey, Spain, and the United States [Citation4]. In Korea, it is one of the most popular crops for farming, but the strawberry can be harmed by various diseases such as, gray mold, bacterial angular leaf spot, anthracnose, and Fusarium wilt. Among them, the disease that is difficult to control is Fusarium wilt triggered by F. oxysporum f. sp. fragariae belong to FOSC. The F. oxysporum f. sp. fragariae infection causes the xylem to turn brown and block. It also causes the leaves to turn yellow or deformed and eventually withers the whole plant. In 1962, The first strawberry Fusarium wilt was reported in Australia [Citation5]. After that time, the Fusarium wilt occurred in 1978 and reported in 1982 in Korea [Citation6]. Since the 1990s, The Fusarium wilt was documented worldwide [Citation7].
It is essential to monitor the genetic diversity of the FOSC for effective and valid disease control for each specific genetic group. In the variety of genomic DNA levels, Amplified fragment length polymorphism (AFLP) is one of the eases for DNA fingerprinting and suitable methods for many strains at once [Citation8]. This study was designed to observe the genetic diversity of F. oxysporum f. sp. fragariae in Korea. The AFLP was conducted by 91 strains. Also, to evaluate relationships with genetic diversity and property of each strain, sampling location of strains [Citation9], the sensitivity to Streptomyces globisporus S4-7, an antagonist, and mycelial phenotype evaluated by Chae et al. [Citation10], and the chemical fungicide reactivity results evaluated by Kwon et al. [Citation12] were utilized.
2. Materials and methods
2.1. Isolation, cultivation and genomic DNA extraction of the pathogen
Fusarium oxysporum f. sp. fragariae strains were collected and isolated nationwide from the infected strawberry plant [Citation12]. Among the isolated pathogen population, 91 strains were used in this study after verified the pathogen as Fusarium oxysporum f. sp. fragariae by species-specific PCR [Citation11]. F. oxysporum f. sp. fragariae strains were cultivated at 27 °C on 1/5 potato dextrose agar (0.8 g of potato starch, 4.0 g of dextrose, and 20 g of agar in L) for a week. After the cultivation, their mycelium was raked and put into 1.5 mL tube. Genomic DNA was extracted by CTAB buffer (20 g of cetyltrimethyl ammonium bromide, 100 mL of 1 M Tris-HCl pH 8.0, 280 mL of 5 M NaCl, and 40 mL of 0.5 M ethylene diamine tetraacetic acid per L), and proteinase K on 65 °C. The genomic DNA was purified Phenol/chloroform/isoamyl alcohol (PCI, 25:24:1) method.
2.2. Amplified fragment length polymorphism (AFLP)
EcoRI (10 unit) and MspI (10 unit) reacted with 250 ng of the genomic DNA in 20 μL of volume at 37 °C for 5 h [Citation13]. The digestion was ligated with 40 unit of T4DNA ligase, 0.1 μM of EcoRI adapter (5′-CTCGTAGACTGCGTACC-3′, 5′-AATTGGTACGCAGTC-3′), 0.1 μM of MspI adapter (5′-GACGATGAGTCCTGAT-3′, 5′-CGATCAGGACTCATC-3′) and 0.2 mM of ATP in 50 μL of volume at 10 °C for 16 h. After the ligated product was diluted to 1/20, nonselective amplification was performed by Eco00 (5′-GACTGCGTACCAATTC-3′) and Msp00 (5′-GATGAGTCCTGATCGG-3′) primers. Thermal conditions consisted of pre-denaturation at 94 °C for 2 min, 35 amplification cycles (94 °C for 30 sec, 56 °C for 30 sec, and 72 °C for 30 sec), final extension at 72 °C for 90 sec. The amplicon diluted to 1/10 and 1 μL of the dilution was used selective amplification that was progressed by three primers, 5 ng of fluorescein amidite (FAM) labeled Eco20 (5’FAM-GACTGCGTACCAATTCGC-3′), 15 ng of Msp15 (5′-GATGAGTCCTGATCGGCA-3′) and 15 ng of Msp16 (5′-GATGAGTCCTGATCGGCC-3′). The selective amplification thermal was performed that pre-denaturation at 94 °C for 2 min, 13 cycles of primer sensitive amplification (94 °C for 30 sec, 65 °C decreased by 0.7 °C during each cycle for 30 sec, and 72 °C for 60 sec), 25 normal cycles (94 °C for 30 sec, 56 °C for 30 sec, and 72 °C for 60 sec), and final elongation at 72 °C for 10 min. The FAM-labeled amplicon was analyzed by DNA Analyzer ABI3730XL (Perkin Elmer, USA) in National Instrumentation Center for Environmental Management.
2.3. Statistical analysis
The FAM-labeled fragmental DNA reads generated from the DNA analyzer received in fragments analysis (FSA) files. Fragment information in the FSA files was handled by Fragman (version 1.0.9) [Citation14] package and was analyzed by stats (version 4.1.0) (R core team 2020), ape (analysis of phylogenetic and evolution, version 5.5) [Citation15], nortest (version 1.0-4) [Citation16], vegan (version 2.5-7) [Citation17], and pairwiseAdonis (version 0.0.1) [Citation18] packages in R (version 4.1.0) [Citation19]. AFLP was evaluated by previously reported sensitivity to Streptomyces globisporus S4-7, antagonist [Citation10], fungicide sensitivities, tebuconazole prochloraz-Mn, and copper hydroxide [Citation12]. The reported raw measurements calculated half maximal inhibition concentration (IC50) of the fungicides and three parameters log-logistic model in drc (analysis of dose-response curve, version 3.0-1) [Citation20] package in the R. The log-logistic model and IC50 results were attached to Supplementary data (Tables S3, S4, and S5). Visualization of the results was done with ggplot2 (version 3.3.5) [Citation21] and ggpubr (version 0.4.0) packages in the R. The used code and raw data were provided on GitHub repository (https://github.com/gyeongjunCho/F-oxysporum-AFLP.git).
3. Results
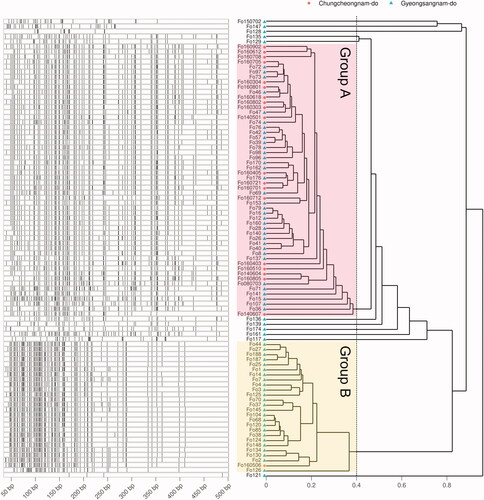
To observe the genetic diversity of F. oxysporum f. sp. fragariae isolated from strawberry cultivation in Korea, 91 strains that were phenotypically reported under the same conditions in the previous study, were used (; Table S1) [Citation10,Citation12]. In AFLP fragments information, a total of 256 types of fragments with different lengths were detected, with up to 4 to 98 fragments detected in each strain (). The fragments pattern was displayed to phylogeny tree using Bray-Curtis distance and weighted pair group method with averaging (WPGMA) hierarchical clustering. Based on the phylogenetic distance of 0.4, it was mainly organized into two large groups, and the frequency of the strains isolated from Chungcheongnam-do frequency seemed to be low in group B.
Figure 1. Site information where strains are Isolated. Small district unit (-si, -gun, and -myeon) names of the site are described by points and large unit (-do) names are described by colors of the points.
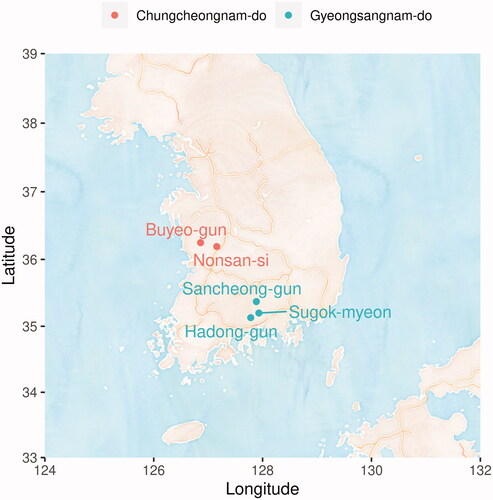
Figure 2. DNA fragments of AFLP and the fragment phylogeny. Left of the plots shows the specifically amplified genomic DNA length information after the DNA fragmentation. Phylogeny on the right is calculated by Bray-Curtis distance of the length and WPGMA clustering. Group displayed by pink and yellow translucent rectangles are determined based on 0.4.
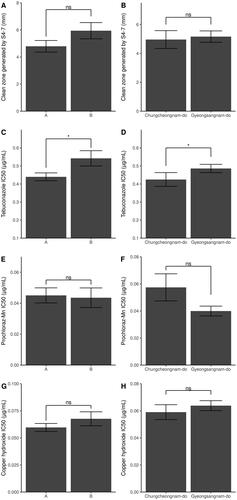
The numerical characteristics of the strains were compared between the two groups (). The length of the clean zone generated by the antagonist, S. globisporus S4-7 utilized Chae et al. [Citation10]. The IC50 values of tebuconazole, prochloraz-Mn, and copper hydroxide were newly calculated (Tables S2, S3, S4, S5, and Figures S1, S2, S3) using three parameters log-logistic model based on the reported data of Kwon et al. [Citation12]. As a result, in tebuconazole, it was significantly observed that group A had a lower IC50 than group B () and strains in Chungchungnam-do a lower than other strains isolated from Gyeongsangnam-do (; two-sided Student’s T-test, p < 0.05). S4-7 clean zone length (), and IC50 of prochloraz-Mn () and copper hydroxide () were not different between the groups and isolated location.
Figure 3. Comparison of clean zones generated by S4-7 and IC50 between two phylogenetic groups and location. AFLP phylogenic group display in left panel and location group in right panel. The Student's T-test analyzes the difference of clean zone length grouped by location (B) and tebuconalzole IC50 (C, D). Clean zone length grouped by the phylogeny (A), Prochloraz-Mn IC50 (E, F), and copper hydroxide IC50 (G, H) difference are calculated by the Mann–Whitney U test, as the Lilliefors test for normality is judged not to be normally distributed. (Significance level: ***p < 0.001; **p < 0.01; * p < 0.05; ns p > 0.05).
The definite characteristics of the strains were analyzed by principal component analysis () using the length of DNA fragments. For the category of mycelial phenotype and of sensitivity about the S. globisporus S4-7 in each strain (+: Clean zone ≥10 mm, ++: 7 mm ≤ Clean zone < 10 mm, +++: 4 mm ≤ Clean zone < 7 mm, ++++: 0 mm < Clean zone <4 mm), results of Chae et al. [Citation10] were used. The fungicides IC50 were categorized based on their quartiles (Tables S3, S4, S5, and Figure S4). The PCA results were visualized to different color and shape points, depending on the characteristics of the strain, AFLP phylogeny group (), isolated location (), different sensitivity of the host (), S4-7(), tebuconazole IC50 groups (), prochloraz-Mn IC50 groups (), copper hydroxide (), and mycelial phenotype (), and their 95% of distribution were displayed to ellipse. As a result of the PERMANOVA and paired-wised PERMANOVA () calculated by the distribution of the points, the distribution was different (PERANOVA, p < 0.10; paired-wised PERANOVA, Padj < 0.10) not only in the large-scale locational unit (do) but also in the small locational unit (si, gun, and myeon). In addition, there was a difference in distribution according to the host variety and S4-7 sensitivity (p < 0.05), but only host variety was confirmed at paired-wised PERANOVA (Padj < 0.05). And differences among the tebuconazole IC50 groups were confirmed at low reliability (PERANOVA, p < 0.10; paired-wised PERANOVA, Padj < 0.10).
Figure 4. The genomic DNA fragment PCA results. Points meaning each the Fusarium oxysporum f. sp. fragariae strain are flat. To portray the characteristics of each strain, it is represented by several panels and the colors of the dots are indicated differently. (A) AFLP phylogeny group. (B) small unit location group. (C) large unit location group. (D) host variety groups. (E) Antagonist S4-7 sensitivity group. (F) Tebuconazole IC50 group. (G) Prochloraz-Mn IC50 group. (H) Copper hydroxide IC50 group. (I) Mycelial phenotype. The ellipses depict the extent to which 95% of the points are distributed.
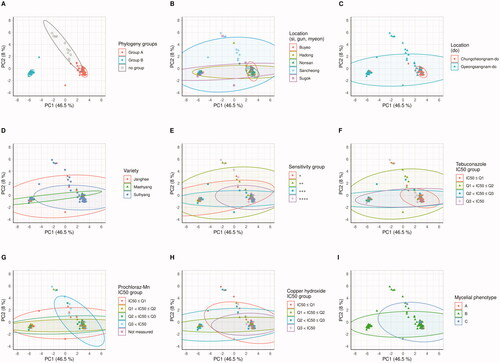
Table 1. PERANOVA and paired-wised PERANOVA with FDR method.
4. Discussion
To obtain information based on disease control, this study was designed to investigate genetic variants using 91 strains of F. oxysporum f. sp. fragariae isolated from strawberry cultivation in Korea () and examine the relationship between AFLP and strain characteristics. EcoRI and MspI restricted the 256 fragments of different lengths, were linked by EcoRI and MspI adapter, and were specifically amplified by Eco20, Msp15, and Msp16. Most fragment patterns were divided into two large groups at phylogeny distance 0.4 (). As a result of comparing the clean zone size formed by S4-7 and the IC50 of tebuconazole, prochloraz-Mn, and copper hydroxide between the two groups, there was a difference only in tebuconazole (). This result suggests that wilt by B group is difficult to control with tebuconazole. The results show the need for further experiments on fungicides used in strawberry plantations not included in this experiment and for continuous monitoring of F. oxysporum f. sp. fragariae diversity [Citation2,Citation6].
To analyze relationships between the AFLP and property of the in more detail, dimensional compression of the pattern was analyzed by PCA. Then PERANOVA observed whether the distribution of the pattern of the fragment varies by characteristic (, ). AFLP phylogeny groups are significantly divided in PCA (; PERMANOVA, p < 0.05). This result indicates that the phylogenetic group found by AFLP was well reflected in PCA. Locational distinguish are also observed in PCA (PERMANOVA, p < 0.05; paired-wised PERANOVA, Padj < 0.05). In comparison of narrow unit locations such as Sugok-myeon vs Nonsan-si, Sugok-myeon vs Buyeo-gun, Hadong-gun vs Nonsan-si, and Hadong-gun vs Buyeo-gun, it has been confirmed that there were significant differences (Padj < 0.05) or weakly reliable differences (Padj < 0.10). These statistical results indicate that the F. oxysporum f. sp. fragariae is genetically distinct according to location, and it portrays that the group B is higher frequency in Gyeongsangnam-do than in Chungcheongnam-do in PCA () and phylogeny ().
And to understand the relationship between genetic distribution, we compared the chemical components used in the chemical control of Fusarium antimicrobial S4-7 and Fusarium wilt with the PCA distribution. It was confirmed that only the PCA distribution of tebuconazole IC50, which was different in the polymorphismic phylogeny group () and isolated location (), was different at a weak confidence level (PERMANOVA, p < 0.10; paired-wised PERANOVA, Padj < 0.10). These results suggest that tebuconazole accounts for a large proportion of the genetic variations because that has already occurred and that reducing the use of tebuconazole is useful to decrease the frequency of group B in F. oxysporum f. sp. fragariae [Citation7,Citation9]. Analysis using PCA and PERMANOVA among strawberry varieties confirmed a difference between cv. Sulhyang and cv. Maehyang (, ). Because group B is less affected by tebuconazole, is less distributed in Sulhyang than cv. Maehyang, cv. Sulhyang are more useful than cv. Maehyang in reducing the frequency of the group B [Citation10].
This study discovered that the genetic differentiation of the F. oxysporum f. sp. fragariae was influenced by cultivation location and the strawberry varieties, fungicides usage, and the different environmental conditions. Strawberries should always be prepared, just as Fusarium wilts in bananas have become a global pandemic and caused significant economic damage [Citation3]. Therefor it is also suggested that further research and various attempts and genetic diverse monitoring for sustainable agriculture are needed as the observed of the F. oxysporum f. sp. fragariae [Citation12,Citation13] to the group B, which was less inhibited about tebuconazole, and which were observed at high frequency in Gyeongsangnam-do.
Supplemental Material
Download MS Word (1 MB)Disclosure statement
No potential conflict of interest was reported by authors.
Additional information
Funding
References
- Rana A, Sahgal M, Johri B. 2017. Fusarium oxysporum: genomics, diversity and plant–host inter- action. In: Satyanarayana T, Deshmukh SK, Johri BN, editors. Developments in fungal biology and applied mycology. Singapore: Springer; p. 159–199.
- Edel-Hermann V, Lecomte C. Current status of Fusarium oxysporum formae speciales and races. Phytopathology. 2019;109(4):512–530.
- Ploetz RC. Fusarium wilt of banana. Phytopathology. 2015;105(12):1512–1521.
- Rubinstein J. 2015. Fragaria x ananassa: past, present and future production of the modern strawberry. University of Minnesota, University of Minnesota’s Digital Conservancy, Minneapolis.
- Johnson H, Holland AH, Paulus AO, et al. Soil fumigation found essential for maximum strawberry yields in Southern California. Calif Agric. 1962;16(10):4–6.
- Cho CT, Moon BJ. Studies on the wilt of strawberry caused by Fusarium oxysporum f. sp. fragariae in korea. Korean J Appl Entomol. 1984;23(2):74–81.
- Koike ST, Gordon TR. Management of Fusarium wilt of strawberry. Crop Prot. 2015;73:67–72.
- Vos P, Hogers R, Bleeker M, et al. AFLP: a new technique for DNA fingerprinting. Nucleic Acids Res. 1995;23(21):4407–4414.
- Kim JS, Kang NJ, Kwak YS, et al. Investigation of genetic diversity of Fusarium oxysporum f. sp. fragariae using PCR-RFLP. Plant Pathol J. 2017;33(2):140–147.
- Chae DH, Kim DR, Kwak YS. Sensitivity variation of Fusarium oxysporum f. sp. fragariae, strawberry wilt pathogen against biocontrol agent. J Agirc Life Sci. 2021;55(3):33–42.
- Suga H, Hirayama Y, Morishima M, et al. Development of PCR primers to identify Fusarium oxysporum f. sp. fragariae. Plant Dis. 2013;97(5):619–625.
- Kwon SK, Jeon CW, Nam MH, et al. Evaluation of fungicides sensitivities of strawberry wilt disease pathogen, Fusarium oxysporum f. sp. fragariae. Korean J Pestic Sci. 2020;24(1):34–42.
- Baayen RP, O'Donnell K, Bonants PJ, et al. Gene genealogies and AFLP analyses in the Fusarium oxysporum complex identify monophyletic and nonmonophyletic formae speciales causing wilt and rot disease. Phytopathology. 2000;90(8):891–900.
- Covarrubias-Pazaran G, Diaz-Garcia L, Schlautman B, et al. Fragman: an R package for fragment analysis. BMC Genet. 2015;17(62):1–8.
- Paradis E, Schliep K. Ape 5.0: an environment for modern phylogenetics and evolutionary analyses in R. Bioinformatics. 2019;35(3):526–528.
- Gross J, Ligges U, Ligges MU. 2015. nortest: Tests for normality. R package version 1.0-4. https://CRAN.R-project.org/package=nortest
- Oksanen J, Blanchet FG, Friendly M, et al. 2020. vegan: Community ecology package. R package version 2.5-7. https://CRAN.R-project.org/package=vegan.
- Arbizu PM. 2017. pairwiseAdonis: Pairwise multilevel comparison using Adonis. R package version 0.0.1.
- R Core Team. 2020. R: a language and environment for statistical computing. Vienna: R Foundation for Statistical Computing. https://www.R-project.org/.
- Ritz C, Baty F, Streibig JC, et al. Dose-response analysis using R. PloS One. 2015;10(12):e0146021.
- Wickham H. ggplot2. WIREs Comp Stat. 2011;3(2):180–185.