
Abstract
Identification of protein complexes is of great importance in the understanding of cellular organization and functions. Traditional computational protein complex prediction methods mainly rely on the topology of protein–protein interaction (PPI) networks but seldom take biological information of proteins (such as Gene Ontology (GO)) into consideration. Meanwhile, the environment relevant analysis of protein complex evolution has been poorly studied, partly due to the lack of high-precision protein complex datasets. In this paper, a combined PPI network is introduced to predict protein complexes which integrate both GO and expression value of relevant protein-coding genes. A novel protein complex prediction method GECluster (Gene Expression Cluster) was proposed based on a seed node expansion strategy, in which a combined PPI network was utilized. GECluster was applied to a training combined PPI network and it predicted more credible complexes than peer methods. The results indicate that using a combined PPI network can efficiently improve protein complex prediction accuracy. In order to study protein complex evolution within cells due to changes in the living environment surrounding cells, GECluster was applied to seven combined PPI networks constructed using the data of a test set including yeast response to stress throughout a wine fermentation process. Our results showed that with the rise of alcohol concentration, protein complexes within yeast cells gradually evolve from one state to another. Besides this, the number of core and attachment proteins within a protein complex both changed significantly.
Introduction
Protein complexes are groups of proteins that interact with each other; consequently, they usually form dense clusters in protein–protein interaction (PPI) networks. Protein complexes are important molecular entities in cells. Predicting protein complexes can help in the understanding of cellular components and function as well as in research on the evolution between protein complexes. Researching protein complex evolution due to changes in the living environment surrounding cells is of great importance in unveiling the secrets of cell organization and function.[Citation1] Recently, a large amount of protein interactions has been produced, which makes it possible to predict protein complexes from PPI networks.
The prediction of protein complexes from PPI networks has long been studied and the methods mainly fall within the following three categories: (1) methods based on seed node expansion,[Citation2,3] which predict protein complex in two stages: first, they identify seed nodes and second, they expand the source nodes. A different strategy used in seed node selection and expansion affects those methods significantly. (2) Methods based on hierarchical clustering,[Citation4,5] which represent the entire network in a tree-like structure and find protein complexes by cutting the whole tree at different levels. (3) Heuristic methods,[Citation6] which usually have much higher accuracy due to introducing additional information about proteins besides the topology of PPI networks. However, all these methods mainly rely on the topology of PPI networks. Seldom are the roles that proteins play in the cells considered. Recently, some researchers have begun to acknowledge that by introducing biological information of proteins into protein complex prediction, the accuracy of several methods can be improved. As a result, methods like those described in [Citation7,8] can achieve much higher accuracy. However, all the methods above ignore a basic concept that PPI networks do not remain constant but experience dynamic changes according to the changes in the cellular living environment.
At a specific time point, only certain proteins that are needed are translated. Therefore, the protein complex prediction should be based on essentially translated proteins and nonessential ones should better be excluded. Besides, more biological information such as Gene Ontology (GO) and gene expression values of corresponding proteins can be taken into consideration when selecting seed node proteins.
In this paper, a combined PPI network is introduced to predict protein complexes, which integrates both GO and the expression value of relevant protein-coding genes. The combined PPI network which is constructed by the dynamic PPI network is a weighted PPI network and the weight corresponds to the number of shared GO terms between proteins. The dynamic PPI network is constructed by the PPI network while removing untranslated proteins. We propose a novel protein complex prediction method, GECluster, based on a seed node expansion strategy, in which a combined PPI network is utilized. GECluster was applied to a combined PPI network and it predicted more credible complexes than peer methods. In order to study the protein complex evolution within cells due to changes in the living environment surrounding cells, we applied GECluster to seven combined PPI networks constructed using gene expression data of yeast response to stress throughout a wine fermentation process. According to our study, with the rise of alcohol concentration, protein complexes within yeast cells gradually evolve from one state to another and the number of core and attachment proteins within protein complexes both changed significantly.
Materials and methods
Static PPI network and dynamic PPI network
Static PPI networks, also called PPI networks, have been widely used in protein complex prediction researches.[Citation9,10] A static PPI network contains all the PPIs in an organism, regardless of when and where the interactions occur. In other words, a static PPI network is the union set of PPIs. Dynamic PPI networks are a subset of the static PPI networks and are constructed by removing redundant PPIs from a static PPI network, leaving only interactions needed. This is reasonable because at a certain time point only certain proteins that are needed are expressed in a cell. In this paper, we constructed a dynamic PPI network by refining static PPI networks using time series gene expression data. The steps are shown in . (For an example, see Section 1.1 in the Online Supplementary Appendix.)
Figure 1. Flowchart diagram on how to construct dynamic PPI networks.
Note: val(A) represents the expression value of gene ‘A’; Mean(A) represents the mean expression value of gene ‘A’, which is calculated by computing the average expression value of gene ‘A’ at different time points.
GO and GO slims
The GO [Citation11] project is an extensive bioinformatics initiative aiming to standardize the representation of gene and gene product attributes across species and databases. As demonstrated in [Citation8,Citation12], a general feature of the proteins in a protein complex is that they commonly share one or more GO term annotations. GO slims are a trimmed version of GO and give a much broader overview of ontology content than GO, which makes them particularly useful for giving a summary of the results of GO annotation of a genome when broad classification of proteins is needed.[Citation1] The annotation of GO slims mainly includes three aspects: biological processes (BP), molecular functions (MF) and cellular components (CC), each of which contains a fixed number of GO terms. In this paper, we use GO slims to annotate each protein in the dynamic PPI network and, as a result, for each GO term we obtain a protein set denoted as GO-Protein-Set. Proteins within the same GO-Protein-Set share similar GO annotations.
Combined PPI network construction
A combined PPI network is a weighted dynamic PPI network and the weight on the edge represents the common GO terms shared by the two endpoint proteins. We construct the combined PPI network as shown in . (For an example, see Section 1.2 in the Online Supplementary Appendix.)
Figure 2. Flowchart diagram on how to construct combined PPI networks.
Function similarity
Function similarity measure between two arbitrary proteins, also called FS_Weight,[Citation13] has been widely used in protein complex prediction. In this paper, we also use FS_Weight to measure the function similarity between two proteins. The FS_Weight between proteins i and j is defined as follows:(1) where Ni denotes the degree of protein i; |Ni∩Nj| denotes the common neighbours between proteins i and j, including i and j; |Ni − Nj| denotes the number of proteins who are neighbours of protein i but not of j; and λij is defined as follows:
(2) where Navg denotes the average degree of all the proteins in the dynamic PPI network; and λji can be defined correspondingly.
In this paper, if FS_Weight ≥ FS_Weightmin, where FS_Weightmin is a threshold value, we consider the proteins to have strong similarity. If two proteins have strong similarity, this does not necessarily mean that they would fall into one and the same cluster. In order to determine whether they should be clustered together, a Cluster_ Coefficient index was used. Cluster_ Coefficient is defined as(3) where m is the total edges in the cluster; and n (n ≥ 2) is the total nodes in the cluster.
When adding a protein into a cluster, two criteria should be satisfied. One is that it should have strong functional similarity with all the proteins already in the cluster; the other one is that the Cluster_Coefficient should not decrease as a result of the inclusion of that protein.
GECluster algorithm
The GECluster algorithm uses combined PPI networks and works as shown in .
Figure 3. Flowchart diagram of the GECluster algorithm.
Notes: M(i,j) is the weighted matrix of combined PPI network whose elements represent the edge weight value in combined PPI network. D(i) is an array, with element values ordered from large to small and the value represents the degree of network node. Cluster_Coefficient1 represents the Cluster_Coefficient value of the new cluster before the selected node is included. Cluster_Coefficient2 represents the Cluster_Coefficient value of the new cluster after the selected node is added into the cluster.
Datasets
Two time course gene expression datasets were used in this paper: one is a training set and the other one is a test set. The time series gene expression data in the training set were downloaded from Gene Expression Omnibus (GEO).[Citation14] The accession number is GSE4259, which is a study of fermentation at different concentrations of sucrose. The time course gene expression data of Saccharomyces cerevisiae responding to stress throughout a 15-day wine fermentation (downloaded from GEO,[Citation15] accession number is GSE8536) was used as test set. The main study of GSE8536 is based on expression measurements at 0.5%, 2%, 3.5%, 7% and 10% ethanol (corresponding to roughly 24, 48, 60, 120 and 340 h). Experiments were done in triplicate (biological replicates). This accession also includes the files at 1 and at 12 h for completeness (also in triplicate). The DIP (Database of Interaction Proteins) database is composed of three linked tables: a table of protein information, a table of PPIs and a table describing details of experiments detection the PPIs. The experimental article table can be used to evaluate the quality of an interaction base on the particular experiments performed.
The static PPI dataset was downloaded from DIP [Citation16] (updated on 07/07/2013). The data have been curated both manually by expert curators and also automatically, using computational approaches that utilize the knowledge about the PPI networks extracted from the most reliable, core subset of the DIP data. After deleting self-loops and duplicated edges, the static PPI network contains 4976 nodes and 21,937 edges. In order to validate our method, a benchmark protein complex dataset was used. The reference set comprises 350 hand-curated consensus complexes. We kept only those complexes with a size no less than 3, and as a result only 182 complexes were left. Since we consider dynamic PPI networks in this study, some proteins in the benchmark datasets may not translate. Therefore when evaluating the performance of our methods, we curated the benchmark dataset according to expressed genes. As a result, only 76 complexes were left.
Evaluation methods
We calculated Recall (sensitivity) and Precision at complex level by matching generated clusters with reference complex sets. Let A be a generated complex, B be a reference complex, VA be the set of proteins contained in A and VB be the set of proteins contained in B. The matching score between A and B is defined as follows:(4)
Given a threshold value M_thres, if M_Score(A, B) ≥ M_thres, then proteins A and B match each other. In most of our experiments, we set M_thres = 0.2, in line with many other methods.[Citation1,Citation17] Given a set of reference complexes C = (C1, C2, C3,…, Cm) and a set of predicted complexes P = (P1, P2, P3,…, Pn), Recall and Precision at complex level are defined as follows:(5)
(6) where Nc and Np represent the number of complexes in the reference and the predicted protein complex data sets, respectively; Nmc is the number of protein complexes in the reference complex set matched by the complexes in the predicted datasets; and Nmp is the number of protein complexes in the predicted complex set matched by the complexes in the reference dataset. To obtain an overall measurement of our method, we introduced F1, which is defined as follows:
(7)
In order to further verify our results, we used the Database for Annotation, Visualization and Integrated Discovery (DAVID) [Citation18] to annotate each protein in the predicted complex sets.
Results and discussion
Combined PPI network constructed based on training set
According to the methods described above, we first constructed dynamic PPI networks by removing any untranslated proteins from the static PPI network by using gene expression datasets. We found that of the 4976 proteins in the static PPI networks, only 2078 were demonstrated to be expressed (41.8%) with 6823 edges between them. It is well known that PPI networks, as well as many other networks within biological bodies, are all complex networks which have the characteristics of being ‘scale-free’ and ‘small world’. We compared the degree and path length distribution of the dynamic PPI network we inferred with the static PPI network. The result is shown in .
Figure 4. Degree and path length distribution of dynamic PPI network inferred and static PPI network.
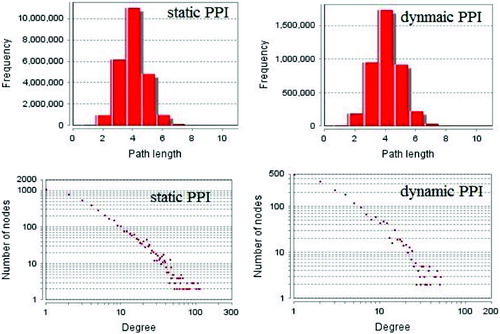
As shown in , the dynamic PPI network we inferred also exhibits the characteristics of complex networks just as static PPI networks. We used GO slim to annotate each protein-coding gene in the dynamic PPI network. The combined PPI network was constructed by integrating the information of the dynamic PPI network and the GO annotation results. The detailed information is shown in .
Table 1. Network information.
Complex prediction and comparison with other methods
In the next step, the GECluster algorithm was applied to the combined PPI network inferred above. We compared our algorithm with MCODE [Citation3] and CFinder,[Citation19] which were applied to the dynamic PPI network we constructed (see above). The MCODE algorithm is the earliest and most classical protein complex prediction method based on the seed node expansion strategy. CFinder has been proved to outperform other methods in finding potential protein complexes within PPI networks.[Citation20]
The results in show that by introducing the combined PPI network, our method can achieve much higher accuracy than the other peer methods. The reason obviously lies in the fact that we refined the static PPI networks by using gene expression datasets and as a result only expressed genes were selected for later use. Moreover, we used GO Slims to annotate each protein. By running this function, similar proteins are approximately grouped before our algorithm starts. Compared with our method, the other two methods all act on static PPI networks which contain genes that are actually not expressed, and thus they achieved very low prediction accuracy.
Figure 5. Prediction accuracy comparison between GECluster, MCODE and CFinder.
As a further verification of our results, we annotated each protein in the predicted complex sets by using the DAVID database.[Citation19] lists the annotation result, and again the best result of MCODE was selected and the parameter FS_Weightmin = 0.5 was set for GECluster. As seen from , our method can yield more functionally similar protein complexes with low P-values.
Table 2. Complex function annotates results.
Parameters discussion
Protein complex evolution has been poorly researched partly because of the lack of high-quality protein complex datasets. The GECluster algorithm, by making use of combined PPI networks, can achieve much higher prediction accuracy, which can be used for protein complex prediction. In order to determine the best parameter of GECluster, in this part of our study, we varied FS_Weightmin with steps of 0.01 starting from 0.01 to 1. The corresponding changes in Precision, Recall and F1 are shown in .
Figure 6. Influence of FS_Weightmin on Precision, Recall and F1.
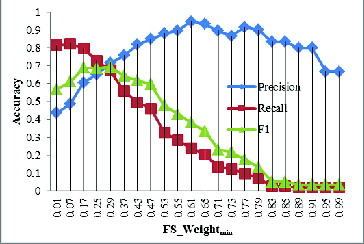
The results revealed that when FS_Weightmin = 0.25, the F1 value is much higher (). That is why, in the subsequent evolution analysis of protein complexes, we set FS_Weightmin = 0.25.
In this paper, we introduced dynamic PPI networks and based on dynamic PPI networks we proposed to construct a combined PPI network which is a weighted PPI network. As we can see from the previously section, by introducing combined PPI networks, our GECluster algorithm achieved much higher accuracy in finding protein complexes within PPI networks. As a next step, we analysed the influence of FS_Weightmin on the prediction accuracy when the combined PPI network was constructed from static PPI networks rather than from dynamic PPI networks. The results are shown in .
Figure 7. Influence of FS_Weightmin on Precision, Recall and F1.
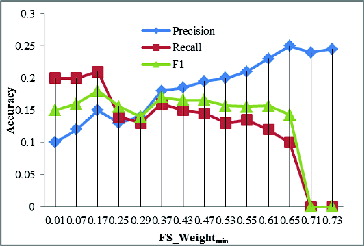
Compared to the accuracy values shown in , the values in are much smaller. This demonstrates that, by introducing a dynamic PPI network in combined PPI network construction, the prediction accuracy can be improved.
Protein complex evolution relationship research
By using the training set, we successfully identified the best parameter value for GECluster when applied to combined PPI networks for protein complex prediction. Then, we further analysed how protein complexes within yeast cells evolve according to the changes in the alcohol concentration in the medium during the cultivation process. As a result, seven dynamic PPI networks and their corresponding combined PPI networks were constructed by analysing data values in test datasets. The details of these networks are shown in . GECluster was applied to the seven combined PPI networks shown in , and the number of complexes predicted is also given in . The relationships among protein complexes between different PPI networks are presented in .
Table 3. Information about the dynamic PPI networks and combined PPI networks inferred from test datasets and the complex numbers predicted.
Figure 8. Relationships among protein complexes between different PPI networks.
The results in indicate that with the increase of alcohol concentration, the protein complexes within yeast cells change gradually. For example, the complexes in CPPI1 have the strongest relationship with the complexes in CPPI3 and CPPI4 but seldom have relations with complexes in other networks. The complexes in CPPI7 have most interactions with the complexes in CPPI6 but rarely interact with complexes in CPPI1, CPPI2 and so on. This illustrates how complexes evolve gradually from one state to another in order to best adapt to the changes in the living environment. The number of complexes decreased from CPPI1 to CPPI7, which was in agreement with the real-life experimental data.
At the beginning of fermentation, yeast cells multiply rapidly and, as a result, many protein complexes are synthesized. On the contrary, with the increase in alcohol concentration, yeast cells have to reduce their energy consumption and limit other non-essential activities, resulting in only a few complexes being synthesized. According to Gavin et al.,[Citation21] the proteins within complexes can be classified into core and attachment proteins. Core proteins are those that are always present in all isoforms and execute the main functions, whereas attachment proteins are present only in some of the isoforms and act as modifiers of the complex's function.[Citation22] Many researchers believe that core proteins evolve slower than attachment proteins, as core proteins are main functional elements,[Citation23,24] which is in accordance with the proposal that functionally important genes should evolve slower than less important genes. However, a recent study by Chakraborty and Ghosh [Citation22] revealed that core proteins evolve faster than attachment proteins in spite of their higher multi-functionality. The authors observed that attachment proteins play a role in a higher number of protein complexes than core proteins and, consequently, have an increased expression level, which is the main determining factor for the protein evolution rate.
In this paper, by introducing dynamic and combined PPI networks as well as the GECluster algorithm, we were able to identify the protein complexes within PPI networks precisely. Since previously performed protein complex evolution research is based on the protein complexes predicted by using low accuracy methods, it may not be completely correct. In this part of our study, the core and attachment protein dataset of [Citation22] was used to analyse their evolutionary relationship. We count the core and attachment protein number in each network complex dataset. The protein complex number is defined as the number of protein complexes in which a protein subunit belongs. We also made a statistical assessment of the protein complex numbers of both the core and the attachment proteins. Importantly, previous studies are almost all based on static PPI networks but seldom consider complex dynamic changes. According to our study, the number of core proteins decreased significantly as compared to that of attachment proteins, which in accordance with previous opinions that core proteins determine the function of protein complexes.
As a whole, the identification of protein complexes is of great importance in understanding the cellular organization and functions. Proteins that fall into the same group tend to function similarly, which allows the function of newly discovered proteins to be predicted by identifying protein complexes in which they belong. Since proteins rarely function alone, but rather combine together with other proteins to form protein complexes that execute specific functions. Thus, the loss of particular proteins from a protein complex may be associated with a disease. In this context, our GECluster algorithm may prove useful by aiding disease diagnosis.
Conclusions
In this paper, a novel protein complex prediction algorithm named GECluster was proposed to detect protein complexes from PPI networks. GECluster was applied on a combined PPI network which is a weighted PPI network constructed from dynamic PPI networks. Dynamic PPI networks were refined from static PPI networks by using gene expression datasets. GECluster was first applied to a training set to determine the optimal parameter value. With this parameter value, GECluster was applied to seven combined PPI networks constructed using data of yeast response to stress throughout a wine fermentation process and gave more accurate protein complex prediction as compared to two classical methods (MCODE and CFinder). The results indicate that using combined PPI network can efficiently improve the protein complex prediction accuracy, which is due to the fact that, unlike classical methods, we introduced dynamic PPI networks and combined PPI networks to take into consideration the biological role of proteins. Dynamic PPI networks are constructed in such a way as to include only those proteins that are translated at a specific time point. The combined PPI network is constructed based on the dynamic PPI network and GO annotations of proteins. By using GO Slims to annotate each protein in the dynamic PPI networks, proteins with similar functions almost always fall into the same GO term defined group, leading to much higher accuracy. The potential of the GECluster algorithm to be employed in protein function prediction may, furthermore, prove useful in aiding the diagnosis of some protein-related diseases.
Supplemental data
Supplemental data for this article can be accessed at http://dx.doi.org/10.1080/13102818.2014.946700.
Online Supplementary Appendix
Download PDF (279.9 KB)Additional information
Funding
References
- Zhang Y, Lin H, Yang Z, Wang J. Construction of ontology augmented networks for protein complex prediction. PloS One. 2013;8:e62077, 1–9.
- Liu G, Wong L, Chua HN. Complex discovery from weighted PPI networks. Bioinformatics. 2009;25:1891–1897.
- Bader GD, Hogue CW. An automated method for finding molecular complexes in large protein interaction networks. BMC Bioinform. 2003;4:2–29.
- Liu CN, Li J, Zhao Y. Exploring hierarchical and overlapping modular structure in the yeast protein interaction network. BMC Genomics. 2010;11:17–29.
- Clauset A, Moore C, Newman ME. Hierarchical structure and the prediction of missing links in networks. Nature. 2008;453:98–101.
- Srihari S, Leong HW. A survey of computational methods for protein complex prediction from protein interaction networks. J Bioinform Comput Biol. 2013;11:1230002–1230029.
- Zhang Y, Lin H, Yang Z, Wang J, Li Y, Xu B. Protein complex prediction in large ontology attributed protein-protein interaction networks. IEEE/ACM Trans Comput Biol Bioinform/IEEE. 2013;10:729–741.
- Wang J, Xie D, Lin H, Yang Z, Zhang Y. Filtering gene ontology semantic similarity for identifying protein complexes in large protein interaction networks. Proteome Sci. 2012;10(Suppl 1):S18, 1–10.
- Jin Y, Turaev D, Weinmaier T, Rattei T, Makse HA. The evolutionary dynamics of protein-protein interaction networks inferred from the reconstruction of ancient networks. PloS One. 2013;8:e58134, 1–15.
- Chen B, Fan W, Liu J, Wu FX. Identifying protein complexes and functional modules – from static PPI networks to dynamic PPI networks. Brief Bioinform. 2014;15:177–194.
- The Gene Ontology (GO) project in 2006. Nucleic Acids Res. 2006;34:D322–D326.
- Wu M, Li XL, Kwoh CK, Ng SK. A core-attachment based method to detect protein complexes in PPI networks. BMC Bioinform. 2009;10:169–185.
- Chua HN, Sung WK, Wong L. Exploiting indirect neighbours and topological weight to predict protein function from protein-protein interactions. Bioinformatics. 2006;22:1623–1630.
- Edgar R, Domrachev M, Lash AE. Gene expression omnibus: NCBI gene expression and hybridization array data repository. Nucleic Acids Res. 2002;30:207–210.
- Marks VD, Ho Sui SJ, Erasmus D, van der Merwe GK, Brumm J, Wasserman WW, Bryan J, van Vuuren HJ. Dynamics of the yeast transcriptome during wine fermentation reveals a novel fermentation stress response. FEMS Yeast Res. 2008;8:35–52.
- Xenarios I, Fernandez E, Salwinski L, Duan XJ, Thompson MJ, Marcotte EM, Eisenberg D. DIP: The Database of Interacting Proteins: 2001 update. Nucleic Acids Res. 2001;29:239–241.
- Li M, Chen JE, Wang JX, Hu B, Chen G. Modifying the DPClus algorithm for identifying protein complexes based on new topological structures. BMC Bioinform. 2008;9:398–414.
- Huang DW, Sherman BT, Lempicki RA. Systematic and integrative analysis of large gene lists using DAVID bioinformatics resources. Nat Protoc. 2009;4:44–57.
- Adamcsek B, Palla G, Farkas IJ, Derenyi I, Vicsek T. CFinder: locating cliques and overlapping modules in biological networks. Bioinformatics. 2006;22:1021–1023.
- Brohee S, van Helden J. Evaluation of clustering algorithms for protein-protein interaction networks. BMC Bioinform. 2006;7:488–507.
- Gavin AC, Aloy P, Grandi P, Krause R, Boesche M, Marzioch M, Rau C, Jensen LJ, Bastuck S, Dumpelfeld B, Edelmann A, Heurtier MA, Hoffman V, Hoefert C, Klein K, Hudak M, Michon AM, Schelder M, Schirle M, Remor M, Rudi T, Hooper S, Bauer A, Bouwmeester T, Casari G, Drewes G, Neubauer G, Rick JM, Kuster B, Bork P, Russell RB, Superti-Furga G. Proteome survey reveals modularity of the yeast cell machinery. Nature. 2006;440:631–636.
- Chakraborty S, Ghosh TC. Evolutionary rate heterogeneity of core and attachment proteins in yeast protein complexes. Genome Biol Evol. 2013;5:1366–1375.
- Das J, Chakraborty S, Podder S, Ghosh TC. Complex-forming proteins escape the robust regulations of miRNA in human. FEBS Lett. 2013;587:2284–2287.
- Chakraborty S, Kahali B, Ghosh TC. Protein complex forming ability is favored over the features of interacting partners in determining the evolutionary rates of proteins in the yeast protein-protein interaction networks. BMC Syst Biol. 2010;4:155–164.