
Abstract
Sub-species diversity of pepper populations of Xanthomonas euvesicatoria in Bulgaria and Macedonia in 2012 was the object of this study. Species determination of 44 strains was performed by molecular methods using two pairs of species-specific primers and RFLP (restriction fragment length polymorphism) analysis of the 16S-23S ITS region with HpaII. The populations were characterized by genotypic and phenotypic properties. The genotypic diversity of the strains was evaluated by RAPD (random amplified polymorphic DNA) technique. Primer CUGEA-6 differentiated the strains in two groups, one of which included only Bulgarian strains and revealed a mixed profile of the type strain. BiologTM metabolite profiles separated the strains in four groups: two of which were composed only of Bulgarian or Macedonian strains. Correlation between the RAPD and the metabolic profiles was observed. Twelve antibiotics and copper ions in five concentrations (1–5 g kg−1) were tested for biological activity. The inhibition zones of the Bulgarian strains were statistically proven to be considerably larger than the Macedonian ones in the tests with kanamycin, streptomycin, polymyxin B sulphate, tetracycline and vankomycin. The inhibition zones of the Bulgarian strains were statistically proven to be relatively larger than the Macedonian ones in the copper tests. Based on our studies the Macedonian population of X. euvesicatoria manifested a relative homogeneity while a greater diversity was observed in the Bulgarian population.
Introduction
Bacterial spot of pepper caused by the pathogens of genus Xanthomonas has become a very important factor affecting pepper production all over the world. The disease is a major problem in production of bioproducts for fresh consumption and processing especially in areas with high humidity. First records of bacterial spot in Bulgaria were described of tomato in 1936.[Citation1] In the period 1989–1999 Xanthomonas axonopodis pv. vesicatoria and Xanthomonas vesicatoria were intensely studied as one of the main pathogens of tomato.[Citation2,3] In recent years, bacterial spot raises as an economically important disease of pepper.[Citation4] Studies in Macedonia also disclosed the wide distribution of X. campestris pv. vesicatoria in pepper plants in the country with losses reaching 10%–20% per year.[Citation5–7]
For many years, it was believed that the disease was caused by a single, relatively homogenous pathogenic species – X. campestris pv. vesicatoria.[Citation8] Later, in the 1990s Stall et al. [Citation9] and Vauterin et al. [Citation10] found that the species contains two genetically and phenotypically distinct groups (A and B). Vauterin et al. [Citation10] suggested reclassification of the xanthomonads and separated X. campestris pv. vesicatoria into two groups: group A – X. axonopodis pv. vesicatoria and group B – X. vesicatoria. Two other groups (C and D) were later characterized.[Citation11] Jones et al. [Citation12] discovered that groups A, C and D had <70% DNA relatedness with each other, with the type strain of X. axonopodis and with other species of Xanthomonas genus. Therefore, they renamed group A as X. euvesicatoria, group C as X. perforans and group D as X. gardneri. Group B remained as X. vesicatoria.
Although the four species were clearly differentiated, the problem with the control of bacterial spot remains unresolved. The classical approach includes treatment with copper pesticides but in the years their effectiveness has become inversely related to the frequency of their use. One reliable and effective method for control of the disease is breeding pepper varieties with genetic resistance.[Citation13] However, various investigations showed that there is a sub-species variation based on the geographical area. One of the key prerequisites for disease management in each geographical area is the accurate diagnostics, identification of the pathogen and determination of the phenotypic and genotypic diversity in the pathogen populations.
The detection and diagnostics of the pathogen generally include cultivation on semi-selective media and serological tests.[Citation14,15] Since the four species – agents of bacterial spot of pepper have been only recently determined – the molecular techniques for identification are still in a process of development. Analyses of the restriction fragment length polymorphism (RFLP) have provided a highly sensitive strategy for detection of some xanthomonads.[Citation16] In the years, amplification reaction using random oligomeric primers (RAPD-PCR) has been intensively used to reveal genetic variations in various Xanthomonas species.[Citation17–19] Species-specific primers have only recently been designed on the basis of the sequence data following amplification fragment length polymorphism (AFLP) analysis.[Citation20–22]
The aim of this study was to investigate the phenotypic and the genotypic diversity of the pepper populations of X. euvesicatoria in Bulgaria and Macedonia in 2012. The data obtained are necessary for effective breeding, introduction, and use of resistant pepper varieties and lines which are irreplaceable elements in the development of effective disease control strategies in the specific geographical conditions in Bulgaria and Macedonia.
Materials and methods
Strains. Forty-four bacterial strains originating from Bulgaria and Macedonia were the object of this study. The strains were isolated in 2012 from pepper plants with bacterial spot, possessed pathogenic potential upon artificial inoculation and shared the basic characteristics of genus Xanthomonas (Gram reaction, oxidase, inability to grow anaerobically, colonies on YDC). The type cultures X. vesicatoria NBIMCC 2427 (= DSM-22252), X. euvesicatoria NBIMCC 8731 (= DSM-19128), X. perforans NBIMCC 8729 (= DSM-18975) and X. gardneri NBIMCC 8730 (= DSM-19127) were used.
Primers and polymerase chain reaction (PCR) conditions
The taxonomical position of the strains was determined by species-specific PCR with two pairs of primers for X. euvesicatoria – Xeu 2.4/Xeu 2.5 and Bs-XeF/Bs-XeR (), and RFLP analysis of 16S-23S ITS region with HpaII. Sub-species diversity was evaluated by a random amplified polymorphic DNA (RAPD) analysis.
Table 1. Sequences of oligonucleotide primers used in PCR amplifications.
Bacterial strains were cultivated in Luria-Bertrani Broth at 28 °C, 200 rpm, overnight prior to DNA extraction. Cell density of the bacterial suspension was adapted to OD600 = 1. Genomic DNA was extracted by a DNA isolation kit (STS, Ltd.) according to the manufacturer's instructions. Control of yield and purity of the obtained DNA was performed by measuring with a spectrophotometer Nanodrop 2000 (Thermo Scientific) at 230, 260, 280 and 320 nm.
Amplification with primers Xeu 2.4/Xeu 2.5 was carried out in a total volume of 25 μL containing (final concentration) 0.5x Red Taq DNA polymerase MasterMix (VWR Int., LLC), 4 pmol of each primer, and 100 ng of template DNA, under the following reaction conditions: a denaturation step at 94 °C for 5 min, followed by 25 cycles at 94 °С for 45 s, 64 °С for 45 s and 72 °С for 45 s, and a final step at 72 °С for 7 min.[Citation20] Amplification with primers Bs-XeF/Bs-XeR was carried out in a total volume of 25 μL containing (final concentration) 0.5x Red Taq DNA polymerase MasterMix (VWR Int., LLC), 4 pmol of each primer, and 100 ng of template DNA, under the following reaction conditions: a denaturation step at 94 °C for 5 min, followed by 25 cycles at 94 °С for 30 s, 64 °С for 30 s and 72 °С for 30 s, and a final step at 72 °С for 7 min.[Citation20]
Amplification with primers 16S-p2/23S-p7 was carried out in a total volume of 50 μL, containing 1x buffer, 1.5 mM MgCl2, 2 pmol of each primer, 0.15 mM dNTP, 0.4 U Taq polymerase and 100 ng of DNA, under the following reaction conditions: a denaturation step at 94 °C for 300 s, followed by 30 cycles at 94 °С for 45 s, 58 °С for 45 s, and 72 °С for 45 s, and a final step at 72 °С for 7 min.[Citation23]
Amplification with random primers CUGEA-3, CUGEA-4, CUGEA-5 and CUGEA-6 () was carried out in a total volume of 25 μL final volume, containing 1x buffer, 2.5 mM MgCl2, 50 pmol of each primer, 0.1 mM dNTPs, 0.5 U Taq polymerase and 100 ng of DNA, under the following reaction conditions: a denaturation step at 94 °C for 4 min, followed by 35 cycles at 94 °С for 60 s, 42 °С for 60 s and 72 °С for 90 s, and a final step at 72 °С for 5 min.[Citation24]
RFLP analysis of PCR products
The model restriction mapping was based on the 16S, 16S-23S ITS and 23S rDNA sequence data in GenBank for X. euvesicatoria, X. vesicatoria, X. gardneri and X. perforans and the sequence for 16S-23S ITS rDNA for X. euvesicatoria NBIMCC 8731 (Kizheva et al., unpublished data) using the online tool restrictionmapper.org.
16S-23S ITS fragments amplified by PCR with the primer pair 16S-p2/23S-p7 were analysed by restriction endonuclease digestion with HpaII (Fermentas) in a total volume of 25 μL containing 10 μL enzyme mix (containing, final concentrations: 10 U enzyme and 1x Buffer Tango™ in nuclease-free water) and 15 μL PCR product for 3h at 37 °С.
Electrophoresis
The PCR and restriction products were separated electrophoretically in 1.5% agarose gel in Tris-borate-EDTA (TBE) buffer for 30 min at 100V, stained with ethidium bromide (EtBr) and visualized under UV light. GeneRuler 100 bp Plus DNA Ladder (Fermentas) was used. The gels were analysed by GenoSoft Capture and GenoSoft Imaging software (VWR Int., LLC).
Biochemical characterization
Metabolic fingerprints of the strains were obtained using GN Microplates of the system BIOLOGTM (Biolog Inc., USA). Procedure was held according to manufacturer's instructions. The results were cluster analysed through the SPSS 16.0 hierarchical cluster analysis procedure by the Ward's method. The matrix of similarity between the isolates was calculated using the Squared Euclidean distance.[Citation25–28]
Resistance to copper and antibiotics
Resistance to copper and antibiotics was studied by the disk-diffusion method. Bacterial strains evaluated for susceptibility were prepared as bacterial suspensions (cells in physiological solution) adjusted to an optical density of 0.5 McFarland standard (corresponding to 1.5 × 10⁷ CFU mL−1). Antibiotics from different groups were used as impregnated filter discs (μg mL−1, water solutions) as follows: gentamycin (50), polymixin B sulphate (50), streptomycin sulphate (50), lincomycin hydrochloride (10), vancomycin (50), kanamycin (50), bacitracin (50), ampicillin (50), cephazoline (10), tetracycline (30), sulfamethoxazole-trimethoprim (23.75/1.25) and chloramphenicol 20 μg/mL, absolute alcohol solution. Limit values of susceptibility were according to NCCLS. Copper ions (Cu2+ in CuSO4) were used as 50 μL solution in concentrations (g kg−1) 1, 2, 3, 4, 5. The diameters of the inhibition zones (mm) were measured 24 h after inoculation.
Results and discussion
Species determination
The taxonomical position of the strains was determined by the use of PCR with two pairs of species-specific primers for X. euvesicatoria and RFLP analysis of 16S-23S ITS region with HpaII.
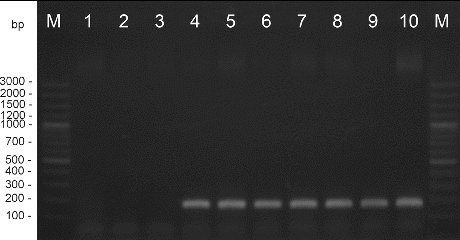
Amplification with DNA extracted from the pepper strains and type strain X. euvesicatoria gave positive results. DNA from the X. vesicatoria, X. gardneri, and X. perforans cultures did not amplify in these reactions. The length of the products was determined as 226 bp for primers Xeu 2.4/Xeu 2.5 and 171 bp for primers Bs-XeF/Bs-XeR ( and ). The obtained results correspond to the results published before.[Citation21,22]
Figure 1. PCR amplification with species-specific primers Xeu 2.4/Xeu 2.5. M – DNA ladder, 1 – X. perforans NBIMCC 8729, 2 – X. gardneri NBIMCC 8730, 3 – X. vesicatoria NBIMCC 2427, 4 – X. euvesicatoria NBIMCC 8731, 5–10 – X. euvesicatoria strains.
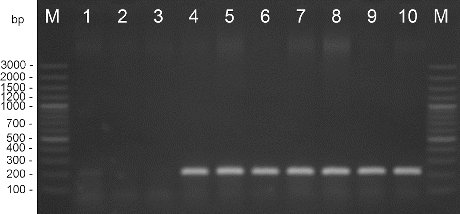
Figure 2. PCR amplification with species-specific primers Bs-XeF/Bs-XeR. M – DNA ladder, 1 – X. perforans NBIMCC 8729, 2 – X. gardneri NBIMCC 8730, 3 – X. vesicatoria NBIMCC 2427, 4 – X. euvesicatoria NBIMCC 8731, 5–10 – X. euvesicatoria strains.
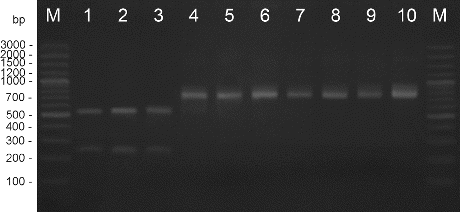
Amplification with the primers for 16S-23S ITS region gave a product of 845 bp. The fragment includes ∼150 bp from the 16S rRNA region, ∼550 bp of the ITS 16S-23S region and ∼207 bp from the 23S rRNA region.[Citation23] The RFLP method was evaluated to differentiate between species having closely related identities in the 16S–23S rDNA ITS.[Citation23] Very few data are available on the 16S-23S ITS rDNA for X. euvesicatoria. The model restriction mapping of 16S-23S ITS region based on the data in GenBank with endonuclease HpaII did not distinguish the four species. However, the model restriction mapping of 16S-23S ITS region based on the data in GenBank and the sequence of the type strain X. euvesicatoria (Kizheva et al., unpublished data) with the same endonuclease distinguished the species X. euvesicatoria from X. vesicatoria, X. gardneri, and X. perforans gave one restriction product against two restriction products, respectively ().
Figure 3. RFLP analysis with endonuclease Hpa II. M – DNA ladder, 1 – X. perforans NBIMCC 8729, 2 – X. gardneri NBIMCC 8730, 3 – X. vesicatoria NBIMCC 2427, 4 – X. euvesicatoria NBIMCC 8731, 5–10 – X. euvesicatoria strains.
Sub-species genotypic diversity
The genotypic diversity of the strains identified as X. euvesicatoria was evaluated by RAPD analysis. Four random primers were used for initial experiments. CUGEA-3, CUGEA-4 and CUGEA-5, and they did not give differentiation between the strains. Therefore, were excluded from further analysis.
Amplification with CUGEA-6 differentiated the studied X. euvesicatoria strains in two distinct groups according to their RAPD profiles. The first group included 10 strains, all of which Bulgarian (36%), and its profile consisted of five products (profile I). The second and larger group comprised 34 strains – 64% of the Bulgarian and all of the Macedonian strains and its profile possessed four products (profile II). The groups shared equal length of the largest product (2443 bp) and disclosed similar lengths of the two smallest products (661 bp/633 bp and 548 bp/ ∼527 bp). Two of the PCR products of profile I and one of the PCR products of profile II were clearly distinguishable (). The type strain's profile was characterized by five products and it was observed to be a mixture between profiles I and II. It possessed the largest product of 2443 bp, the smallest one of profile I (548 bp) and two other equal to profile II. The fifth product's length was very close to the length of one of the products of profile I ().
Figure 4. RAPD analysis with primer CUGEA-6. On the right: M – DNA ladder, 1, 2 – representative X. euvesicatoria strains forming profile I, 3–6 – representative X. euvesicatoria strains forming profile II, 8 – X. vesicatoria, 9 – X. gardneri, 10 – X. perforans, 11 – PCR mix. On the left: graphs of the two profiles and the profile of the type strain X. euvesicatoria NBIMCC 8731. The numbers on the top of the graphs correspond to the length of the amplicons.
Sub-species metabolic diversity
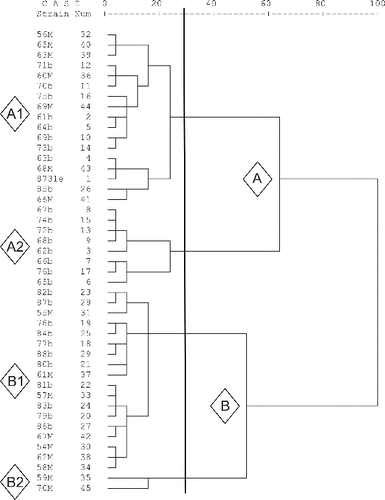
The phenotypic diversity of the strains was evaluated by BiologTM system. The metabolite profiles of the strains showed similarity in 45 of the substrates. All the strains utilized 15 carbon sources and did not utilize 30 of them. The Bulgarian strains did not utilize another 10 additional substrates. The Macedonian strains did not utilize overall 33 substrates and utilized 19 substrates. The processing of BiologTM data separated the tested strains into two main clusters A and B the larger of which included 61% of the Bulgarian and 44% of the Macedonian strains (). At 75% similarity four sub-clusters were formed (A1, A2, B1 and B2). A1 and B1 were mixed of Bulgarian and Macedonian strains. A2 sub-cluster comprised only Bulgarian strains and B2 sub-cluster was the smallest one with only two Macedonian strains.
Figure 5. Distribution of the X. euvesicatoria strains according to the similarity of their Biolog metabolic profiles.
Sub-species resistance diversity
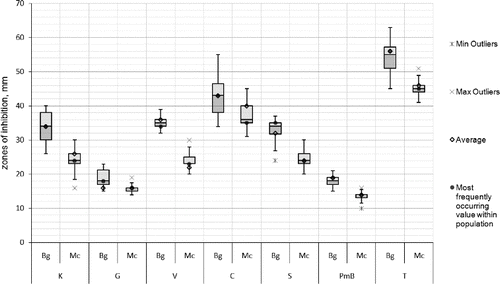
The susceptibility of the strains to 12 antibiotics was determined. All strains were resistant to cefazolin, sulfomethoxazole-trimetoprim, bacitracin, lincomycin, and ampicillin and susceptible to kanamycin, gentamycin, vancomycin, chloramphenicol, streptomycin, polymyxin B sulphate and tetracycline. The inhibition zones of the Bulgarian strains were statistically proven to be considerably larger than the Macedonian ones in the tests with kanamycin, streptomycin, polymyxin B sulphate, tetracycline and vankomycin (). All strains showed a great susceptibility to chloramphenicol and tetracycline according to the limit values of NCCLS. The data obtained corresponded to the results of Shenge et al. [Citation29] for the susceptibility of xanthomonads to streptomycin, gentamycin, and chloramphenicol.
Figure 6. Box-plot of the zones (mm) of the susceptibility to antibiotics of the X. euvesicatoria strains. Bg – Bulgarian strains, Mc – Macedonian strains, K – kanamycin, G – gentamycin, V – vankomycin, C – chloramphenicol, S – streptomycin, PmB – polymixin B sulphate and T – tetracycline.
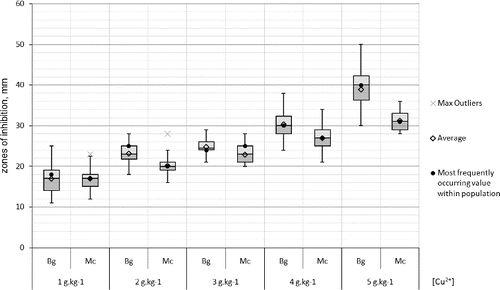
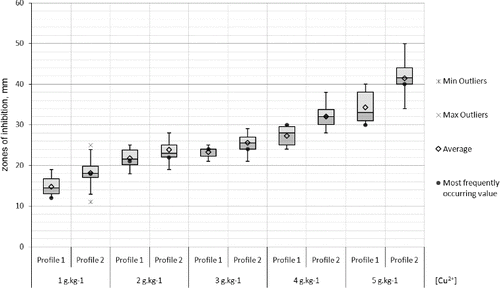
Resistance in populations to copper ions was not observed. Two-third of the strains were weakly susceptible to 1 g kg−1 copper ions. All strains were strongly susceptible to copper concentrations 3–5 g kg−1. The inhibition zones of the Bulgarian strains were statistically proven to be relatively larger than the Macedonian ones in the copper tests ().
Figure 7. Box-plot of the zones (mm) of the susceptibility to copper of the X. euvesicatoria strains. Bg – Bulgarian strains and Mc – Macedonian strains.
The two groups of strains according to their RAPD profiles showed some relativity to the groups formed by the metabolic patterns. All the strains with RAPD profile I were located in metabolic cluster A and with the exception of two strains formed the homogenous A2 sub-cluster. The strains from profile II were relatively equally distributed among A1 and B1 metabolic sub-clusters with only two strains constituting the small B2 sub-cluster. The Bulgarian strains were distributed in the three larger Biolog metabolic sub-clusters and in the two RAPD profiles while the Macedonian strains were mainly separated in two of the larger Biolog metabolic groups and corresponded to a single RAPD profile.
Differences between the Bulgarian and Macedonian populations were clearly observed in the antibiotics and copper tests. The resistance variation intervals (in mm) to gentamycin, tetracycline, and 5 g kg−1 copper ions were comparatively narrower with the Macedonian strains. The comparative analyses of the strains forming the two RAPD profiles did not show any differences concerning the susceptibility to antibiotics and the susceptibility to copper which could be expected as RAPD profile II comprises strains from both populations. However, the statistical analysis of only the Bulgarian strains revealed that the strains from RAPD profile II were relatively more susceptible to kanamycin, gentamycin, chloramphenicol and tetracycline than the strains from RAPD profile I (). Moreover, the larger part of the Bulgarian strains from RAPD profile II were comparatively more susceptible to copper than the rest forming RAPD profile I ().
Figure 8. Box-plot of the zones (mm) of the susceptibility to antibiotics of the X. euvesicatoria strains from Bulgaria according to their RAPD profiles. K – kanamycin, G – gentamycin, V – vankomycin, C – chloramphenicol, S – streptomycin, PmB – polymixin B sulphate and T – tetracycline.
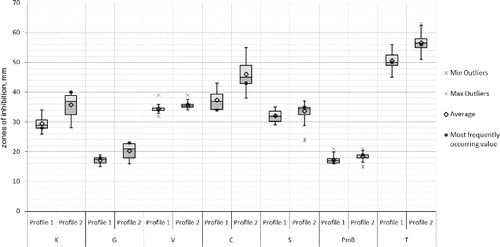
Figure 9. Box-plot of the zones (mm) of the susceptibility to copper of the X. euvesicatoria strains from Bulgaria according to their RAPD profiles.
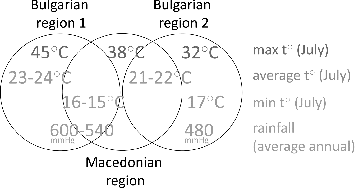
Some interesting facts concerning the origin of the strains and their grouping in the Biolog metabolic clusters can be observed. The Bulgarian strains originate from regions with two types of climatic conditions. The average temperatures in July of the first type vary between 23–24 °C with maximums up to 45 °C and minimums of ∼16 °C, and the average annual rainfall is 540–600 mmHg.[Citation30–32] All Bulgarian strains from Biolog metabolic cluster A were isolated from pepper plants grown in these regions. The second type is characterized by average temperatures in July between 21 and 22 °C, maximums up to 32 °C, minimums of ∼17 °C, and average annual rainfall of 480 mmHg.[Citation30–32] and it is the origination of the Bulgarian strains from Biolog metabolic cluster B. The Macedonian strains are evenly distributed between the two Biolog clusters A and B and originate from a single region in Macedonia. This region seems to share characteristics of both the Bulgarian climatic types – average temperatures in July of 21 °C, minimums of 15 °C, maximums up to 38 °C, and average annual rainfall of ∼540 mmHg.[Citation32,33] (). The pepper varieties did not have any relation to the observed RAPD profiles, Biolog metabolic clusters, or susceptibility to antibiotics and copper. The metabolic patterns might be a result of the adaptation of the bacteria to the environmental conditions.
Figure 10. Basic climate conditions of the regions ancestor for the studied strains.
Conclusions
Based on our studies on the RAPD analysis, antibiotics and copper tests, the Macedonian population of X. euvesicatoria manifested a relative homogeneity while a greater diversity was observed in the Bulgarian population. The Bulgarian population was more susceptible to some antibiotics, including streptomycin and tetracycline, and relatively more susceptible to copper.
Additional information
Funding
References
- Kovachevski I. Trudove na bulgarskoto prirodoizpitatelno druzhestvo. Sci Works Bulgarian Nat Soc. 1936;17:13–24. Bulgarian.
- Bogatzevska N. Phytopathogenic bacteria from genus Pseudomonas group syringae and genus Xanthomonas groups vesicatoria and axonopodis – phases of development [dissertation]. Kostinbrod (Bulgaria): Plant Protection Institute, Agricultural Academy; 2002. Bulgarian.
- Bogatzevska N, Sotirova V. Bacterial spot of tomato in Bulgaria: pathotypes and races. Genet Breed. 2002;31:59–66.
- Bogatzevska N, Stoimenova E, Mitrev E. Bacterial and virus diseases spread in Bulgaria and Macedonia on field and greenhouse pepper. Yearbook of Plant Protection Society of the R. of Macedonia. 2007;18:17–21.
- Mitrev S, Pejcinovski F. Characterization of Xanthomonas campestris pv. vesicatoria, causal agent of bacterial spot of pepper, cv. kurtovska kapija. Yearbook of Plant Protection Society of the R. of Macedonia. 1999. p. 151–163.
- Mitrev S. Phytopathogenic bacteria on pepper in Macedonia. Strumica: PSI Institute of Southern Crops; 2001.
- Mitrev S, Kovačevic B. Characterization of Xanthomonas axonopodis pv. vesicatoria isolated from peppers in Macedonia. J Plant Pathol. 2006;88:321–324.
- Jones L, Stall R, Bouzar H. Diversity among Xanthomonads pathogenic on pepper and tomato. Annu Rev Phytopathol. 1998;36:41–58.
- Stall RE, Beaulieu C, Egel D, Hodge NC, Leite RP, Minsavage GV, Bouzar H, Jones JB, Alvarez AM, Benedict AA. Two genetically diverse groups of strains are included in Xanthomonas campestris pv. vesicatoria. Int J Syst Bacteriol. 1994;44:47–53.
- Vauterin L, Hoste B, Kersters K, Swings J. Reclassification of Xanthomonas. Int J Syst Bacteriol. 1995;45:472–489.
- Jones JB, Bouzar H, Stall RE, Almira EC, Roberts P, Bowen BW, Sudberry J, Strickler P, Chun J. Systematic analysis of xanthomonads (Xanthomonas spp.) associated with pepper and tomato lesion. Int Syst Bacterial. 2000;50:1211–1219.
- Jones JB, Lacy GH, Bouzar H, Stall RE, Schaad NW. Reclassification of the Xanthomonas associated with bacterial spot disease of tomato and pepper. Syst Appl Microbiol. 2004;27:755–762.
- Blancard D. A colour atlas of tomato disease: observations, identification and control. New York: John Wiley & Sons; 1997. p. 212.
- McGuire RG, Jones JB, Sasser M. Tween media for semi-selective isolation of Xanthomonas campestris pv. vesicatoria fom soil and plant material. Plant Dis. 1986;70:887–891.
- Tsuchiya K, D’Ursel CCM, Horita M, Nozu Y. Relation of Japanese Xanthomonas campestris pv. vesicatoria with worldwide strains revealed with three specific monoclonal antibodies. J Gen Plant Pathol. 2003;69:310–315.
- Simões TH, Gonçalves ER, Rosato YB, Mehta A. Differentiation of Xanthomonas species by PCR-RFLP of rpfB and atpD genes. FEMS Microbiol Lett. 2007;271:33–39.
- Permaul K, Pillay D, Pillay B. TI - Random-amplified polymorphic DNA (RAPD) analysis shows intraspecies differences among Xanthomonas albilineans strains. Lett Appl Microbiol. 1996;23:307–311.
- Trebaol G, Manceau C, Tirilly Y, Boury S. Assessment of the genetic diversity among strains of Xanthomonas cynarae by randomly amplified polymorphic DNA analysis and development of specific characterized amplified regions for the rapid identification of X. cynarae. Appl Environ Microbiol. 2001;67:3379–3384.
- Shahrestani AT, Kazempour MN, Ebadie AA, Elahinia SA. Genetic diversity of Xanthomonas oryzae pv. oryzae in rice fields of Guilan province (Iran) using RAPD markers. Agricultura tropica et subtropica. 2012;45:60–65.
- Koenraadt H, van Betteray B, Germain R, Hiddink G, Jones JB, Oosterhof J, Rijlaarsdam A, Roorda P, Woudt B. Development of specific primers for the molecular detection of bacterial spot of pepper and tomato. Acta Hortic. 2009;808:99–102.
- Moretti C, Amatulli MT, Buonaurio R. PCR-based assay for the detection of Xanthomonas euvesicatoria causing pepper and tomato bacterial spot. Lett Appl Microbiol. 2009;49:466–471.
- Araújo ER, Costa JR, Ferreira MASV, Quezado-Duval AM. Simultaneous detection and identification of the Xanthomonas species complex associated with tomato bacterial spot using species-specific primers and multiplex PCR. J Appl Microbiol. 2012;113:1479–1490.
- Rachman CN, Kabadjova H, Prévost H, Dousset X. Identification of Lactobacillus alimentarius and Lactobacillus farciminis with 16S-23S rDNA intergenic spacer region polymorphism and PCR amplification using species-specific oligonucleotide. J Appl Microbiol. 2003;95:1207–1216.
- Momol MT, Momol EA, Lamboy WF, Norelli JL, Beer SV, Aldwinckle HS. Characterization of Erwinia amylovora strains using random amplified polymorphic DNA fragment (RAPDs). J Appl Microbiol. 1997;82:389–398.
- Ward JH. Hierarchical grouping to optimize an objective function. J Am Stat Assoc. 1963;58:236–244.
- Kaufman L, Rousseeuw PJ. Finding groups in data. New York: John Wiley & Sons; 1990.
- Everitt BS. Cluster analysis. London: Edward Arnold; 1993.
- Everitt BS, Landau S, Leese M. Cluster analysis. London: Edward Arnold; 2001.
- Shenge KC, Mabagala RB, Mortensen CN. Identification and characterization of strains of Xanthomonas campestris pv. vesicatoria from Tanzaniq by Biolog system and sensitivity to antibiotics. Afr J Biotechnol. 2007;6:15–22.
- Archive of the National Institute of Meteorology and Hydrology: factual information [Internet]. 2013 [cited 2013 Oct 1]. Available from: http://www.stringmeteo.com/synop/index.php
- Bandarova T. Atlas of geography and economics. Sofia: Datamap; 2008. Bulgarian.
- Climatic database [Internet]. 2013 [cited 2013 Oct 1]. Available from: http://www.weatherbase.com
- Vasileski D, Markoski B, Panov N, Dimitrov N, Pavlovski G. National geography. 3rd ed. Skopje: Prosvetno delo; 2007.