
Abstract
Eighteen sequence-related amplified polymorphism (SRAP) primer combinations were used to assess the genetic diversity of 126 individuals from five different geographical populations of Vitis ficifolia Bge. The numbers of bands scored per primer combination ranged from 8 to 27, with an average of 18.6 bands. At the population level, the percentage of polymorphic bands (PPB), Nei's gene diversity index (H) and Shannon's information index (I) were the highest in the Shihe (Xinyang) population (77.31%, 0.1987, 0.2805) and the lowest in the Linzhou (Anyang) population (55.82%, 0.1112, 0.1727). At the species level, PPB, H and I were 80.56%, 0.2129 and 0.3075, respectively. The genetic differentiation coefficient (GST) was 0.2055 and the gene flow (Nm) was 1.9328, indicating strong intra-population genetic differentiation. Based on the unweighted pair group method based arithmetic average clustering diagram, the five studied populations may be divided into three groups. The clustering results were almost in accordance with the populations’ geographical distribution.
Introduction
The genetic diversity of plant species is a major concern for geneticists and plant breeders.[Citation1] The current methods for measuring genetic diversity of populations and germplasm collections are often conducted through statistics calculated from molecular marker data.[Citation2] Analysis of the genetic structure at an intra-specific level is important for better understanding of future adaptive changes or evolution,[Citation3] and also for future breeding programmes.
Grapevine (Vitis spp.) is one of the most important fruit crops worldwide with more than 70 species of Vitis spp. in the world.[Citation4–6] More than 38 Vitis species have their origin in China, making China one of the major gene centres of Vitis species origination.[Citation5] Chinese wild grape species are of particular interest in grape breeding for their desirable characteristics, such as disease resistance, drought tolerance and cold hardiness genes.[Citation5,Citation7,Citation8] V. ficifolia Bge. is a subspecies of V. heyneana Roem. et Schult, and is distributed mainly in the northern and eastern China, at altitudes between 100 and 1300 m,[Citation5] especially in Henan Province in Central China. V. ficifolia has excellent tolerance to anthracnose, ripe rot diseases and winter cold, and is used both as table grape and in wine production.
One of the most powerful tools for analysis of genomes is molecular genetic markers. They allow for heritable traits to be associated with underlying genomic variation.[Citation9] Sequence-related amplified polymorphism (SRAP) is a polymerase chain reaction (PCR)-based marker system targeting open reading frames (ORFs).[Citation10] With reproducible results, high reliability, simple technology and low cost, SRAP has been applied in the assessment of the population structure and genetic diversity of many fruit species.[Citation11–18]
In this study, SRAP analysis was employed to investigate: (1) the levels of SRAP variations in V. ficifolia Bge. populations; (2) the levels of genetic diversity within and among populations and (3) the genetic relationships among populations.
Materials and methods
Plant materials
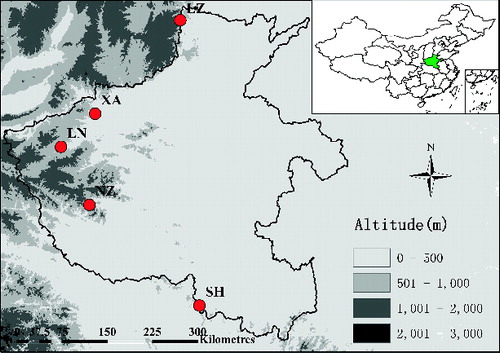
A total of 126 V. ficifolia Bge. individuals of five different wild populations were selected from Henan Province of China. Their places of origin and distributions are shown in and .
Table 1. Different locations of sample collection in Henan Province of China.
Figure 1. Map showing locations of the sampled populations of V. ficifolia Bge.
DNA isolation
Total genomic DNA was isolated from fresh leaves following the procedure previously described by Liu et al. [Citation16]. The quality and concentration of the DNA samples were checked in a biophotometer plus (Eppendorf, Germany) and a portion of the DNA was diluted to 50 ng/μL for subsequent SRAP analysis. Both the stock and diluted portions were stored at −20 °C.
SRAP analysis
The SRAP analysis was carried out using 26 primers including 13 forward (Me1-13) and 13 reverse (Em1-13) SRAP primers 11-18,[Citation10] for a total of 169 primer combinations. The primer sequences were synthesized by Shanghai Biological Engineering Technology and Service Co. Ltd. Each 10 μL PCR reaction mixture consisted of 30–50 ng of template DNA, 0.2 mmol/L of deoxynucleoside triphosphates (dNTPs), 1.0 μmol/L of each primer, 2.0 mmol/L of Mg2+ and 1 U Taq DNA polymerase (TaKaRa). The amplification reaction procedure was as follows: after denaturation at 94 °C for 5 min, the reaction mixture was subjected to amplification for seven cycles consisting of 90 s at 94 °C, 75 s at 35 °C, 30 s at 72 °C, followed by 30 cycles consisting of 60 s at 94 °C, 60 s at 55 °C and 90 s at 72 °C, with a final extension at 72 °C for 5 min.
Data analysis
Amplified bands were scored as either present (1) or absent (0). The data were entered into a binary matrix and, subsequently, POPGENE 32 software was used to compute the population genetic parameters, the percentage of polymorphic bands (PPB), Shannon's information index (I), Nei's gene diversity (H), genetic identity and genetic distance, etc. AMOVA 30 software was used to estimate the relative genetic differentiation coefficient (GST) and the level of gene flow (Nm). Cluster analyses were conducted on the similarity matrix with the unweighted pair group method based arithmetic average (UPGMA), and the resulting clusters were expressed as dendrograms.
Results and discussion
SRAP polymorphism
Eighteen informative primers were selected due to their ability to produce clearly and repeatedly polymorphic and unambiguous bands among the accessions (). As shown in , a total of 335 bands were obtained with 18 primer combinations. Of these bands, 268 were highly polymorphic (80.56% polymorphism), ranging from 50 to 1500 bp. The numbers of amplicons scored per primer combination ranged from 8 (for combination Me10/Em13) to 27 (for combinations Me10/Em6 and Me10/Em8), with an average of 18.6 bands. The number of polymorphic bands (NPB) per primer combination ranged from 6 to 22; the average one was 14.9. The PPB for each primer combination varied from 59.26% (Me10/Em8) to 88.24% (Me4/Em6). The PPB of the Me4/Em6 primer combination in XA, NZ and SH populations was the highest (100.0%), and in LZ, the lowest (52.9%). In the five populations, SH was the highest with 17.3 average polymorphic bands and 77.31% PPB.
Table 2. Polymorphism revealed by different primer combinations used in SRAP analysis.
Table 3. Genetic diversity of different populations.
SRAP was initially developed for Brassica species, and was tested in other crops. In genetic diversity analysis, the information given by SRAP markers is concordant with the morphological variability.[Citation16,Citation19] The detection of high levels of polymorphism makes SRAP analysis a powerful tool for assessment of genetic diversity in many species.[Citation15,Citation20,Citation21] To the best of our knowledge, the present study is the first report of genetic investigation of V. ficifolia Bge. using SRAP markers. The results indicated that SRAP markers could be used efficiently in the genetic diversity and genetic variability of V. ficifolia Bge.
Genetic diversity
Genetic polymorphism may be indicative of evolutionary adaptation which plays a key role for survival of a population in the changing environment.[Citation22] Accurate estimates of genetic diversity are particularly useful for optimization of sampling strategies and for conservation and management of the genetic diversity of trees.[Citation23] The estimates of the genetic diversity in each population are summarized in . The percentage of polymorphic bands ranged from 55.82% (LZ) to 77.31% (SH). Nei's gene diversity index of the five populations ranged from 0.1112 to 0.1987 and Shannon's diversity index ranged from 0.1727 to 0.2805. Among these five populations, populations SH and NZ exhibited the highest level of variability (PPB: 77.31% and 77.01%, H: 0.1987 and 0.1963, I: 0.2805 and 0.2689, respectively), whereas population LZ exhibited the lowest level of variability (PPB: 55.82%, H: 0.1112, I: 0.1727), as shown in .
Genetic differentiation and gene flow
Genetic differentiation and gene flow are important indices for evaluation of the genetic structure of a group. Based on the analysis by AMOVA 30 software, the relative genetic differentiation coefficient (GST) was 0.2055, which showed that the major genetic variation (72.95%) originated from intra-population diversity, and the rest (20.55%) existed among populations. The level of gene flow (Nm) is a key factor that affects the genetic structure and genetic differentiation among populations. Based on the AMOVA analysis, the level of gene flow (Nm) among the five populations was 1.9328.
The results obtained here showed that a high proportion of the variability was due to intra-population variability, and this high genetic variability was consistent with the previous results obtained by morphological analysis.[Citation24] Gene flow is reversely correlated with the group genetic differentiation. Also, gene flow is very important for the dispersal and evolution of plant populations. In seed plants, gene flow is mainly achieved by seeds or pollen carrying foreign genes between groups.[Citation25] When Nm > 1.0, this indicates that the level of gene flow is higher; when Nm > 5.0, the outcrossing rate is higher.[Citation26] In this study, the gene flow among populations was high (Nm = 1.9328). This indicated that high-level gene flow existed within V. ficifolia populations. This result was consistent with the previous results.[Citation22,Citation27–31] The reason for slightly higher GST may lie in the morphological character of the wild V. ficifolia, with the vines growing up into tall plants, and the tall plants benefitting due to reduced resistance to pollen movement in the air. Moreover, a lack of effective geographic isolation may also contribute to the improvement of gene homogenization among populations.[Citation32] Widely distributed plant species must adapt to a broad range of environmental conditions to maintain their large geographic distributions.[Citation33] Consequently, many widespread species have high genetic diversity or exhibit considerable phenotypic plasticity.[Citation34,35] V. ficifolia has wide distribution in northern and eastern China, especially in Henan Province. However, it should be noted that the V. ficifolia populations used in this study were sampled from a narrow eco-geographical area of distribution.
Genetic similarity
In genetic diversity analysis, there are various genetic distance measures for analysis of molecular marker data. Genetic identity is an important index for estimation of the genetic differentiation among populations. Based on our POPGENE analysis, the genetic identity and genetic distance between each two populations, respectively, ranged from 0.9171 to 0.9825 and from 0.0176 to 0.0866. This suggested that there was a high genetic similarity between the populations, indicating lower reproductive isolation among the populations (). The minimum genetic identity occurred between SH and LZ; the maximum one occurred between LN and XA; and SH population constituted the farthest genetic relationship with the other four populations.
Table 4. Genetic identity and genetic distance of the five studied populations.
Cluster analysis
The dendrogram obtained with SRAP data is shown in . The five populations may be divided into three groups. The populations located nearest to each other, NZ, XA and LN, were classified as the first group. Then, they clustered with population LZ, and population SH in southern Henan formed a separate group. The genetic relationships between populations of a widespread species often do not correspond to their geographical distance.[Citation36,37] However, Ma et al. [Citation33] found that most of the Elymus sibiricus populations studied by them clustered in accordance with the geographic distribution. In our study, the clustering results were almost in accordance with the geographical distribution.
Figure 2. Dendrogram of the five geographical populations using UPGMA.
The in situ method allows continuing evolution of the species in its natural habitat and then guaranteeing the maintenance of most of the species’ genetic variation. In this study, population SH showed relatively high genetic diversity within V. ficifolia Bge., and should therefore be a priority site for in situ conservation.
Conclusions
The present study is, to the best of our knowledge, the first report of genetic investigation of V. ficifolia Bge., using SRAP markers. The results indicated that SRAP markers could be used efficiently in the study of genetic diversity and genetic variability of V. ficifolia. High-level gene flow existed within V. ficifolia populations. The clustering results based on SRAP were almost in accordance with the geographical distribution of the populations. In our study, the Shihe population (SH) showed relatively high genetic diversity within V. ficifolia Bge., and should therefore be a priority site for in situ conservation.
Acknowledgements
We are grateful to Prof. Dalong Guo at Henan University of Science and Technology for many helpful comments on previous drafts.
Disclosure statement
No potential conflict of interest was reported by the author(s).
Additional information
Funding
References
- Cervantes-Martinez C, Brown JS, Schnell R, Motamayor JC, Meerow AW, Zhang DP. A computer simulation study on the number of loci and trees required to estimate genetic variability in cacao (Theobroma cacao L.). Tree Genet Genomes. 2006;2:152–164.
- Mohammadi SA, Prasanna BM. Analysis of genetic diversity in crop plants – salient statistical tools and considerations. Crop Sci. 2003;43:1235–1248.
- Schaal BA, O’Kane S, Rogstad SH. DNA variation in plant populations. Trends Ecol Evol. 1991;6:329–333.
- Alleweldt G, Possingham JV. Progress in grapevine breeding. Theor Appl Genet. 1988;75:669–673.
- Kong QS. 葡萄志 [Flora of Chinese grapes]. Beijing: China Agricultural and Technology Press; 2004. Chinese.
- Mullins MG, Bouquet A, William L. Biology of grapevines. New York (NY): Cambridge University Press; 1992.
- He PC, Wang YJ, Wang GY, Ren ZB, He CC. 中国葡萄属野生种抗病性的研究 [The studies on the disease- resistance of Vitis wild species originated in China]. Sci Agric Sin. 1991;24:50–56. Chinese.
- Wan YZ, Schwaninger H, Li D, Simob CJ, Wang YJ, He PH. The eco-geographic distribution of wild grape germplasm in China. Vitis. 2008;47:77–80.
- Duran C, Appleby N, Edwards D, Batley J. Molecular genetic markers: discovery, applications, data storage and visualisation. Curr Bioinform. 2009;4:16–27.
- Li G, Quiros C. Sequence-related amplified polymorphism (SRAP), a new marker system based on a simple PCR reaction: its application to mapping and gene tagging in Brassica. Theor Appl Genet. 2001;103:455–461.
- Ahmad R, Potter D, Southwick M. Genotyping of peach and nectarine cultivars with SSR and SRAP molecular markers. J Am Soc Hortic Sci. 2004;129:204–210.
- Guo DL, Luo ZR. Genetic relationships of some PCNA persimmons (Diospyros kaki Thunb.) from China and Japan revealed by SRAP analysis. Gen Res Crop Evol. 2006;53:1597–1603.
- Amar MH, Biswasa MK, Zhang ZW, Guo WW. Exploitation of SSR, SRAP and CAPS-SNP markers for genetic diversity of Citrus germplasm collection. Sci Hortic. 2011;129:798–803.
- Ai PF, Zhen ZJ, Jin ZZ. Genetic diversity and relationships within sweet kernel apricot and related Armeniaca species based on sequence-related amplified polymorphism markers. Syst Ecol. 2011;39:694–699.
- Guo DL, Zhang JY, Liu CH, Zhang GH, Li M, Zhang Q. Genetic variability and relationships between and within grape cultivated varieties and wild species based on SRAP markers. Tree Genet Genomes. 2012;8:789–800.
- Liu CH, Fan XC, Jiang JF, Guo DL, Sun HS, Zhang Y, Feng JC. Genetic diversity of Chinese wild grape species by SSR and SRAP marhers. Biotech Biotech Equip. 2012;26:96–101.
- Abedian M, Talebi M, Golmohammdi H, Sayed Tabatabaei BE. Genetic diversity and population structure of mahaleb cherry (Prunus mahaleb L.) and sweet cherry (Prunus avium L.) using SRAP markers. Syst Ecol. 2012;40:112–117.
- Soleimani MH, Talebi M, Sayed-Tabatabaei BE. Use of SRAP markers to assess genetic diversity and population structure of wild, cultivated, and ornamental pomegranates (Punica granatum L.) in different regions of Iran. Plant Syst Evol. 2012;298:1141–1149.
- Ferriol M, Pico B, Nuez F. Genetic diversity of a germplasm collection of Cucurbita pepo using SRAP and AFLP markers. Theor Appl Genet. 2003;107:271–282.
- Wu XM, Chen BY, Lu GY, Wang HZ, Xu K, Gao GZ, Song YC. Genetic diversity in oil and vegetable mustard (Brassica juncea) landraces revealed by SRAP markers. Genet Resour Crop Evol. 2009;l56:1011–1022.
- Zhang XY, Chen FD, Zhang F, Chen SM, Fang WM. 不同地理居群野生菊资源的遗传多样性分析 [Analysis of genetic diversity among different geographical populations of wild species of Dendranthema]. J Nanjing Agri Univ. 2011;34:29–34. Chinese.
- Stevens L, Salomon B, Sun GL. Microsatellite variability and heterozygote excess in Elymus trachycaulus populations from British Columbia in Canada. Biochem Syst Ecol. 2007;35:725–736.
- Hamrick JL, Godt M. Effects of life history traits on genetic diversity in plant species. Phil Trans R Soc Lond B. 1996;351:1291–1298.
- Wang J, Liu CH, Fan XC, Sun HS, Dong D. 河南境内桑叶葡萄种内形态和遗传多样性分析 [Study on the biodiversity of morphology and polymorphism based on SSR markers for Vitis ficifolia native to Henan province in China]. J Fruit Sci. 2008;25:496–500. Chinese.
- Urbanska K. Differentiation patterns in higher plants. New York (NY): Academic Press; 1987.
- Gu WC. 统计遗传学 [Statistical genetics]. Beijing: Science Press; 2004. Chinese.
- Brown A, Clegg M, Kahler A, Weir B. Plant population genetics, breeding and genetic resources. Sunderland (MA): Sinauer Press; 1990.
- Wilson BL, Kitzmiller J, Rolle W, Hipkins VD. Isozyme variation and its environmental correlates in Elymus glaucus from the California Floristic Province. Can J Bot. 2001;79:139–153.
- Sun GL, Salomon B, Bothmer R. Microsatellite polymorphism and genetic differentiation in three Norwegian populations of Elymus alaskanus (Poaceae). Plant Syst Evol. 2002;234:101–110.
- Gaudett M, Salomon B, Sun GL. Molecular variation and population structure in Elymus trachycaulus and comparison with its morphologically similar E. alaskanus. Plant Syst Evol. 2005;250:81–91.
- Ding G, Zhang DZ, Ding XY, Zhou Q, Zhang WC, Li XX. Genetic variation and conservation of the endangered Chinese endemic herb Dendrobium officinale based on SRAP analysis. Plant Syst Evol. 2008;276:149–156.
- Feng FJ, Chen MM, Zhang DD, Sui X, Han SJ. Application of SRAP in the genetic diversity of Pinus koraiensis of different provenances. Afr J Biotechnol. 2009;8:1000–1008.
- Ma X, Zhang XQ, Zhou YH, Bai SQ, Liu W. Assessing genetic diversity of Elymus sibiricus (Poaceae: Triticeae) populations from Qinghai-Tibet Plateau by ISSR markers. Biochem Syst Ecol. 2008;36:514–522.
- Turesson G. The genotypical response of the plant species to the habitat. Hereditas. 1922;3:211–350.
- Schlichting CD. The evolution of phenotypic plasticity in plants. Annu Rev Ecol Syst. 1986;17:667–693.
- Díaz O, Salomon B, Bothmer R. Genetic variation and differentiation in Nordic populations of Elymus alaskanus (Scrib. ex Merr.) Löve (Poaceae). Theor Appl Genet. 1999;99:210–217.
- Qiu YX, Hong DY, Fu CX, Kenneth MC. Genetic variation in the endangered and endemic species Changium smyrnioides (Apiaceae). Biochem Biochem Syst Ecol. 2004;32:583–596.