
Abstract
The F1 hybrid population was a result from the crossing of ‘Damianqiu’ and ‘Qiujinxing’. ‘Damianqiu’ was the female parent and ‘Qiujinxing’ was the male parent. Ninety-two F1 individual plants and their parents, in total of 94 materials, were chosen for the sequence-related amplified polymorphism analysis. The Joinmap3.0 software was used to construct the molecular genetic map of ‘Damianqiu’ and ‘Qiujinxing’, respectively. According to the result, the molecular linkage map of ‘Damianqiu’ has 21 linkage groups with 96 markers, which covers a genetic distance of 686.67 cM, with an average interval of 7.15 cM. ‘Qiujinxing’ has 18 linkage groups with 89 markers, which covers a genetic distance of 529.58 cM, with an average interval of 5.95 cM. The aim of this study was to create the first hawthorn molecular genetic map, which could be used as a foundation for gene mapping and assisted selection in the future.
Keywords:
Introduction
Life science is focused on the molecular gene mapping because of its guidance in breeding and genetic engineering. High-density genetic linkage map is the prerequisite and basis for gene mapping and marker-assisted selection (MAS), due to the character of high-genetic heterozygosity, large tree volume, self-incompatibility and long generation cycle. It is very difficult to construct the ideal mapping population (like with the annual field crops), which limits the construction of genetic mapping of fruit trees. But since Hemmat et al. [Citation1] proposed the concept of ‘double pseudo-testcross’ and applied it on apple genetic mapping for the first time, the construction of molecular genetic map of fruit trees has made considerable progress. In recent years, molecular genetic maps have been successfully constructed for most fruit trees, such as apple,[Citation2–4] pear,[Citation5] tangerine,[Citation6] cherry,[Citation7] banana,[Citation8] olive,[Citation9] papaya,[Citation10] peach,[Citation11] lychee[Citation12] and longan.[Citation13]
Hawthorn (Crataegus pinnatifida Bge.) belongs to Rosaceae (Rosaceae) and is native to China. It is an important plant which can be used to make food and medicine. Most of the cultivars and wild species of hawthorn are diploid (2n = 2x = 34). The ‘double pseudo-testcross’, like in other woody fruit trees, could be used for the construction of a genetic map for hawthorn. Since there is no molecular genetic map for hawthorn at present, in this paper we created a hybrid population based on ‘Damianqiu × Qiujinxing’ and constructed the first hawthorn molecular genetic map. This map lays the foundation for quantitative trait locus (QTL) mapping of hawthorn's important traits and marker-assisted breeding.
Materials and methods
Plant material
The mapping population consisted of 92 F1 individual plants crossed by ‘Damianqiu’ (female) × ‘Qiujinxing’ (male) which were planted in 2006. ‘Damianqiu’ as a main cultivar has the character of orange-red peel, large fruit weighing up to 18–22 g, tastes sweet and sour, soft meat, high edible rate, stable yield and diploid; ‘Qiujinxing’ as a high-quality cultivar has the character of strongcold resistance, dark red peel, medium size, tastes sweet and sour, thick aroma, dense and meticulous flesh, shelf-stable, and it's the diploid varieties too. In this study, 92 individual plants from the hybrid group and their parents in a total of 94 materials were used for molecular marker analysis and mapping construction.
DNA extraction
In May 2013 young leaves of hawthorn were picked and the total genomic DNA was extracted using the hexadecyltrimethy ammonium bromide (CTAB) method.
SRAP reaction system and amplification protocol
A stable system of sequence-related amplified polymorphism (SRAP) has been established.[Citation14] The reaction volume was 20 μL, including 10 × PCR buffer (Mg2+ free) 2.0 μL, Mg2+ 2.5 mmol L−1, dNTPs 0.15 mmol L−1, primer 0.25 μmol L−1, template DNA 20 ng and Taq DNA polymerase 0.5U. The protocol for PCR amplification was initial denaturation (5 min at 94°); denaturation (60s at 94°), annealing (60s at 35°), extension (90 s at 72°), for five cycles; denaturation (60 s at 94°), annealing (60 s at 50°), extension (90 s at 72°), for 35 cycles; final extension (10 min at 72°). The amplification products were separated by electrophoresis on 6% polyacrylamide gels. The gels were visualized by the method of silver staining.
Date acquisition and processing and the map construction
According to the results of electrophoresis, using the number 1 and 0 to represent the marker data, and according to the data, using the ‘CP mapping model’ in the software JoinMap3.0, the LOD D 4.0, maximum recombination rate 0.4, the separated sites of parents were analysed, respectively, we obtained the molecular marker linkage group of the parents. And then Mapchart2.2 was used to construct the linkage map.
Results and discussion
Primer selection
A total of 192 pairs of SRAP primer combinations were used for selection, and 120 pairs of SRAP primers were obtained all of which have a stable amplification, clear banding pattern and good general effect (). Forty-seven pairs of primers were used for PCR amplification in large groups ( ), after electrophoresis, recording the segregation of the markers.
Figure 1. The result of some polymorphism SRAP primers in parents.
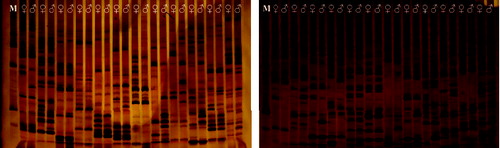
Table 1. SRAP primers used in this study.
Table 2. The combination message of the primers used in this study.
The polymorphic markers of the parents and the segregation distortion of the markers
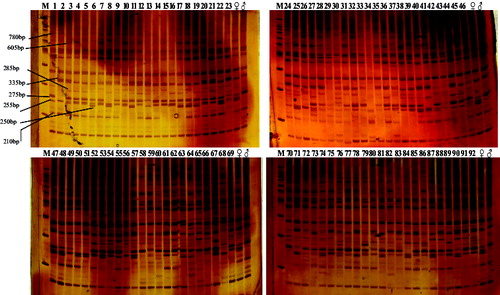
According to the result (), we obtained 315 polymorphism markers in the parents, as the number of markers for the male parent is 84 and 55 for the female parent. The result of χ2 test (α = 0.01) shows that there were 22 markers that deviated from the Mendelian segregation in the male parent, and accounting for 26.19% of the male parent markers; there were 17 markers that deviated from Mendelian segregation in the female parent, and accounting for 30.91% of the female parent markers. In addition, 176 segregating markers, which belong to both parents (segregating in the population, theoretically segregating ratio 3:1), were also obtained. According to χ2 text (α = 0.01), there were 53 marker deviations from the Mendelian segregation, accounting for 30.12% of all the markers. In this study, segregation distortion is evident in all kinds of markers. This degree of segregation distortion has a close relationship with the distance of the parents' kinship; the farther the kinship, the larger the degree of segregation distortion.[Citation16]
Figure. 2. Amplification results of primer e4+m22.
Construction of the molecular genetic map
Using the software JoinMap 3.0, LOD = 4.0, maximum recombination rate 0.4, specific segregation loci of the female parent and the segregation locus which belong to both parents were used for the operation, and the same was done for the male parent. Recombination rate was converted to map distance (cM) by the Kosambi function. Using the Mapchart 2.2 [Citation17] software to construct the molecular genetic map (Figures and ), we obtained the following result: the molecular linkage map of ‘Damianqiu’ has 21 linkage groups with 96 markers, which covers a genetic distance of 686.67 cM, with an average interval of 7.15 cM. The average length of the linkage groups is 32.70 cM. The average number of loci in per group was 4.57. Among the 21 linkage groups, ‘DMQ1’ has the most loci (35). Two linkage groups have the fewest loci (only 2). ‘DMQ1’ also has the longest linkage group, which covers a genetic distance of 91.91 cM, ‘DMQ15’ has the shortest linkage group, which covers a genetic distance of 10.38 cM; the molecular linkage map of ‘Qiujinxing’ has 18 linkage groups with 89 markers, which covers a genetic distance of 529.58 cM, with an average interval of 5.95 cM. The average length of the linkage groups is 29.42 cM, The average number of loci per group is 4.94. Among the 18 linkage groups, ‘QJX1’ has the most loci (38) and the one with the fewest contains only 2. ‘QJX1’ also has the longest linkage group, which covers a genetic distance of 43.57 cM; the shortest is only 10.54 cM.
Figure 3. The genetic linkage map of ‘Damianqiu’.
Figure 4. The genetic linkage map of ‘Qiujinxing’.
According to a comparison of the two parents, many loci on the 1, 6, 8, 10,12, 15, 16, 18 linkage groups of ‘Qiujinxing’ correspond to the 1, 3, 4, 5, 8, 11, 13, 14, 18, 20 linkage groups of ‘Damianqiu’. QJX1 and DMQ1, DMQ3, DMQ4 have 37 shared markers (e2m21–400, e6m21–400, e5m22–195, etc.); DMQ8 and QJX15 have 2 shared markers (e22m20–1300, e22m20–680); DMQ11 and QJX6 have 4 shared markers (e17m17–250, e5m21–300, e13m17–270, e2m8–295); DMQ13 and QJX8 have 3 shared markers (e13m17–200, e13m17–440, e13m17–420); DMQ14 and QJX10 have 2 shared markers (e16m17–350, e16m17–255); QJX18 and DMQ18 have 2 shared markers (e15m17–170, e3m21–150); QJX20 and DMQ12 have 2 shared markers (e6m21–350, e6m21–215); QJX16 and DMQ5 have 2 shared markers (e14m16–370, e18m18–190). The data showed the high homology between these linkage groups. In future, we will add the co-dominance marker like SSR to make the integration of the two parents, and increase the density and uniformity of the map.
Conclusion
In this study, we used SRAP molecular markers to construct the first molecular genetic map of hawthorn in the world, as 18 linkage groups on male ‘Qiujinxing’ and 21 linkage groups on female ‘Damianqiu’ were obtained. Because the molecular markers were only few, the density of some linkage groups was not high. The chromosome number of hawthorn is 17, so the number of the linkage groups is 17 in theory. In the study, we obtained 18 linkage groups of male and 21 linkage groups of female. This indicates that at least in four chromosomes exist frequent commutation or gap. We are going to conduct more SRAP marker analysis, or increase other marker analysis such as SSR, SNP and ISSR. We can utilize complementarity between SRAP and SSR, ISSR, SNP to improve the density of the map and supplement the gap.
Many studies have reported the segregation distortion phenomenon in the construction of molecular genetic maps of other crops or fruit trees. They thought segregation distortion is ubiquitous in the construction of a map.[Citation18–21] Segregation distortion will not influence the QTL detection.[Citation22] The segregation distortion and the segregation marker have almost the same mapping efficiency. If the segregation distortion is removed, the gene of the relevant segment in the linkage map could lose the linkage relationship.[Citation23] The segregation distortion marker is used to conduct linkage analysis, if the linkage groups contain the *. In this study, some segregation distortion appeared in all kinds of segregation loci. We used segregation distortion markers to conduct the construction of a genetic map and marked them with * in the map.
Disclosure statement
No potential conflict of interest was reported by the authors.
Additional information
Funding
References
- Hemmat M, Weeden NF, Menganaris AG, Lawson DM. Molecular marker linkage map for apple. J Heredity. 1994;85(1):4–11.
- Liebhard R, Koller B, Gianfranceschi L, Gessler C. Creating a saturated reference map for the apple (Malus×domestica Borkh.) genome. TAG Theor Appl Genet. 2003;106(8):1497–1508.
- Kenis K, Keulemans J. Study of tree architecture of apple (Malus×domestica Borkh.) by QTL analysis of growth traits. Mol Breeding. 2007;19(3):193–208.
- Celton JM, Tustin DS, Chagné D, Gardiner SE. Construction of a dense genetic linkage map for apple rootstocks using SSRs developed from Malus ESTs and Pyrus genomic sequences. Tree Genet Genomes.2009;5:93–107.
- Pierantoni L, Dondini L, Cho KH, Shin IS. Pear scab resistance QTLs via a European pear (Pyrus communis) linkage map. Tree Genet Genomes. 2007;3:311–317.
- Chen C, Bowman KD, Choi YA, Dang PM, Rao MN, Huang S, Soneji JR, Greg McCollum T, Gmitter Jr FG. EST-SSR genetic maps for Citrus sinensis and Poncirus trifoliata. Tree Genet Genomes. 2008;4(1):1–10.
- Wang D, Karte R, Lezzoni AF. QTL analysis of flower and fruit traits in sour cherry. Theor Appl Genet. 2000;100(3–4):535–544.
- Faure S, Noyer JL, Horry JP, Bakry F, Lanaud C, Gozalez de León D. A molecular marker-based linkage map of diploid bananas (Musa acuminate). Theor Appl Genet. |1993;87(4):517–526.
- La Rosa R, Angiolillo A, Guerero C, Pellegrini M, Rallo L, Besnard G, Bervillé A, Martin A, Baldoni L. A first linkage map of olive(O lean europaea L.) cultivars using RAPD, AFLP, RFLP and SSR markers. Theor Appl Genet. 2003;106(7):1273–1282.
- Ma H, Moore PH, Liu ZY, Kim MS, Yu QY, Fitch MM, Sekioka T, Paterson AH, Ming R. High-density linkage mapping revealed suppression of recombination at the sex determination locus in papaya. Genetics. 2004;166:419–436.
- Blenda AV, Verde I, Georgi LL, Reighard GL. Construction of a genetic linkage map and identification of molecular markers in peach rootstocks for response to peach tree short life syndrome. Tree Genet Genomes. 2007;3:341–350.
- Zhao YH, Guo YS, Hu YL, Zhang B, Liu R, Ouyang R, Fu JX, Liu CM. Construction of a genetic linkage map of Litchi with RAPD, SRAP and AFLP. Acta Hortic Sinica. 2010;5:697–704.
- Guo YS, Zhao YH, Liu CJ, Ren PR, Huang TL, Fu JX, Lu BB, Liu CM. Construction of a Molecular Genetic Map for Longan Based on RAPD, ISSR, SRAP and AFLP Markers. Acta Hortic Sinica. 2009;36(5):655–662.
- Zhao YH, Liu ZD, Guo YS, Lin H. Establishment and optimization of SRAP conditions in C. pinnatifida Bge, Key Technology of Horticulture. 2011;36–39.
- Van Ooijen JW, Voorrips RE. Join Map 3.0, software for the calculation of Genetic linkage maps. http://www.kyazma.nl/index.php/mc.JoinMap/sc.Updates/. 2008
- Liu CM. Construction of molecular genetic linkage map and Germplasm resources analysis of Litchi (Litchi chinensis Sonn.) [PhD dissertation]. Guangzhou: South China Agricultural University; 2001.
- Voorrips RE. Map chart 2.2, software for the graphical presentation of linkage maps and QTLs. http://www.biometris.wur.nl/uk/Software/MapChart/. 2008.
- Cai Q, Guy CL, Moore GA. Extension of the linkage map in Citrus using random amplified polymorphic DNA (RAPD)markers and RFLP mapping of cold-acclimation-responsive loci. Theor Appl Genet. 1994;89(5):606–614.
- Gulsen O, Uzun A, Canan I, Seday U, Canihos E. A new citrus linkage map based on SRAP, SSR, ISSR, POGP, RGA and RAPD markers. Euphytica. 2010;173(2):265–277.
- Foolad M, Arulsekar S, Becerra V, Bliss FA. A genetic map of Prunus based on an interspecific cross between peach and almond. Theor App1 Genet. 1995;91:262–269.
- Voorrips RE. Mapping of two genes for resistance to clubroot (Plasmodiophora brassicas) in a population of doubled haplid lines of Brassica oleracea by means of RFLP and AFLP markers. Theor Appl Genet. 1997;94:75–82.
- Zhang DQ, Zhang ZY, Yang K. Genome-wide search for segregation distortion loci associated with the expression of complex traits in Populus tomentosa. For Stud China. 2007;9:1–6.
- Bradshaw HD, Stettler RF. Molecular genetics of growth and development in Populus: a genetic linkage map of a hybrid poplar composed of RFLP, STS, and RAPD markers. Theor Appl Genet. 1994;89:167–178.