
 ?Mathematical formulae have been encoded as MathML and are displayed in this HTML version using MathJax in order to improve their display. Uncheck the box to turn MathJax off. This feature requires Javascript. Click on a formula to zoom.
Abstract
Perfusion bioreactors with multilayer circular parallel plates scaffold have the potential to provide a considerable scalability in cells’ cultivation for tissue engineering. By now, relatively little attention has been focused on the uniform distribution of fluid shear stress (FSS) among the parallel plates. However, the magnitude of FSS has a significant effect on both proliferation and differentiation of cells. This paper analyses the relationship between the structural parameters of the scaffold and the distribution of FSS among the plates and then presents an approach to optimize the flow field within the bioreactors. By regulating the structural parameters of the scaffold, the uniform distribution of FSS on the 23-layers plates can be achieved. The resolution of FSS can be up to 0.001 Pa and the range of error restrained within ±0.00015 Pa. By means of structural optimization, the discrepancy of the flow field among the plates can be effectively diminished.
Introduction
Perfusion bioreactors with multilayer parallel plates scaffold have a potential in cell cultivation because of their good scalability in tissue engineering bioreactors.[Citation1,Citation2] Numerous researchers have implemented diverse studies based on bioreactors with this structure. Chen et al. [Citation3] adopted the multilayer parallel plate structure to design bioreactors. Then Park et al. [Citation4] and De Bartolo et al. [Citation5] designed a flat membrane bioreactor stacked with 20-layer plates. Afterward, Zhang et al. [Citation6] presented a bioreactor with radial flow within 50 layers of circular plates. Similarly, other authors [Citation7–15] utilized a cylindrical bioreactor composed of stacked double sandwich culture plates. Among these reports, little information is available about the distribution discrepancy of fluid shear stress (FSS) on each plate in different depth within the medium. However, the magnitude of FSS has a significant influence on cell proliferation and cell differentiation.[Citation16,Citation17] Thus, the discrepancy of FSS distribution on the different culture plates within one bioreactor will cause inconsistent cell cultivation, which is undesired in tissue engineering.
This paper is focused on implementing a uniform distribution of FSS on each plate in different depth under the culture medium's surface by optimizing the structural parameters of the bioreactor. In terms of relevant contents from many researches, such as Cherry and Papoutsakis,[Citation18] Bancroft et al.,[Citation19] Godwin et al. [Citation20] and Porter et al.,[Citation21] the level of FSS in their studies was up to 0.001 Pa. In this situation, the distribution uniformity of FSS on every plate had to be analysed. It is necessary to seek for an approach to reduce the discrepancy of the FSS distribution. This paper studies the relation between the FSS distribution and the structural parameters of the scaffold using the simulation technology of computational fluid dynamics (CFD).[Citation22] Based on this relation, a method for optimising the flow field on every layer with 0.001 Pa FSS was presented. As a result, some cells, which are very sensitive to FSS, such as bone marrow mesenchymal stem cells, will obtain more consistent proliferation rate in the perfusion bioreactor, optimized by this approach.
Materials and methods
Cylindrical perfusion bioreactor
A cylindrical perfusion bioreactor was constructed from a circular glass tank, which was used as a perfusion room that contained 23 layers of plates, stacked concentrically through a vertical stainless steel pipe, which served as a draft tube. In each interstitial space between every two adjacent plates, there were six deflector holes pierced through the wall of the steel pipe. A rectangular glass vessel, which served as a buffer chamber adhered to the circular tank, segregated by a baffle. Cultural medium was first pumped into the buffer chamber through a silicon hose and then it was spilled over into the perfusion tank through the window on the top of the baffle. Afterward, the fluid flowed into the draft steel pipe. Finally, driven by a peristaltic pump, the medium flowed into the outlet pipe coupled with the end of the draft steel pipe. The prototype of the configuration is shown in .
Figure 1. Prototype of the bioreactor with multilayer plates scaffold.
Note: Perfusion tank (1), support of perfusion tank (2), silicon hose (3), buffer chamber (4), baffle (5), multilayer plate scaffold (6), circular plate (7), draft tube (8), deflector hole (9), outlet of draft tube (10), outlet pipe (11), support of plate (12).
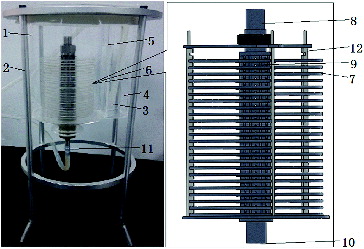
The scale of this type of bioreactor can be easily changed by altering the number of layers.
Simulation in computational fluid dynamics
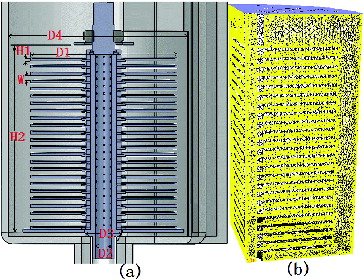
The geometry of the bioreactor was created by using the commercial software (SolidworksTM 2012). As shown in (a), D1 (100 mm) and H1 (2 mm) represent the diameter and thickness of the circular plates, respectively. W (3 mm) denotes the height of the interstitial space between the neighbouring plates. D2 (11 mm) and D3 (18 mm) are the inner and the outer diameter of the central draft pipe, respectively. The fluid height of 140 mm (H2) and the fluid diameter of 126 mm (D4) were used to simulate the flow. The upper surface of the first plate was located at 17.6 mm under the fluid's surface. These structural parameters were kept constant in all simulations. The meshing and fluid calculations were carried out by the CFD package (ANSYS™ 14.5). As depicted in (b), for the symmetrical geometry, simulated with CFD, only quarter of the computational domain along the vertical axis needed consideration. Non-structural tetrahedral meshing, isothermal, incompressible and Newtonian fluid with a dynamic viscosity of 0.0025 kg/(m s) and a density of 1007.4 kg/m3 were adopted in the simulations. At the top the fluid had an inlet velocity set at 0.000381 m/s (i.e. a flow rate of 4.75 mL/s) and the outlet of the central draft pipe was set as outflow. A laminar model was utilized ignoring the energy transfer process. These computational parameters also remained invariable in all simulations.
Figure 2. Cut-open view of multilayer plates configuration and computational grid.
Note: Cut-open view (a), computational grid for simulation (b). Diameter of the circular plates (D1), thickness of the circular plates (H1), height of the interstitial space between the neighbouring plates (W); inner (D2) and the outer (D3) diameter of the central draft pipe; fluid height (H2) and fluid diameter (D4).
Six groups of simulations with a deflector hole aperture of 1, 1.2, 1.4, 1.6, 1.8 and 2 mm were implemented for comparison. In each group the sizes of all deflector holes in the draft tube were the same.
The unit of FSS is Pa, calculated by CFD software FLUENT®, if not stated otherwise.
Statistical analysis
The simulated data of wall shear stress within a radius of 15–45 mm of the circular region on the top of the surface of each plate were exported into the software MATLAB. The software was set to get the mean values of FSS on every plate. The data of FSS on the first plate under the surface of the liquid was precluded because of the complex flow field upon it and because there were no cells cultured on it. Thus, to simplify the description, hereafter ‘the first plate’ represented the plate that was located at 22.6 mm depth under the surface of the liquid.
Six curves composed of six groups of mean values of FSS on 23-layers plates were separately fitted with exponential regression analysis category in software Origin8. Nonlinear curve fitting function, ExpDec1, was adopted. The formulation of ExpDec1 function was
(1)
(1) where
,
and
are variables of regression coefficients and x, y indicate the depth (mm) under the surface of the liquid and FSS (Pa), respectively.
Finally, in terms of the distribution of these FSS regression coefficients, which changed with the deflector hole size, suitable regression modes were employed to fit the curves about coefficients ,
and
. P < 0.05 was considered significant.
Results and discussion
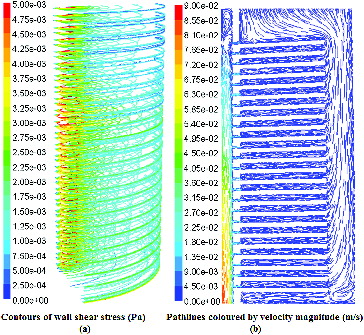
The simulation result of FSS distribution on 23-layer plates is shown in (a). (b) depicts the correspondent path-lines of the simulated velocity flow.
Figure 3. Distribution of fluid shear stress on every plate and flow velocity in vertical section.
Note: Distribution of FSS, the maximal value of y-coordinate is 5.00e−03 Pa (a); path-lines for flow velocity, the maximal of y-coordinate value is 9.00e−02 Pa (b).
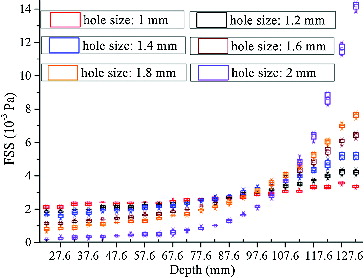
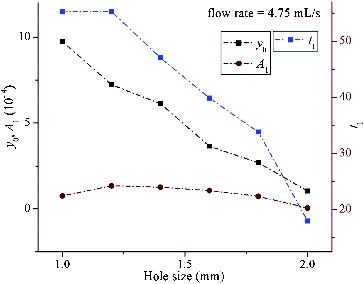
Six groups of mean values ±SD of FSS on 23-layer plates are depicted in , in which each colour curve indicates a kind of a deflector hole size.
Figure 4. Distribution of FSS on 23-layer plates, with six kinds of deflector hole sizes.
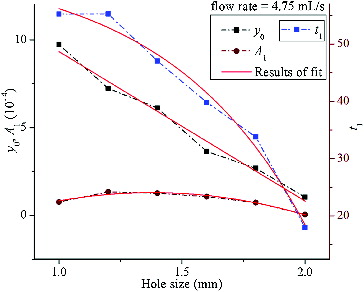
The results of the regression analysis for the six curves constructed from those mean values mentioned above are shown in , in which the x-coordinate represents the deflector hole size and the y-coordinate represents the magnitude of the coefficients from EquationEquation (1)(1)
(1) . According to the distribution characteristic of curves in , linear, two-order polynomial and exponential categories were performed to fit the coefficient curves y0,
and t1, respectively. The correspondent fitting functions are represented as follows:
Figure 5. The distribution of FSS regression coefficients y0, A1, t1.changing with deflector hole size.
Linear fitting function for :
(2.1)
(2.1)
Two-order polynomial fitting function for :
(3.1)
(3.1)
Exponential fitting function for :
(4.1)
(4.1) where h is the deflector hole aperture (mm) and
,
, c,
,
,
,
and
are regression coefficients. The fitting results are shown in and the formulations are
(2.2)
(2.2)
(3.2)
(3.2)
(4.2)
(4.2)
Figure 6. Fitting results of curves from .
By joining EquationEquations (2.2)(2.2)
(2.2) , (Equation3.2
(3.2)
(3.2) ), (Equation4.2
(4.2)
(4.2) ) and (Equation1
(1)
(1) ), the function about x, h and y can be represented as follows:
(5)
(5) where y is FSS, and x and h separately represent depth under the surface of the liquid and the deflector hole aperture. The range of h was defined by the parameter W as shown in (a).
The CFD method provides effective insights into the optimization and design of scaffolds and a full characterization of flow fields within the bioreactors. This technology allows us to predict the flow without carrying out numerous bioreactor experiments.
Based on the CFD simulation results shown in , the flow field among each parallel plate exhibited a steady laminar flow. Thus, the FSS on every plate can be calculated as given in the following [Citation23]:
(6)
(6) where τ is FSS (Pa), μ is the dynamic viscosity (kg/(m s)), Q is the flow rate (mL/s), d is the outer arc length (cm) of each plate and w is the vertical height (cm) of the fluid among every plate.
In light of EquationEquation (6)(6)
(6) , FSS linearly follows the change of Q, while μ, d and w keep constant. Consequently, considering EquationEquation (5)
(5)
(5) established at Q = 4.75 mL/s and μ, d, w remained invariable, EquationEquation (5)
(5)
(5) can be adjusted as
(7)
(7) where f is FSS based on the variable Q.
Furthermore, when only d and w remain constant, the formulation about FSS and the variable Q, μ can be similarly established as follows:
(8)
(8) where fss is FSS based on variable Q and μ.
According to the transverse changing tendency of FSS curves in , the FSS increased with the increase of the layer depth. Comparably, according to the vertical changing trend of FSS values in , the varying direction of FSS magnitude was divided at approximately 15th layer (i.e. before the 15th layer, FSS values along the y-coordinate decreased with the increase of deflector hole aperture; after the 15th layer, FSS values increased with the increase of deflector hole aperture). Based on these FSS distribution rules, an optimization method to uniform the FSS distribution among each plate by regulating the deflector hole aperture can be obtained intuitively: the aperture of the deflector holes had to decrease appropriately along both changing directions of the layer number from the 15th layer. The specific adjusting approach for the deflector hole size is depicted in .
Figure 7. Diagram of adjusting the deflector hole size.
In , because the beginning layer, i.e. the 15th layer (x = 92.6 mm), was obtained intuitively from , the hole apertures had to be changed by both increased and decreased steps in the process of adjusting the deflector hole size, in order to improve the accuracy of the outcome. To exemplify the effect of the optimizing method, a smaller value h = 1.2 mm and a corresponding FSS = 0.00145 Pa were selected to perform the adjusting process shown in . The adjusted results of the deflector hole size and the corresponding FSS distributions, deduced by EquationEquation (5)(5)
(5) , are separately shown in (b) and (b). For comparison, the original distributions of the hole size and FSS from are separately exhibited in (a) and (a). To simplify the adjusting process, the optimization strategy was established on the preconditions that the adjusting step n and the variation of h remained small enough so that the cross-correlation among every deflector hole size can be ignored. According to the range of h, n = 0.1 mm, i = +0.5 mm and j = −0.5 mm were adopted, where i and j were the searching range of n (i.e. ∑ n ∈ [j, i]). Based on these preconditions the practical FSS distribution under the optimized structural parameters will have discrepancy to the result obtained via EquationEquation (5)
(5)
(5) . Thus, the optimized structure was validated in CFD tool. The result of the validated FSS is shown in (c).
Figure 8. Distribution of deflector hole size (h) at different depth (x).
Note: Original distribution of deflector hole size (a); optimized distribution of deflector hole size (b).
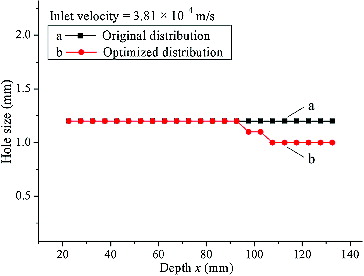
Figure 9. Distribution of FSS at different depth (x).
Note: Original distribution of FSS (a); optimized distribution of FSS (b); verified distribution of FSS (c). Fluid shear stress (FSS); computational fluid dynamics (CFD).
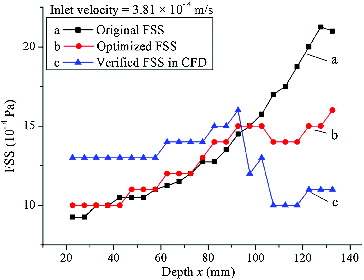
The validated result (the curve shown in (c)) indicated that the uniformity of practical FSS distribution under the optimized structural parameters was the best among the three curves in , which can be demonstrated in .
Table 1. Mean value, variance and peak-to-peak value of curves in .
As shown in , curve ‘c’ had the smallest variance and peak-to-peak value, which denoted that its uniformity of distribution was the best.
The verified results indicate that the optimizing approach presented in this paper is efficient to improve the uniformity of FSS distribution among parallel plates. By the optimizing strategy the consistent FSS with 0.001 Pa level can be provided for a large-scale cells cultivating, sensitive to FSS, such as bone marrow mesenchymal stem cells.
Conclusions
The uniformity of the flow field among multilayers parallel plates affects the scalability of perfusion bioreactors for the cultivation of cells. Within bioreactors with multilayers parallel plates scaffold, FSS discrepancy of distribution exists among plates even when the scaffold has perfectly the same structural parameters. The extent of this discrepancy intensifies as the number of layers increases, which diminishes the scalability of bioreactors. The analysis of the flow of the fluid within this structure, using CFD technology, indicated that the FSS distribution and the structural parameters of the deflector hole aperture among the parallel plates exhibited certain relationship. Based on this relationship, the uniformity of FSS distribution among the parallel plates could be improved by adjusting the structural parameters of the size of the deflector holes and the optimization design of the perfusion bioreactors with multilayers parallel plates scaffold could be realized.
Disclosure statement
No conflict of interest exits in this paper, and the paper is approved by all authors for publication.
Additional information
Funding
References
- Sekoal PT, Gueguim Kana EBG. Fermentative biohydrogen modelling and optimization research in light of miniaturized parallel bioreactors. Biotechnol Biotechnol Equip. 2013;27(4):3901–3908.
- Denchev P, Svanbaev E, Stefanov I, Atanasov A, Dudtis D. A tissue cultures system for high frequency somatic embryogenesis in medicago trautwettery. Biotechnol Biotechnol Equip. 2014;5(3):48–51.
- Chen Z, Tian P, Zhang H, Li G, Ding Y. Construction of a novel bioartificial liver system and its functional evaluation in vitro. Chin J Gen Surg. 2004;13(8):598–601. Chinese.
- Park J, Li Y, Berthiaume F. Radial flow hepatocyte bioreactor using stacked microfabricated grooved substrates. Biotechnol Bioeng. 2008;99(2):455–467.
- De Bartolo L, Jarosch-Von Schweder G, Haverich A, Bader A. A novel full-scale flat membrane bioreactor utilizing porcine hepatocytes: cell viability and tissue-specific functions. Biotechnol Prog. 2000;16(1):102–108.
- Zhang Y, Shi X, Han B, Gu J, Chu X, Xiao J, Ren H. Immunosafety assessment of a novel multilayer flat-plate bioartificial liver based on nanofiber scaffolds. Chin J Gen Surg. 2012;21:41–47. Chinese.
- Xia L, Arooz T, Zhang S, Tuo X. Hepatocyte function within a stacked double sandwich culture plate cylindrical bioreactor for bioartificial liver system. Biomaterials. 2012;33:7925–7932.
- Dunn JC, Tompkins RG, Yarmush ML. Long-term in vitro function of adult hepatocytes in a collagen sandwich configuration. Biotechnol Prog. 1991;7(3):237–245.
- Ferrini JB, Pichard L, Domergue J, Maurel P. Long-term primary cultures of adult human hepatocytes. Chem Biol Interact. 1997;107:31–45.
- Xia L, Ng S, Han R, Tuo X, Xiao G, Leo HL. Laminar-flow immediate-overlay hepatocyte sandwich perfusion system for drug hepatotoxicity testing. Biomaterials. 2009;30(30):5927–5936.
- Langsch A, Bader A. Long term stability of phase I and phase II enzymes of porcine liver cells in flat membrane bioreactors. Biotechnol Bioeng. 2001;76(2):115–125.
- Taguchi K, Matsushita M, Takahashi M, Uchino J. Development of a bioartificial liver with sandwiched-cultured hepatocytes between two collagen gel layers. Artif Organs. 1996;20(2):178–185.
- Swift B, Pfeifer ND, Brouwer KL. Sandwich-cultured hepatocytes: an in vitro model to evaluate hepatobiliary transporter-based drug interactions and hepatotoxicity. Drug Metab Rev. 2010;42(3):446–471.
- Hewitt NJ, Lechon MJ, Houston JB, Hallifax D, Brown HS, Maurel P. Primary hepatocytes: current understanding of the regulation of metabolic enzymes and transporter proteins, and pharmaceutical practice for the use of hepatocytes in metabolism, enzyme induction, transporter, clearance, and hepatotoxicity studies. Drug Metab Rev. 2007;39(1):159–234.
- Ansede JH, Smith WR, Perry CH, Brouwer KR. An in vitro assay to assess transporter-based cholestatic hepatotoxicity using sandwich-cultured rat hepatocytes. Drug Metab Dispos. 2010;38(2):276–280.
- Cheng Y, Ramos D, Lee P, Liang D, Yu X, Kumbar SG. Collagen functionalized bioactive nanofiber matrices for osteogenic differentiation of mesenchymal stem cells: bone tissue engineering. J Biomed Nanotechnol. 2014;10:287–298.
- Saini S, Wick TM. Concentric cylinder bioreactor for production of tissue engineered cartilage: effect of seeding density and hydrodynamic loading on construct development. Biotechnol Prog. 2003;19(2):510–521.
- Cherry RS, Papoutsakis ET. Physical mechanisms of cell damage in microcarrier cell culture bioreactors. Biotech Bioeng. 1988;32(8):1001–1014.
- Bancroft GN, Sikavitsas VI, Dolder J. Fluid flow increases mineralized matrix deposition in 3D perfusion culture of marrow stromal osteoblasts in a dose-dependent manner. Proc Natl Acad Sci U S A. 2002;99(20):12600–12605.
- Godwin TJ, Prewett TL, Wolf DA. Reduced shear stress: a major component in the ability of mammalian tissues to form three-dimensional assemblies in stimulated microgravity. J Cell Biochem. 1993;51:301–311.
- Porter B, Zauel R, Stockman H, Guldberg R, Fyhrie D. 3-D computational modeling of media flow through scaffolds in a perfusion bioreactor. J Biomech. 2005;38(3): 543–549.
- Georgiev D, Vlaev SD. Bioprocess improvement by design-modified bioreactor flow properties. Biotechnol Biotechnol Equip. 2012;26(4):3182–3186.
- Liu ZR, Jiang WY, Huo Y. The analysis of the steady flow in the flow chamber. J Hydrodynam. 1997;2:37–45.