
Abstract
Simple sequence repeats (SSRs) and sequence-related amplified polymorphism (SRAP) were employed to assess the genetic diversity and relationship among 108 ramie cultivars, which were collected from China, Japan, Indonesia and Myanmar. A total of 183 polymorphic bands were produced by using 21 SSR and 20 SRAP primer pairs. The genetic similarity matrix was obtained by using the similarity for qualitative data (SIMQUAL) subroutine of the Numerical Taxonomy and Multivariate Analysis System (NTSYS-pc) software statistical package, based on Jaccard's algorithms. The results showed that the similarity coefficient among the 108 ramie germplasms ranged from 0.22 to 0.89. By using principal components analysis (PCA) and unweighted pair-group method with arithmetic means (UPGMA), the 108 ramie germplasms were clustered into two categories. Shanon diversity index (SDI) was 1.1 and Nei's gene diversity index (NGDI) was 0.58 in the present study. When comparing their indexes, the genetic diversity in the different provinces was as follows: Guizhou (SDI 1.14, NGDI 0.61) > Jiangxi (SDI 1.11, NGDI 0.60) > Guangxi (SDI 1.05, NGDI 0.59) > Hunan (SDI 1.04, NGDI 0.58) > Hubei (SDI 1.02, NGDI 0.58) > Chongqing (SDI 0.96, NGDI 0.54). There was an abundant genetic diversity in ramie accessions growing in the China's Changsha field GenBank of ramie. Guizhou province had the highest genetic diversity and thus may be the origin centre of ramie's genetic diversity. The relationship between germplasms and geographic distribution was poor.
Keywords:
Introduction
Ramie (Boehmeria nivea L.), also called China Grass, is one of the oldest fibre crops, which has been cultivated in China for more than six thousand years. Ramie is a popular perennial plant, native to Eastern Asia.[Citation1] It is principally used for fabric production. The bark of the vegetative stalks is a resource of bast fibre. Ramie series products, such as shirts, underwear and socks, win a great popularity in the domestic markets.[Citation2] In addition, ramie is cultivated as fodder crop in South China, because of its raw protein (22%), crude fibre (18%), and other nourishments, which animals need from dry leaves.[Citation3,Citation4] For example, ramie leaves and young fleshy stems have been used to feed the beef cattle and goose in our institute. In recent years, ramie has been used for soil and water conservation in the valley of Yangtze River, due to its abundant roots and luxuriant foliage.[Citation5]
Genetic variation within crop species is a fundamental resource, which has been utilized in breeding programmes for the improvement of the crops.[Citation6] The understanding of the relationship between the individual parental germplasm accessions is also useful for germplasm resource management, cultivar protection and genetic evaluation. A variety of molecular techniques has been developed and could be used as DNA fingerprinting strategy to provide plant genetic diversity and genetic relationship information. At present, some molecular markers have been used to evaluate germplasm resources and to investigate the genetic relations in ramie germplasms, such as random amplified polymorphic DNA (RAPD),[Citation7–9] simple sequence repeat (SSR),[Citation10–12] inter-simple sequence repeat (ISSR),[Citation13–15] sequence-related amplified polymorphism (SRAP),[Citation11,Citation16,Citation17] restriction site amplification polymorphism (RSAP) [Citation11] and random amplified microsatellite polymorphism (RAMP).[Citation10] Jie et al. [Citation8] evaluated the genetic diversity of six drought resistant and six drought sensitive ramie cultivars using RAPD markers. Zhou et al. [Citation10] determined the genetic relationship between 20 cultivars by employing SSR, ISSR and RAMP markers. Meng et al. [Citation18] and Qiu et al. [Citation19] examined the genetic relationship between 38 and 13 wild germplasms of ramie with ISSR and RAPD markers, respectively. Kang et al. [Citation20] used ISSR molecular markers to evaluate the genetic relationship between 56 cultivars. Liu et al. [Citation16,Citation21] evaluated 40 inbred lines of ramie by using SRAP and ISSR markers. However, the number of the used cultivars in those studies was less than 100. To understand better the genetic evaluation of ramie, it is necessary to widen the germplasms.
Zou et al. [Citation11] evaluated the application of two technologies (SSR and SRAP markers) on germplasm genetic relations in ramie and found that SRAP markers can provide more relatedness information among ramie cultivars than SSR markers. The combination of SSR markers and SRAP markers is better than SSR markers alone, in order to assess the relatedness among ramie cultivars. The combination of SSR markers and SRAP markers analysis results are consistent with field trait analysis results.
The aim of the present study was to assess the genetic diversity among 108 ramie cultivars, which were collected from China, Japan, Indonesia and Myanmar, by using a combination of SSR and SRAP molecular markers. Such information would contribute to determine the optimal breeding strategies and to make great progress in ramie breeding.
Materials and methods
Plant material and DNA isolation
A total of 108 ramie accessions () grown in the China's Changsha field GenBank of ramie (112°54′E, 28°18′N) were used in this study, which represented 790 germplasms from the China's Changsha field GenBank of ramie.[Citation2] DNA was isolated from young leaves, which were collected from each ramie accession. The DNeasy plant mini prep kit (Qiagen, German) was used for the isolation of DNA.
Table 1. The used 108 ramie germplasms in the present study.
SSR and SRAP primers
Twenty one SSR primer pairs were synthesized according to Chen et al.[Citation22] Twenty SRAP primer pairs () were synthesized in Sangon, Shanghai.
Table 2. SRAP primers sequences used in the genetic assessment of ramie accessions.
SSR and SRAP analysis
SSR-primed polymerase chain reactions (PCRs) were carried out in 10 μL reaction volumes with 10 × PCR buffer (containing KCl, (NH4)2SO4, 15mmol/L MgCl2, Tris-HCl), 0.2 mmol/L dNTP, 1 U Taq DNA Polymerase (Tiangen), 0.5 μL forward primer (10 nmol/L, Tiangen Biotech Co., Beijing, China), 0.5 μL reverse primer (10 nmol/L, Tiangen Biotech Co., Beijing, China) and 0.5 μL DNA of each accession. The PCR conditions were as follows: 5 min at 94 °C, followed by 30 cycles of 30 s at 95 °C, 30 s at the primer-specific annealing temperature, 30 s at 72 °C and a final extension of 10 min at 72 °C.
SRAP-PCRs were optimized according to Wen et al. [Citation17] as follows: in total volumes of 20 μL with 2 μL of 10 × PCR buffer (containing KCl, (NH4)2SO4, 15mM MgCl2, Tris-HCl), 0.4 μL dNTPs (10 mmol/L), 0.5 μL forward primer (10 nmol/L, Tiangen Biotech Co., Beijing, China), 0.5 μL reverse primer (10 nmol/L, Tiangen Biotech Co., Beijing, China) (), 0.3 μL Taq DNA Polymerase (2.5 U/mL, Tiangen Biotech Co., Beijing, China), 0.2 μL DNA template, 15.9 μL ddH2O. The SRAP-PCR reactions were carried out on a Biometra T1 Thermocycler 96 (Germany). DNA amplification was performed with an initial step of 5 min at 94 °C and five cycles of 1 min at 94 °C, 1 min at 35 °C and 1 min at 72 °C. The following 30 cycles were at 94 °C for 1 min, 50 °C for 1 min and 72 °C for 1 min, with a final extension at 72 °C for 10 min.
The PCR products were separated on 8% polyacrylamide gels, and silver dyeing was conducted, according to Zhang et al.[Citation23] The molecular weights were estimated using a DNA marker (DNA Marker 2000, BioTeke Co., Beijing, China). Clear bands from the PCR products were recorded as 1 and the absence of bands as 0. Then, the received results were represented as a binary matrix.
Statistical analysis
SSR and SRAP analysis were repeated at least twice. The genetic similarity matrix was obtained by using the similarity for qualitative data (SIMQUAL) subroutine of the Numerical Taxonomy and Multivariate Analysis System (NTSYS-pc) software statistical package, based on Jaccard's algorithms. Similarity coefficients were used to construct genetic distance phenograms by the Shannon's (SHAN) method, based on unweighted pair-group method with arithmetic means (UPGMA). The above phenograms cluster analysis and the cluster analysis of principal components analysis (PCA) were performed by using NTSYS-pc software version 2.1.[Citation24] Shannon diversity index (SDI) and Nei's gene diversity index (NGDI) were calculated by Popgen 1.32.[Citation25]
Results and discussion
SSR and SRAP polymorphism
Twenty one SSR primer pairs resulted in clear bands. A total of 60 polymorphic bands were obtained, ranging from 100 to 200 bp. Among the 21 SSR primer pairs, 14 primer amplifications produced two alleles and seven primer amplifications produced three alleles.
Twenty SRAP primer pairs amplified a total of 123 polymorphic bands, ranging from 100 to 500 bp. Among the 20 primer pairs, the number of polymorphic bands per primers ranged from 1 to 11. The average polymorphic bands were found to be 6.15 per primer. Among the 20 primer pairs, E16–M34 exhibited the highest polymorphism (11 bands) and E16–M23 exhibited only one band. The allele polymorphism per primer of SRAP markers was 2.64 fold higher than the allele polymorphism of SSR markers, which indicated that the SRAP markers had a higher ability to produce polymorphic bands than the SSR markers.
During the studies of Liu et al. [Citation16] and Wen et al.,[Citation17] 10.1 and 6.8 polymorphic bands were produced by SRAP markers for ramie DNA amplification, respectively. The results were inconsistent with this study. Additionally, in our lab, there were 15.8 bands per primer in the previous study [Citation11] and only 6.15 bands per primer in the present study. The reasons for this may be in the electrophoretic technique, in the criteria of band recording or in the different primers, used in the present work.
Similarity coefficient among the 108 ramie germplasms
All of the allele polymorphisms, produced by the SSR and SRAP primers, were used to analyse the genetic relationship between the 108 germplasms. The similarity coefficient among the 108 ramie germplasms ranged from 0.22 to 0.89, which suggested that there was an abundant genetic diversity in the ramie accessions, growing in the Changsha field GenBank of ramie. The lowest similarity coefficient was 0.22 between code 26 and code 76, whereas the highest similarity coefficient was 0.89 between code 103 and code 104. Among the 108 ramie germplasms, for every pair, the similarity coefficient of 8 pairs of germplasms was more than 0.85 and of another 8 pairs of germplasms was less than 0.25. The similarity coefficient was less than 0.25 between codes 76 and 7 and more than 0.85 between codes 102 and 3, among the studied germplasms.
There have been many relationship analysis reports about crops, using SSR and SRAP markers.[Citation26,Citation27] SSRs are tandemly repeated DNA motifs (1–6 bp long), which number of repeats at a special locus may vary. It is very important for SSRs to be easy to use and analyse.[Citation28] Some studies confirm that SSRs are effective in analysing the relationship between germplasms in many crops, including cotton,[Citation26] citruses [Citation29] and so on. SRAP is a novel PCR-based marker system, which detects polymorphisms preferentially in coding sequences. It is an efficient technique, which reveals more informative bands, due to its capacity.[Citation30] The SRAP technology has been widely used in genetic identification of many crops, including cotton,[Citation31] kenaf [Citation27] and sugarcane.[Citation32] SSR and SRAP markers have been applied for genetic relationship identification in ramie. The previous studies confirmed that the genetic relationship identification could be improved by using the combination of SSR and SRAP markers, compared to their usage alone.[Citation11] Thus, the reliability of the results was improved in the present study.
Genetic relationship analysis
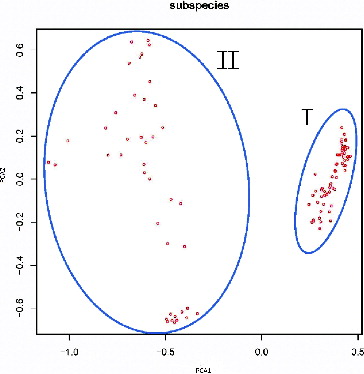
Association among the 108 genotypes was also obtained by PCA (). The categories were developed according to the score of the first and the second principal components of each germplasm. The results of the PCA showed that the 108 germplasms were clustered into two categories. The first category had a higher score of the first principal component, while the second category had a lower principal component.
Figure 1. PCA of 108 ramie varieties, based on SSR and SRAP marker polymorphism. Note: PCA1 and PCA2 in the axis represent the first and the second principal components, respectively. The numbers I and II on the figure represent the first and the second cluster of the accession, respectively.
To further describe the relationship between the 108 germplasms, based on the similarity coefficient, an UPGMA dendrogram of the 108 ramie germplasms was constructed ().
Figure 2. UPGMA dendrogram of the 108 ramie varieties based on SSR and SRAP marker polymorphism. Note: The x-axis represents the genetic similarity coefficient and the distance between two tick marks on the axis scale is 0.024. The numbers I and II on the figure represent the first and the second cluster of the accession, respectively.
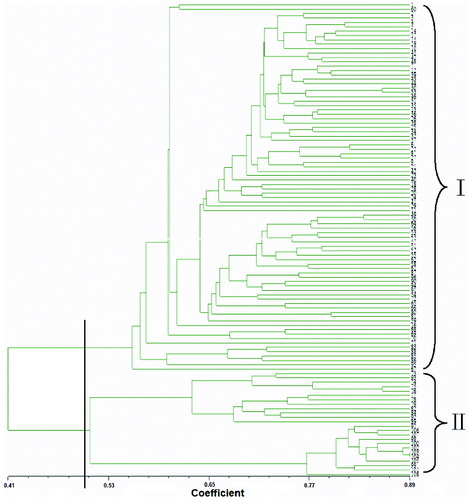
Using UPGMA, the 108 ramie germplasms were clustered into two categories. The first category included 84 varieties and the second category included 24 varieties. The first category included three subclasses, which contained 78, 5 and 1 germplasms. In the first subclass, 25 of the germplasms were from Jiangxi province and 10 were from Hunan province. Those were about 45% of the 78 germplasms, included in the first subclass. In the second subclass, one germplasm was from Hunan province and one was from Jiangxi province. Two germplasms were from Chongqing city and one was from Indonesia. Only one germplasm, which was originated from Chongqing city, was clustered into the third subclass.
The second category was comprised of two subclasses and each of them contained 12 germplasms. Four germplasms originated from Guizhou province and they were included in the first subclass. They were 33.3% of the germplasms in the first subclass. Two germplasms were from Jiangxi province. Sichuan, Yunan, Chongqing, Hubei, Japan and Indonesia had one germplasm each. In the second subclass, Hunan had three germplasms, which were 25%. Guizhou, Hubei and Guangxi province had two germplasms each. Chongqing, Jiangxi and Myanmar had one germplasm each.
The results indicated that the relationship between germplasms and the geographic distribution was poor, which was in agreement with previous researches.[Citation2,Citation11,Citation16,Citation21,Citation33] Liu et al. [Citation16,Citation21] clustered ramie germplasms from Brazil and China into one group by using SRAP and ISSR markers. Zou et al. [Citation11] also confirmed that the relationship between the ramie germplasms was not consistent with their geographical origin. In the process of constructing a core of ramie germplasms, Chen et al. [Citation33] found that the differences in the geographical origin among ramie cultivars did not reflect on the genetic differences in the germplasm resources of a local area. However, Zhou et al. [Citation10] found by using SSR, RAMP and ISSR markers that the kinship of ramie germplasms was consistent with their geographical distribution. Maybe the different result was attributed to the use of different cultivars and molecular markers.
SDI and NGDI were used to evaluate the germplasms' genetic diversity in the current study. SDI was 1.1 and NGDI was 0.58, which was inconsistent with the results of Liu et al. [Citation21] and Kang et al. [Citation20]. Liu et al. [Citation21] illustrated that SDI was 0.36 and NGDI was 0.24 for 40 inbred lines of ramie, and Kang et al. [Citation20] reported that SDI was 0.39 for 56 germplasms of ramie. This indicated that the present work provided a wide genetic diversity in ramie germplasms. It was beneficial for determining optimal breeding strategies and making a great progress in ramie breeding.
We compared the genetic diversity in more than 10 ramie germplasms from six provinces. The result is shown in . When comparing their indexes, the genetic diversity in the different provinces was as follows: Guizhou (SDI 1.14, NGDI 0.61) > Jiangxi (SDI 1.11, NGDI 0.60) > Guangxi (SDI 1.05, NGDI 0.59) > Hunan (SDI 1.04, NGDI 0.58) > Hubei (SDI 1.02, NGDI 0.58) > Chongqing (SDI 0.96, NGDI 0.54). This suggested that Guizhou province had the highest germplasm genetic diversity and may be the origin centre of the genetic diversity in ramie.
Table 3. Shannon diversity index (SDI) and Nei's gene diversity index (NGDI) in germplasms from different provinces.
Conclusions
There is an abundance of genetic diversity in ramie accessions growing in the China's Changsha field GenBank of ramie. Guizhou province may be the origin centre of this genetic diversity. The present work provided a wide genetic variety in ramie germplasms, which may be beneficial for making a great progress in determining optimal ramie breeding strategies. The results also showed that the relationship between germplasms and the geographic distribution was poor.
Disclosure statement
No potential conflict of interest was reported by the author(s).
Additional information
Funding
References
- Xiong HP. Bast-fiber crops breeding. Beijing: China Agricultural Science and Technology Press; 2008.
- Luan MB, Zou ZZ, Zhu JJ, Wang XF, Xu Y, Ma QH, Sun ZM, Chen JH. Development of a core collection for ramie by heuristic search based on SSR markers. Biotechnol Biotechnol Equip. 2014;28:5,798–804.
- Xiong HP. The production status and policy suggestion of bast and leaf fiber crops in China. Plant Fiber Sci China. 2010;32:301–304.
- Yu CM, Chen JR, Wang YZ. Research progresses of molecular breeding in ramie and forage ramie. Plant Fiber Sci China. 2007;29:389–392.
- Tu XN, Chen SC. Ramie - an effective plant for soil and water conservation in the southern sloped farmlands. Global Seabuckthorn Res Dev. 2007;5:45–48.
- Chikmawati T, Miftahudin M, Skovmand B. Amplified fragment length polymorphism-based genetic diversity among cultivated and weedy rye (Secale cereale L.) accessions. Genet Resour Crop Evol. 2012;59:1743–1752.
- Guo AP, Zhou P, Peng S. Factors affecting the reaction system of RAPD analysis in Boehmeria Jacq. Chinese J Trop Crop. 2001;22:64–69.
- Jie YC, Zhou QW, Chen PD. Genetic relation analysis of ramie genetypes with RAPD marker. China Fiber Crop. 1999;21:1–6.
- Meng ZQ, Liu LJ, Wang B. Double orthogonal optimization for RAPD-PCR reaction system in Boehmeria Jacq. J Yunnan Agr Univ. 2010;25:758–762.
- Zhou JL, Jie YC, Jiang YB. Genetic relation analysis on ramie cultivars with microsatellite markers. Acta Agr Sin. 2004;30:289–292.
- Zou ZZ, Chen JH, Luan MB. Evaluation of genetic relationship in ramie based on RSAP, SRAP, and SSR. Acta Agr Sin. 2012;38:840–847.
- Guo Y, Xiong HP, Chen P. Analysis on genetic diversity of S1 progeny of ramie variety zhongzhu No 2 by SSR markers. Plant Fiber Science in China. 2013;35:75–80.
- Liu LJ, Sun ZX, Peng DX. Optimization for ISSR reaction system in ramie (Boehmeria nivea L.Gaud.). Chinese Agr Sci Bull. 2006;22:64–68.
- Hou SM, Duan JQ, Liang XN, Ding XW, Liu FH. Detection for mtDNA of cytoplasmic male sterile (CMS) line and maintainer line of ramie [Boehmeria nivea (L.) Gaud.] by ISSR. Plant Physiol Commun. 2006;42:705–707.
- Ding MZ, Pan GT, Zhang ZH. Genetic relation analysis of Boehmeria nivea cultivars or lines from Sichuan with ISSR and construction of the molecular markers linked tomale sterile gene. J Nucl Agr Sci. 2008;22:183–187.
- Liu LJ, Peng DX, Wang B. Genetic relation analysis on ramie (Boehmeria nivea L. Gaud.) inbred lines by SRAP markers. Agr Sci China. 2008;7:944–949.
- Wen L, Yu CM, Wang YZ. Application of molecular marker SRAP on analysis of genetic diversity of polyembryonic ramie seedlings. J Hunan Agric Univ (Nat Sci). 2011;37:243–247.
- Meng ZQ, Liu LJ, Peng DX. Analysis on genetic diversity of ramie (Boehmeria nivea L. Gaud.) wild germplasm by RAPD and ISSR markers. Mol Plant Breed. 2009;7:365–370.
- Qiu CS, Cheng CH, Zhao LL, Li YJ. Genetic relationship among Boehmeria nivea spp. revealed by RAPD. Hubei Agric Sci. 2011;50:1499–1501.
- Kang DL, Jia HW, Jie YC. Study on genetic relationship among 56 cultivars of Boehmeria nivea based on ISSR markers. J Anhui Agri Sci. 2010;38:19954–19956.
- Liu LJ, Wang XX, Wang B. Analysis of genetic relationship of ramie (Boehmeria nivea) inbred line clones as revealed by ISSR. Sci Agr Sin. 2011;44:1543–1552.
- Chen JH, Luan MB, Song SF. Isolation and characterization of EST-SSRs in the ramie. African J Microbiol Res. 2011;5:3504–3508.
- Zhang J, Wu YT, Guo WZ. Fast screening of microsatellite markers in cotton with PAGE / silver staining. Acta Gossypii Sin. 2000;12:267–269.
- Rohlf FJ. NTSYS-pc v 2.1. Numerical taxonomy and multivariate analysis system. New York (NY): Applied Biostatistics Inc., Exeter Software; 2000.
- Yeh FC, Yang RC, Boyle T. POPGENE Version 1.31 quick user guide. Edmonton, Canada: Center for International Forestry Research, University of Alberta; 1999.
- Deepak RS, Satish RS, Prajwal BT. Genetic diversity analysis of maintainer and restorer accessions in upland cotton (Gossypium hirsutum L.). J Plant Biochem Biotechnol. 2011;20:20–28.
- Qi JM, Xu JT, Li AQ. Analysis of genetic diversity and phylogenetic relationship of kenaf germplasm by SRAP. J Nat Fiber. 2011;8:99–110.
- Morgante M, Olivieri AM. PCR-amplified microsatellites as markers in plant genetics. Plant J. 1993;3:175–182.
- Mohamed HA, Manosh KB, Zhang ZW. Exploitation of SSR, SRAP and CAPS-SNP markers for genetic diversity of citrus germplasm collection. Sci Hortic. 2011;128:220–227.
- Xu X, Zeng L, Li Y, Wang H. Inheritance of resistance to Phythophtora capsici in Capsicum annuum and analysis of relative SRAP markers. J Chem Pharm Res. 2014;6(6):1967–1972.
- Lin Z, He D, Zhang X. Linkage map construction and mapping QTL for cotton fibre quality using SRAP, SSR and RAPD. Plant Breeding. 2005;124:180–187.
- Chang D, Yang FY, Yan JJ. SRAP analysis of genetic diversity of nine native populations of wild sugarcane, Saccharum spontaneum, from Sichuan, China. Genet Mol Res. 2012;11:1245–1253.
- Chen JH, Luan MB, Xu Y. Construction of core germplasm in ramie. Plant Fiber Sci China. 2011;33:59–64.